Indian equities were clearly an outperformer compared to most global peers in CY23, more in mid and large-cap space. Interestingly, this was amidst geopolitical tensions, a rise in key policy rates across the globe and volatile commodity prices.
The domestic economy, nonetheless, was resilient all across this time frame with a revival in the private capex cycle, robust infrastructure spending by the government, record GST collection & most importantly margin expansion led to healthy high double-digit corporate earnings growth.
Nifty fair value pegged at 25000
Corporate earnings recovery has been healthy in the recent past with Nifty earnings growing at 22% CAGR over FY20-23. Going forward, introducing FY26E, we expect Nifty earnings to grow at a CAGR of 16.3% over FY23-26E.
Our Dec 2024 target for Nifty is set at 25,000 wherein we have valued Nifty at 20x PE on FY26E EPS of ₹1,250/share with corresponding Sensex target set as 83,250; offering a potential upside of ~15% from current index levels
Why we remain Bullish?
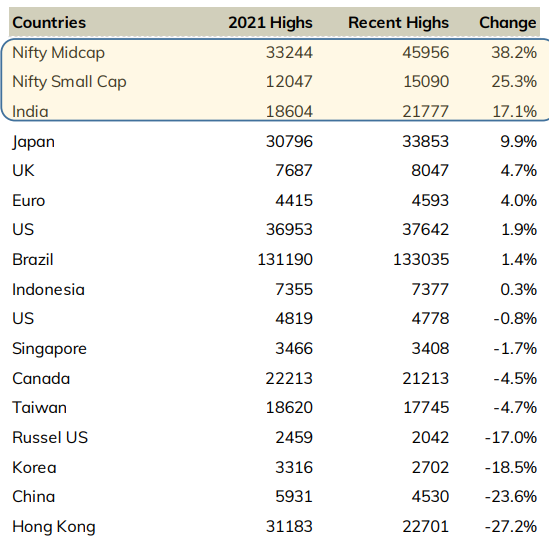
Indian Indices made fresh life highs and retained its the best performing market helped by resumption of foreign flows. The net flows for the current calendar year is nearly of $21 billion while rest of the emerging markets have seen nominal flows. In the post covid era, while most of the markets are still reeling below their 2021 highs, Indian indices have given significantly higher returns than the rest.
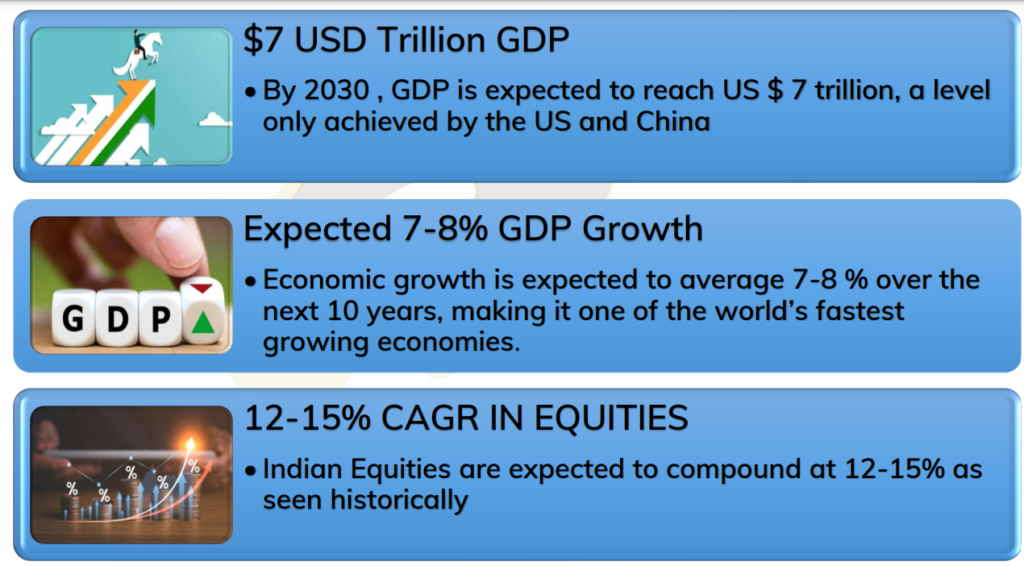
What India will be… in next 8-10 years!
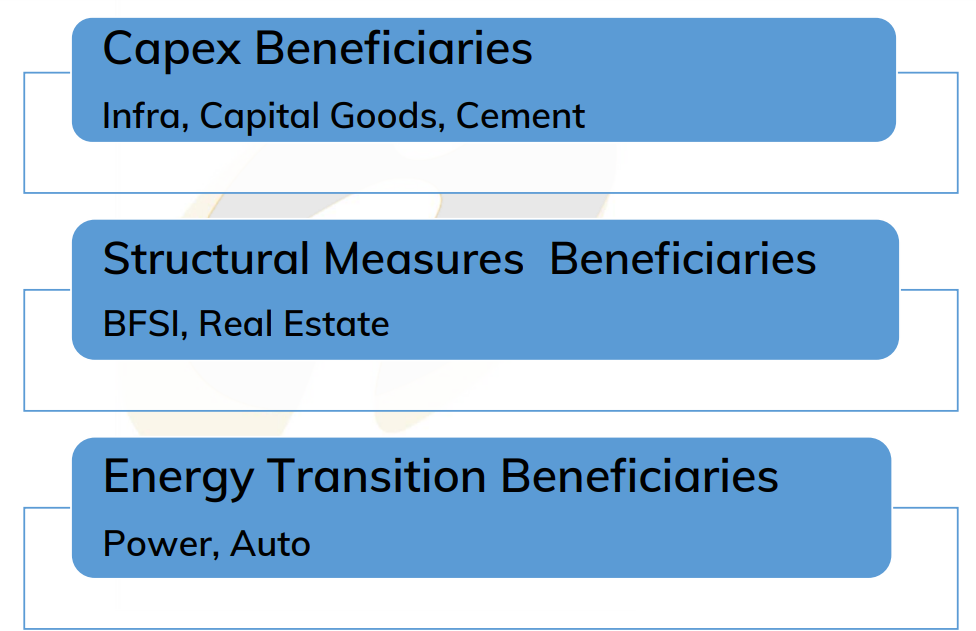
Sectors : Theme for the next Decade
For such updates, Stay connected with learning sharks.
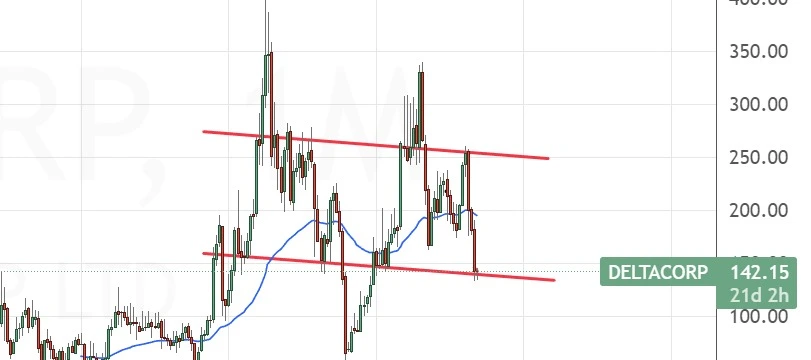
Do you play PUBG? or are you into the gaming industry? Don’t worry, It doesn’t matter if you play or not. However, learning more about technical and fundamental analysis is important if you want to earn in the stock Market. Let’s analyse Delta Corp NSE: 142.25 apiece.
Delta Corp has been in the news for its recent 28% imposed GST on its business. Since then the stock price fell from Rs 242 to 142 Today. Maybe it is time to take a look at this.
Considerably, the stock seems to be on its support right now, so we could see an upside from here. Few new positions can be made during this time as the company is doing well fundamentally.
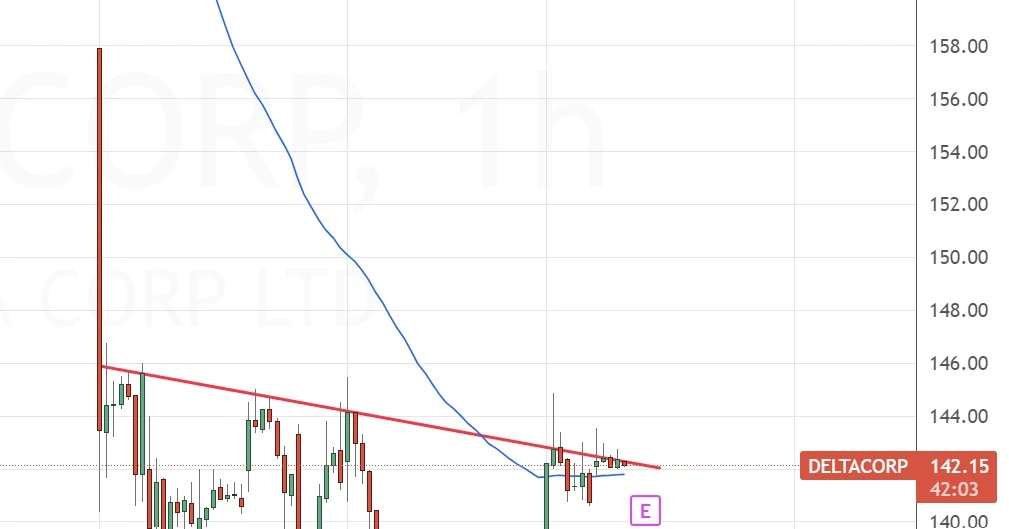
If you know a bit about breakout trading, or support and resistance,. You will find this stock trying to break its resistance in a smaller time frame.
As the stock is getting close to its resistance, It could break. Again, this is just for the educational purposes. If you wanna trade in a stock, you need to learn proper ways to make money.
Let’s look at the fundamentals of the Delta Corp
Profit & Loss
Consolidated Figures in Rs. Crores / View StandalonePRODUCT SEGMENTS
Mar 2012
Mar 2013
Mar 2014
Mar 2015
Mar 2016
Mar 2017
Mar 2018
Mar 2019
Mar 2020
Mar 2021
Mar 2022
Mar 2023
TTM
Sales +
365
425
559
300
375
455
608
798
773
419
616
1,021
1,043
Expenses +
264
330
408
233
244
293
360
482
486
397
477
654
685
Operating Profit
101
95
151
67
131
161
247
315
288
22
139
366
359
OPM %
28%
22%
27%
22%
35%
36%
41%
40%
37%
5%
23%
36%
34%
Other Income +
13
13
16
2
2
9
29
35
33
27
30
46
55
Interest
11
15
33
51
41
35
10
2
16
14
16
24
10
Depreciation
6
8
17
35
36
36
37
38
49
53
56
59
60
Profit before tax
96
85
117
-17
56
99
228
311
256
-18
98
329
344
Tax %
30%
40%
44%
-64%
36%
28%
32%
37%
28%
-42%
30%
20%
Net Profit +
67
49
64
-28
36
71
155
196
185
-26
68
262
273
EPS in Rs
2.24
1.29
1.55
-0.99
1.66
3.18
5.81
7.26
6.85
-0.90
2.51
9.77
10.17
Here is the list of courses, that you can go through here
Can I make a career in the stock market after this course? ok, let’s understand this. We at learning sharks- stock market institute offers share market courses. Thriving makes you a full-time stock trader or a full-time employee.
All things considered, Yes!, you would be able to do both of them after your course at our stock market institute. Once you learn how to trade in the stock market. The cash you would be generating can not be offered in any corporate. You become your own boss.
Besides
Yet, if you see the stock market as a passion yet still want to work after the course, we respect that. You can appear for the NCFM and NISM exams for which we btw pay if you clear with about 90%. A plethora of job vacancies are open for you once you clear the exam.
Altogether, From the banking sector, Insurance companies, broking houses and research houses. Also, financial institutions &investment banking sector as a terminal operator/dealer relationship executive. Manager, executive.
Apart from this manager in RMS, executive and manager in the depository department DP. Also, executive and manager in the back-office department, technical and fundamental analyst. The best is a research analyst.
Definitely, You can become a broker or sub-broker and do business. Furthermore, you can open your research advisory company. and give research tips to your clients. The choice is yours.
Here are some of the courses that you can do to make career in the stock market
Are you a beginner or an intermediate? we get students who happen to be a noobie. We recommend starting from the basics of the stock market. This 2 day’s class not only covers what is NSE and BSE? or what is stock market knowledge and words. It includes all the stock market topics you need to be aware of. These topics will be covered by an expert cum trader.
Further, we have Financial derivatives. This covers the options, futures, and strategies like a bull call spread, bear call ladder and so on. The derivative analysis course will be taken by a separate mentor cum full-time trader. He has experience in trading all the strategies. He is not only a mentor but a long-time profitable trader.
Later comes the Technical analysis module. This is known to be the backbone of the course. Furthermore, This includes over 25+ trading strategies, 35+ Chart patterns. Also, Types of candles and so much more.
Absolutely, This course is also taken by a separate mentor cum trader. He is a full-fledged technical analyst and has an experience in trading profitably. He introduces live trading from the first class.
Last but not the least, we have psychology and risk management. This module is the Most Important &covers over 100+ topics including what to expect, risks and so much more.
Undoubtedly, Once you complete this 2 months course, there is a paid internship. Where you sit down with your batch mates and take 100 trades. You can take trades in the classroom or after it. You will be assigned a trading buddy ( who has an experience in trading for years) and he will guide you through.
Finally, He knows how to handle an inexperienced trader. After all, he himself was a noobie once.
Apart from the batch mates, and teachers, he will be the best trading friend. Such as, You can share your trades with him through. He reports to all the mentors and will stop you from putting in loss-making trades. While encouraging you with a green flag when the trade is right.
Crash Course ( Recommended )
SO , For students with little time, there is a stock market crash course. The majority of the topics listed below are covered in this course. This BRIEF course contains enough material to teach you how to trade and invest. This may also be upgraded with lower fees to shark trader.
Do you like to read? How do you answer questions? What happens if a fresh stock market approach you try doesn’t work? Do you feel that you require criticism?
Although, we won’t be doing in-depth research in this course, the subjects we cover will be more than enough to help you navigate the stock market and succeed financially.
AWARDED & BEST IN THE MARKET FOR THIS PRICE
THE CRASH COURSE IS BRIEF AND BEST OF ALL OTHER COURSES UNDER REASONABLE PRICING.
Find here the Best Stock Market Books For Beginners-Share market books in Hindi, English and Marathi. On intraday, Technical analysis includes trade like a stock market wizard, a beginner’s guide to the stock market and you can be a stock market genius.
Below are the best stock market books for free download – PDF For beginners.
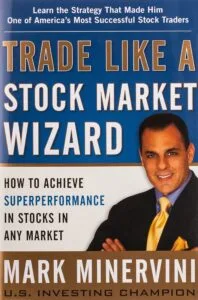
Title: Trade Like a Stock Market Wizard: How to Achieve Super Performance in Stocks in Any Market
Mark Minervini, a stock trader and investment genius who has won the US Investment Championship numerous times, wrote the book “Trade Like a Stock Market Wizard.” The book mostly guides his trading strategies and procedures, which he created during his successful career.
The book covers a wide range of topics, such as market analysis, finding high-potential stocks, risk management, and establishing a trading strategy. Minervini also shares his own experiences and cultural lessons, giving readers valuable insights into the world of stock trading.
2. You Can Be a Stock Market Genius Even if You’re Not Too Smart
Can you learn how to beat the stock market with a book? After all, billion-dollar portfolio managers can’t do it, and they assume no one can. Business academics not only believe it’s impossible, but they have plenty of facts to back it up. So, why should you invest in this book? Because Joel Greenblatt has been outperforming the stock market (with annual returns over 50%) for over ten years. And now he’s willing to teach you how to do it as well. In this funny and approachable book, you’ll discover the hidden locations of stock market gains.
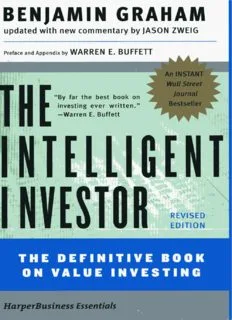
3. The Intelligent Investor – The Definitive Book on Value Investing
Publisher : Manjul Publishing House; First Edition (13 August 2021); Manjul Publishing House Pvt. Ltd., 2nd Floor, Usha Preet Complex, 42 Malviya Nagar, Bhopal – 462003 – India
Language : Hindi
बेंजामिन ग्राहम (1894-1976), वैल्यू इन्वेस्टिंग के जनक और आज के अनेक सफल व्यवसायियों की प्रेरणा हैं। वे सिक्योरिटी एनालिसिस और द इंटरप्रिटेशन ऑफ़ फ़ाइनेन्शियल स्टेटमेंट्स के लेखक भी हैं। जेसन ज़्वाइग मनी मैगज़ीन के वरिष्ठ लेखक तथा टाइम के अतिथि स्तंभकार, व म्यूज़ियम ऑफ़ अमेरिकन फ़ाइनेन्शियल हिस्ट्री के ट्रस्टी हैं। वे पूर्व में फ़ोर्ब्स के वरिष्ठ संपादक रहे हैं तथा 1987 से निवेश संबंधी लेखन कर रहे हैं।
4. Moving Averages 101: Incredible Signals That Will Make You Money in the Stock Market
Take advantage of our 20 years of trading knowledge. Reduce your odds of trading disaster by learning from someone who has been in the stock market for more than 20 years. Steve will explain moving averages and how to trade them.
Not sure where to begin? Do you have reservations about trading the 200-day moving average? Perhaps you don’t comprehend how to use moving averages in conjunction with other indicators. This book will help you understand trading better.
Understand moving averages This book will help you comprehend the power of moving averages.
Simple explanations of difficult subjects
Trading charts that are detailed and annotated
Gaining access to an active trading community
5. The Little Book of Sideways Markets: How to Make Money in Markets that Go Nowhere
Where does this leave your portfolio as the stock market becomes a roller-coaster ride of all-time highs and stomach-churning lows? You’re basically back where you started in 2000. This is good for Six Flags tourists, but for your retirement, savings, and investments, you’d like to get somewhere.
In The Little Book of Sideways Markets, respected value investor and author Vitaliy Katsenelson teaches you how to survive a market that is neither bull nor bear, but rather what he refers to as a cowardly lion—it exhibits brief bursts of confidence but is finally overpowered by fear.
According to Grant Henning, stock market trading may be both highly profitable and severely harmful to your financial health. It is obvious that stock trading is not for everyone, and no one should jump into it without proper preparation. In a volatile stock market, winning stock trading strategies must be constantly refined and adjusted to changing market conditions.
Henning has taken the finest components of each investment technique, including momentum, value, growth, and fundamental and technical analysis, and fine-tuned a trading system based on Excel-based research methodologies he has devised that works in volatile markets. In The Value and Momentum Trader, he unveils his statistical trading strategies and demonstrates how to use them to make winning bets.
Are you ready to change your trading strategy? You may now utilise the Market Profile to enhance standard technical analysis approaches such as support and resistance, chart patterns, and trend lines, rather than relying on lagging and confused indicators placed on charts.
The Market Profile, created in the 1980s by financial specialists at the Chicago Board of Trade, has evolved into one of the most sophisticated analytical tools for traders, investors, and market analysts. AND NOW YOU CAN OWN THE POWER OF THE MARKET PROFILE.
9. Dividends Still Don’t Lie: The Truth About Investing in Blue Chip Stocks and Winning in the Stock Market
Geraldine Weiss penned the classic Dividends Don’t Lie in 1988. That book described the dividend-value philosophy behind Investment Quality Trends, the highly successful newsletter started by Weiss and now edited by Kelley Wright. More than two decades later, the financial world has altered tremendously due to advances in computer technology and the Internet. Massive volumes of data and information may now be acquired, processed, and analysed in minutes.
What used to take weeks or months in a library can now be completed in one evening with a computer. What hasn’t changed is the dividend-value strategy’s track record of creating regular gains in the stock market. Dividends Still Don’t Lie demonstrates how the stock market continues to reward investors who recognise and value good value.
10. 5 Moving Average Signals That Beat Buy and Hold
Learn about five winning and time-tested trading techniques that outperform buy-and-hold investments. Steve walks you through the results of 16 years of backtesting on some of the most prominent moving average signals, so you can understand when to enter when to exit, and how to use backtesting to your benefit!
Conclusion
The stock market is not limited to books or theoretical knowledge. Although these new and old books are amazing to learn new topics. we’d still suggest you to learn practically. Here, are the list of courses, we offer.
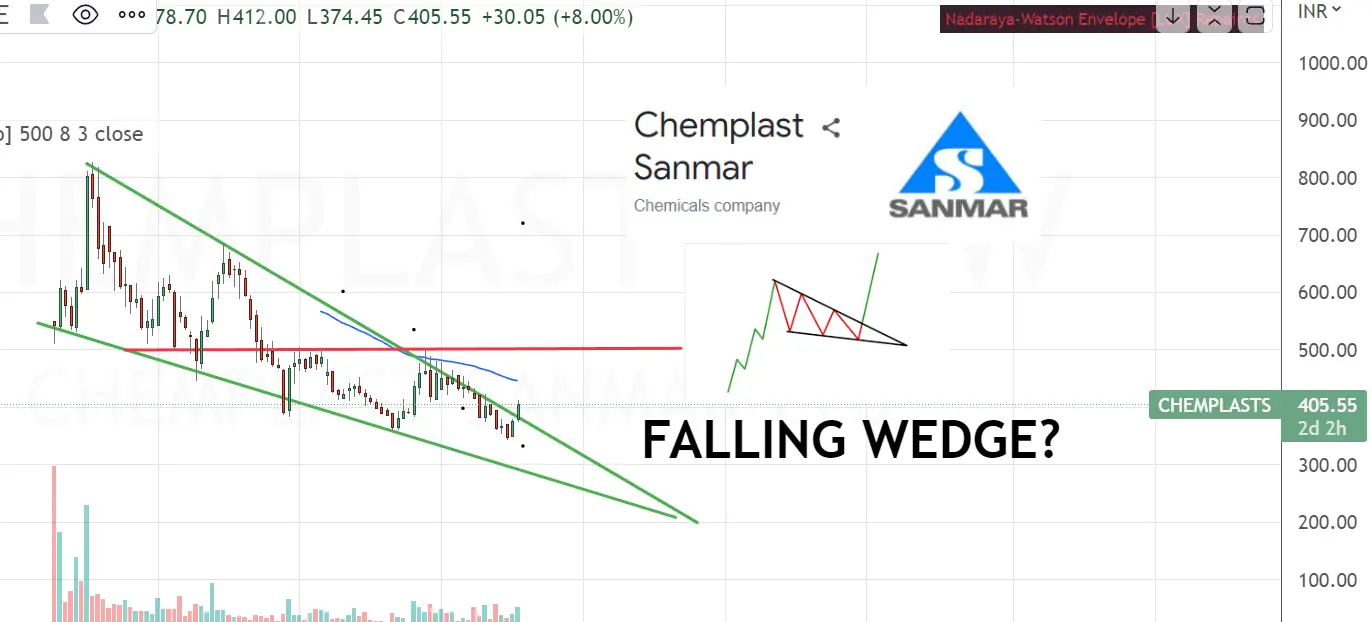
When the market makes lower lows and lower highs with a contracting range, a chart pattern arises. It suggests a possible reversal in the trend in the upward direction. That is called a Falling wedge pattern.
What are Technical Analysis Chart patterns?
A chart pattern is a shape within a price chart that helps to predict what prices will do next based on prior performance. Chart patterns are the foundation of technical analysis and necessitate a trader’s understanding of both what they are looking at and what they are looking for.
If you wanna learn about all the chart patterns for free, click here
Chemplast Sanmar Limited is a chemical firm based in India.[1] It is a leading producer of PVC resins, chlorochemicals, and pipe systems.
We recommend this stock at CMP 405, for multiple reasons. The stock has been taking a beating since its IPO listing. Fortunately, the company has been making only a profit, and it’s considered a bright addition to your portfolio.
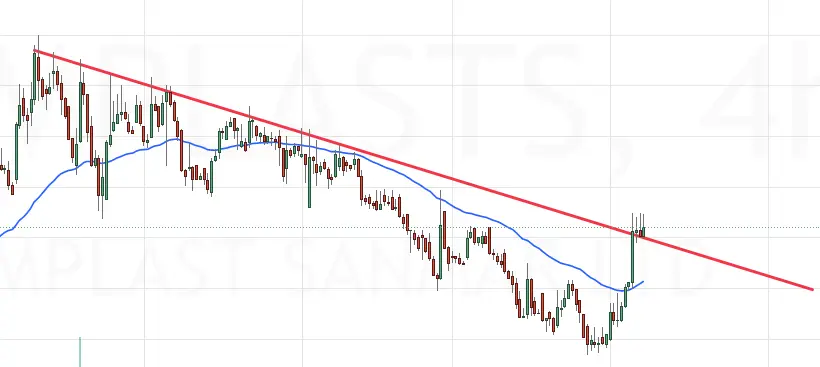
If you know about support and resistance; you will learn, the stock is on its resistance after multiple attempts of Breaking out.
Stock Breaking out of its resistance in the chart above.
Now that you have seen it on the chart along side the Falling wedge pattern. Let’s look at the fundamental side of the Chemplasts Sanmar.
Profit & Loss
Consolidated Figures in Rs. Crores / View StandalonePRODUCT SEGMENTS
Mar 2019
Mar 2020
Mar 2021
Mar 2022
TTM
Sales +
1,254
1,258
3,799
5,892
5,601
Expenses +
969
1,011
3,171
4,695
4,884
Operating Profit
286
247
628
1,197
717
OPM %
23%
20%
17%
20%
13%
Other Income +
12
8
484
57
-23
Interest
48
95
433
322
151
Depreciation
56
87
131
137
149
Profit before tax
193
72
547
796
395
Tax %
39%
36%
25%
18%
Net Profit
118
46
410
649
338
EPS in Rs
14.81
6.88
30.59
41.03
21.38
Dividend Payout %
0%
0%
0%
0%
Compounded Sales Growth
10 Years:
%
5 Years:
%
3 Years:
67%
TTM:
3%
Compounded Profit Growth
10 Years:
%
5 Years:
%
3 Years:
75%
TTM:
-50%
Stock Price CAGR
10 Years:
%
5 Years:
%
3 Years:
%
1 Year:
-35%
Return on Equity
10 Years:
%
5 Years:
%
3 Years:
12%
Last Year:
50%
P&l of Chemplasts sanmar
Balance Sheet
Consolidated Figures in Rs. Crores / View StandaloneCORPORATE ACTIONS
Mar 2019
Mar 2020
Mar 2021
Mar 2022
Sep 2022
Share Capital +
67
1,274
1,251
79
79
Reserves
2,433
1,845
-417
1,626
1,705
Borrowings +
253
82
943
882
925
Other Liabilities +
1,049
2,113
3,893
3,014
3,101
Total Liabilities
3,802
4,108
4,487
5,601
5,810
Fixed Assets +
2,108
2,174
3,148
3,259
3,211
CWIP
117
8
25
34
73
Investments
1,159
1,458
0
0
0
Other Assets +
418
467
1,313
2,308
2,525
Total Assets
3,802
4,108
4,487
5,601
5,810
The balance sheet of Chemplasts sanmar
Conclusion
Now that you have seen the fundamentals and the technicals of this stock. You would see the price CMP 405 is a good price to add on. However, as a Disclaimer, we suggest you do your complete analysis before adding this stock. This is not buying financial advice, but instead merely for education purposes.
If you are new to this page, Don’t forget to check out our courses page.
Trading stocks is a dynamic and unique career in and of itself. However, due to easy entry to the market and the potential for huge profits quickly, non-professional people enter the activity. The number of De-mat accounts created at various countries’ central depository systems indicates that the number of traders and investors joining the capital markets has reached historic highs. Most of them lose some or all of their money due to their unquenchable avarice before giving up or going back to learning the fundamentals. Even cautious buyers occasionally engage in trading, which depletes their wealth.
Life Style of a Trader
The prevalence of sleep disorders has increased as a result of contemporary socioeconomic and lifestyle variables. There needs to be advocacy for proper sleep hygiene, amount, and quality. The week on the Indian stock exchanges runs from Monday to Friday. Trading is permitted on the equity exchange from 9:00 AM to 3:30 PM.
The commodity market, however, is available from 10 AM to 11:30 PM. Occasionally, suggestions to advance market timings were made. SEBI published a discussion document outlining the advantages of extending market hours. (SEBI, 2018). The ideas were mostly abandoned, though, for operational reasons.
Participants in the financial markets have lost two hours of slumber per day over the past century. Following a weekend of daylight saving time, the markets have experienced sharp declines that are ascribed to sleep asynchronies.
Stress in Life of a Trader
Griffith, Najand, and Shen (2019) investigated small investor mood measurement in the dimensions of fear, gloom, joy, and stress to forecast market returns and market volatility. Fear significantly and persistently affects market results. Stress has a one-day lag and is observed to have a relatively smaller effect on returns.
Joy and happiness have no bearing on forecasting returns. According to studies, optimistic investors who are joyful are more likely to anticipate positive market gains. The stressful nature of stock market trading often makes the trader’s worst adversary the merchant. The trader has an advantage if they are conscious of stress level measurement technology like Ambient Intelligence.
Mental Health of a Trader
Well-documented, violent stock market shocks and crashes are discussed in research groups. Examining the connections between behavioral agreement, correlation to stock market returns, and market volatility reveals a phase transition between the indicators. Significant coupling strength causes a rise in all three variables.
Trading participants ignore their random factors and adhere to the market trend when coupling strength is equivalent to one. A lot of studies have been done on the effects of events on stock markets, including how they affect liquidity and volatility. Economic and Financial.
stress can potentially lead to human capital loss in the form of suicide or murder-suicide. Financial trading is a job that requires careful risk management. Dynamic and unpredictable markets frequently cause trades to skip the risk management step, which can result in financial loss and, in the worst instances, suicide. Mental health studies have found a close relationship between trading risk, financial debt, and stock market failure.
For some experienced traders, trading stocks is a type of self-employment. In general, self-employment increases job and life satisfaction but may also raise mental health issues, despite the fact that the self-employed do not see it as mentally challenging.
If you liked this article, do visit our Instagram page to follow more of such content.
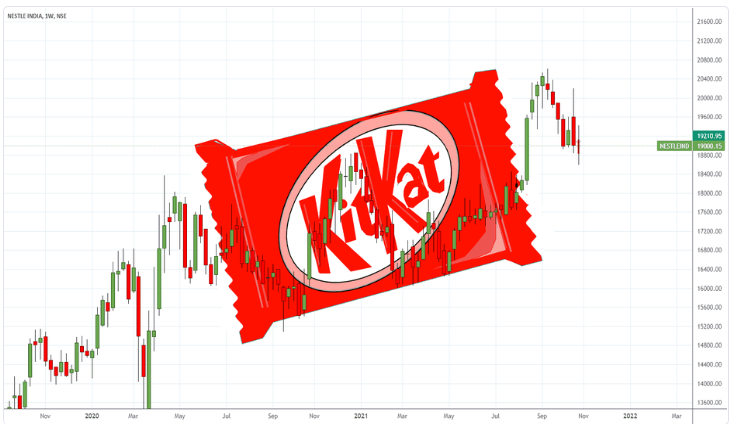
NESTLE started doing business in India in 1912, importing and selling finished goods there. The business gradually increased its presence in India. Are you holding this stock?
The company has maintained its share capital and its continuous supply of FMCG made this stock a multi-bagger. If anybody had invested in this stock in 2010, this stock would have given 600% growth along with Dividends and bonuses.
Nestle CMP is Rs20338 as of Dec 13 which is almost its all-time high. Ideally is it not advised to make a new entry at this point of time? While looking at the NIFTY 50 CMP 18608 again at its all-time high suggesting the stocks would see resistance at this level.
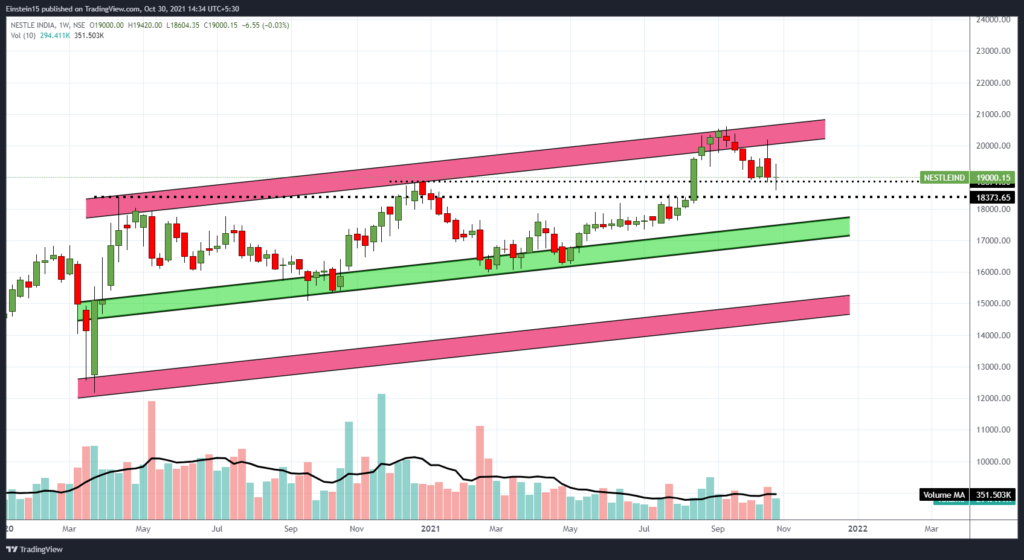
Let’s look at the technical analysis of the stock.
Nestle stock price chart – Technical analysis
Looking at the technical analysis of the stock, the stock seems to be touching the upper band of the channel. Another entry can be taken somewhere around the support.
let’s look at the fundaments of this stock
Quarterly Results Figures in Rs. Crores
Sep 2019
Dec 2019
Mar 2020
Jun 2020
Sep 2020
Dec 2020
Mar 2021
Jun 2021
Sep 2021
Dec 2021
Mar 2022
Jun 2022
Sep 2022
Sales +
3,216
3,149
3,325
3,050
3,542
3,433
3,611
3,477
3,883
3,739
3,981
4,037
4,591
Expenses +
2,449
2,455
2,532
2,303
2,658
2,656
2,681
2,629
2,935
2,874
3,056
3,217
3,580
Operating Profit
766
694
793
748
884
777
930
848
948
866
925
819
1,011
OPM %
24%
22%
24%
25%
25%
23%
26%
24%
24%
23%
23%
20%
22%
Other Income +
56
45
43
38
34
31
30
29
34
-209
21
19
31
Interest
32
31
41
41
40
42
54
52
52
44
36
37
37
Depreciation
91
94
91
92
91
96
94
95
96
106
104
102
98
Profit before tax
700
614
704
652
786
670
812
730
834
507
806
700
906
Tax %
15%
23%
25%
25%
25%
28%
26%
26%
26%
24%
26%
26%
26%
Net Profit
595
473
525
487
587
483
602
539
617
387
595
515
668
EPS in Rs
61.74
49.02
54.50
50.47
60.89
50.13
62.46
55.86
64.03
40.10
61.68
53.45
69.32
Raw PDF
Profit & Loss
Figures in Rs. Crores
Dec 2010
Dec 2011
Dec 2012
Dec 2013
Dec 2014
Dec 2015
Dec 2016
Dec 2017
Dec 2018
Dec 2019
Dec 2020
Dec 2021
TTM
Sales +
6,255
7,515
8,335
9,101
9,855
8,175
9,141
10,010
11,292
12,369
13,350
14,709
16,348
Expenses +
5,016
5,990
6,509
7,153
7,816
6,620
7,292
7,913
8,675
9,443
10,149
11,118
12,727
Operating Profit
1,239
1,525
1,825
1,948
2,039
1,555
1,850
2,097
2,618
2,926
3,202
3,592
3,620
OPM %
20%
20%
22%
21%
21%
19%
20%
21%
23%
24%
24%
24%
22%
Other Income +
35
21
31
97
87
-391
140
177
259
247
146
-116
-138
Interest
1
5
27
37
14
3
91
92
112
129
164
201
153
Depreciation
128
153
277
330
338
347
354
342
336
370
370
390
410
Profit before tax
1,145
1,388
1,553
1,678
1,774
814
1,545
1,839
2,429
2,673
2,813
2,884
2,920
Tax %
29%
31%
31%
33%
33%
31%
35%
33%
34%
26%
26%
26%
Net Profit
819
962
1,068
1,117
1,185
563
1,001
1,225
1,607
1,968
2,082
2,145
2,165
EPS in Rs
84.91
99.73
110.76
115.87
122.87
58.42
103.86
127.07
166.67
204.16
215.98
222.46
224.55
Dividend Payout %
57%
49%
44%
42%
51%
83%
61%
68%
69%
168%
93%
90%
Balance Sheet
Figures in Rs. CroresCORPORATE ACTIONS
Dec 2010
Dec 2011
Dec 2012
Dec 2013
Dec 2014
Dec 2015
Dec 2016
Dec 2017
Dec 2018
Dec 2019
Dec 2020
Dec 2021
Jun 2022
Share Capital +
96
96
96
96
96
96
96
96
96
96
96
96
96
Reserves
759
1,178
1,702
2,272
2,741
2,721
3,186
3,324
3,577
1,822
1,923
1,988
2,232
Borrowings +
0
971
1,050
1,189
20
18
33
35
35
189
147
266
280
Other Liabilities +
1,703
2,157
2,315
2,756
2,963
3,251
3,495
3,907
4,379
5,065
5,733
5,860
6,007
Total Liabilities
2,558
4,402
5,164
6,314
5,820
6,086
6,810
7,363
8,088
7,173
7,900
8,210
8,616
Fixed Assets +
1,013
1,576
3,204
3,369
3,177
2,898
2,730
2,616
2,401
2,341
2,179
2,994
3,054
CWIP
349
1,372
344
295
245
231
188
94
105
143
639
246
197
Investments
151
134
365
851
812
1,325
1,756
1,979
2,658
1,751
1,464
774
809
Other Assets +
1,046
1,320
1,251
1,799
1,586
1,633
2,136
2,673
2,924
2,937
3,618
4,196
4,556
Total Assets
2,558
4,402
5,164
6,314
5,820
6,086
6,810
7,363
8,088
7,173
7,900
8,210
8,616
Cash Flows
Figures in Rs. Crores
Dec 2010
Dec 2011
Dec 2012
Dec 2013
Dec 2014
Dec 2015
Dec 2016
Dec 2017
Dec 2018
Dec 2019
Dec 2020
Dec 2021
Cash from Operating Activity +
1,037
1,158
1,693
1,796
1,644
1,098
1,466
1,818
2,052
2,295
2,454
2,271
Cash from Investing Activity +
-446
-1,528
-941
-441
-432
-70
-126
-131
-52
83
-321
-1,957
Cash from Financing Activity +
-544
323
-513
-580
-1,635
-498
-666
-997
-1,317
-3,602
-1,956
-2,019
Net Cash Flow
47
-47
239
775
-423
529
674
691
683
-1,223
177
-1,704
Ratios
Figures in Rs. Crores
Dec 2010
Dec 2011
Dec 2012
Dec 2013
Dec 2014
Dec 2015
Dec 2016
Dec 2017
Dec 2018
Dec 2019
Dec 2020
Dec 2021
Debtor Days
4
6
4
3
4
4
4
3
4
4
5
4
Inventory Days
82
89
86
79
82
103
107
91
92
107
107
111
Days Payable
106
92
63
68
71
94
91
99
118
124
115
122
Cash Conversion Cycle
-20
3
28
14
15
12
20
-5
-22
-14
-3
-7
Working Capital Days
-51
-14
-11
-17
-13
-21
-10
-15
-21
-19
-21
-15
ROCE %
161%
90%
62%
53%
56%
46%
54%
57%
71%
96%
139%
147%
Shareholding Pattern
Numbers in percentagesDEALS / TRADES
8 recently
Dec 2019
Mar 2020
Jun 2020
Sep 2020
Dec 2020
Mar 2021
Jun 2021
Sep 2021
Dec 2021
Mar 2022
Jun 2022
Sep 2022
Promoters +
62.76
62.76
62.76
62.76
62.76
62.76
62.76
62.76
62.76
62.76
62.76
62.76
FIIs +
12.07
11.81
12.10
11.51
12.84
12.29
12.43
12.31
12.35
12.01
11.65
12.05
DIIs +
8.92
9.12
8.71
8.91
7.75
7.95
7.92
7.99
7.89
8.60
9.14
8.86
Government +
0.07
0.07
0.07
0.00
0.00
0.00
0.00
0.00
0.00
0.00
0.00
0.00
Public +
16.18
16.24
16.36
16.82
16.65
16.99
16.88
16.93
16.99
16.62
16.45
16.33
Overall the company seems good to hold. However, It might take a healthy correction. If you wanna learn about the course check out our courses page.