First, EMIs make luxury feel affordable. Second, social pressure pushes us to match friends, family, even neighbours. And third, banks and fintechs sell EMIs like candy — “Sir, just ₹2,999 per month.”
Multiple EMIs eat away savings, leaving you paycheck-to-paycheck.
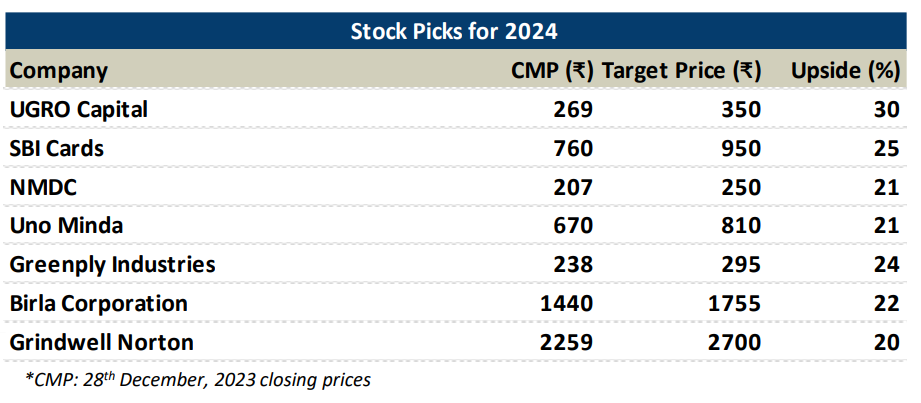
The Smarter Way Forward
Not all EMIs are bad. A home loan or education loan can build assets. But EMIs on gadgets, vacations, or lifestyle spends? That’s where debt traps begin.
India’s EMI lifestyle is booming, but remember: if inflation is shrinking your money and EMIs are swallowing the rest, your salary is just passing through your account.
So next payday, ask yourself — Are you owning your life, or are EMIs owning you?
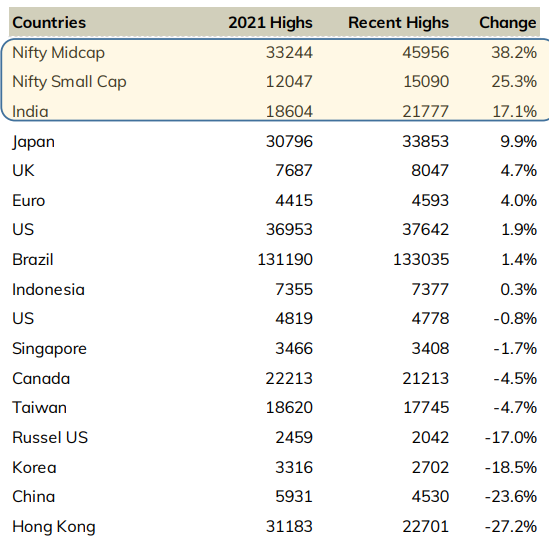
Indian equities were clearly an outperformer compared to most global peers in CY23, more in mid and large-cap space. Interestingly, this was amidst geopolitical tensions, a rise in key policy rates across the globe and volatile commodity prices.
The domestic economy, nonetheless, was resilient all across this time frame with a revival in the private capex cycle, robust infrastructure spending by the government, record GST collection & most importantly margin expansion led to healthy high double-digit corporate earnings growth.
Nifty fair value pegged at 25000
Corporate earnings recovery has been healthy in the recent past with Nifty earnings growing at 22% CAGR over FY20-23. Going forward, introducing FY26E, we expect Nifty earnings to grow at a CAGR of 16.3% over FY23-26E.
Our Dec 2024 target for Nifty is set at 25,000 wherein we have valued Nifty at 20x PE on FY26E EPS of ₹1,250/share with corresponding Sensex target set as 83,250; offering a potential upside of ~15% from current index levels
Why we remain Bullish?
Indian Indices made fresh life highs and retained its the best performing market helped by resumption of foreign flows. The net flows for the current calendar year is nearly of $21 billion while rest of the emerging markets have seen nominal flows. In the post covid era, while most of the markets are still reeling below their 2021 highs, Indian indices have given significantly higher returns than the rest.
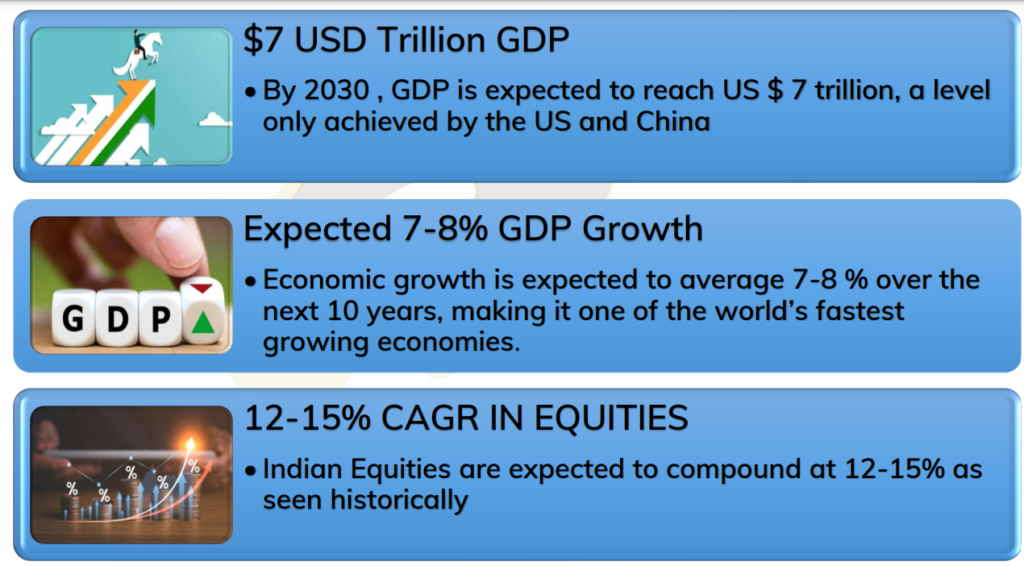
What India will be… in next 8-10 years!
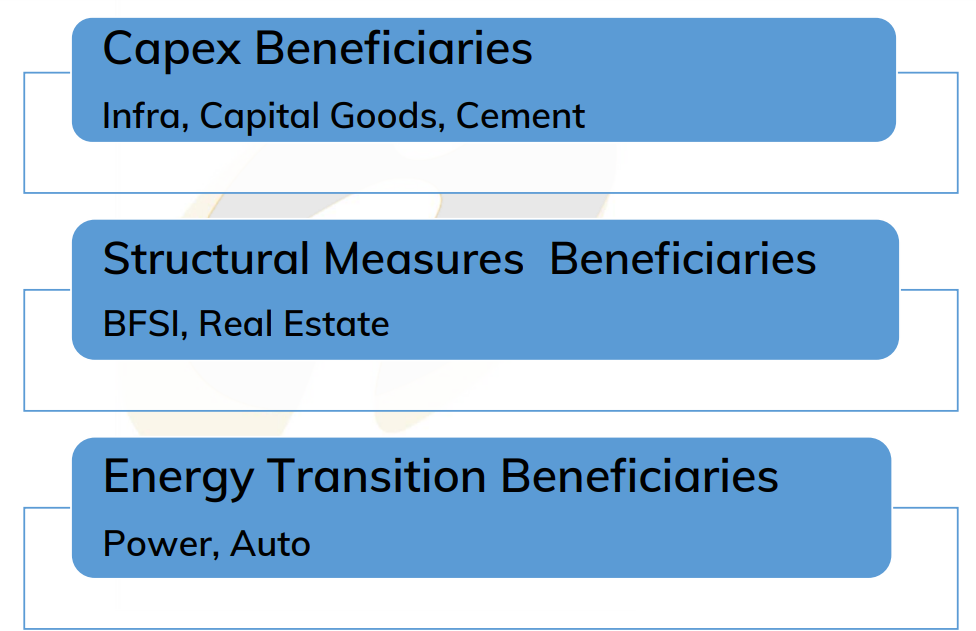
Sectors : Theme for the next Decade
For such updates, Stay connected with learning sharks.
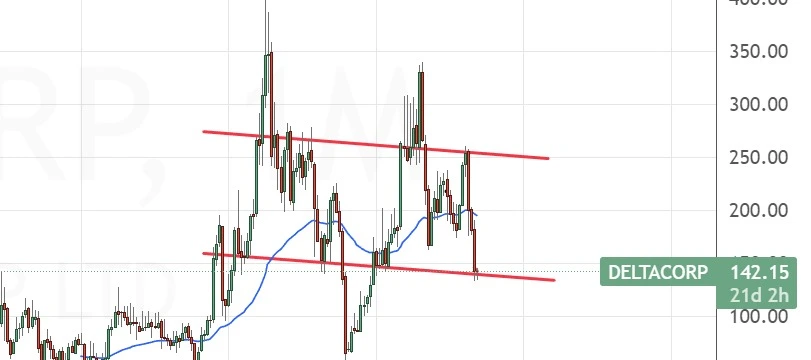
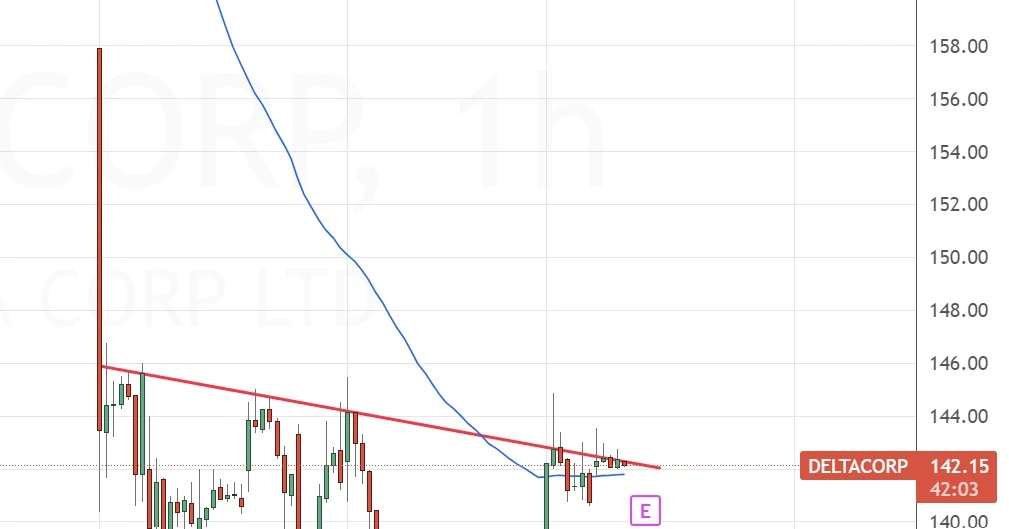
Do you play PUBG? or are you into the gaming industry? Don’t worry, It doesn’t matter if you play or not. However, learning more about technical and fundamental analysis is important if you want to earn in the stock Market. Let’s analyse Delta Corp NSE: 142.25 apiece.
Delta Corp has been in the news for its recent 28% imposed GST on its business. Since then the stock price fell from Rs 242 to 142 Today. Maybe it is time to take a look at this.
Considerably, the stock seems to be on its support right now, so we could see an upside from here. Few new positions can be made during this time as the company is doing well fundamentally.
If you know a bit about breakout trading, or support and resistance,. You will find this stock trying to break its resistance in a smaller time frame.
As the stock is getting close to its resistance, It could break. Again, this is just for the educational purposes. If you wanna trade in a stock, you need to learn proper ways to make money.
Let’s look at the fundamentals of the Delta Corp
Profit & Loss
Consolidated Figures in Rs. Crores / View StandalonePRODUCT SEGMENTS
Mar 2012
Mar 2013
Mar 2014
Mar 2015
Mar 2016
Mar 2017
Mar 2018
Mar 2019
Mar 2020
Mar 2021
Mar 2022
Mar 2023
TTM
Sales +
365
425
559
300
375
455
608
798
773
419
616
1,021
1,043
Expenses +
264
330
408
233
244
293
360
482
486
397
477
654
685
Operating Profit
101
95
151
67
131
161
247
315
288
22
139
366
359
OPM %
28%
22%
27%
22%
35%
36%
41%
40%
37%
5%
23%
36%
34%
Other Income +
13
13
16
2
2
9
29
35
33
27
30
46
55
Interest
11
15
33
51
41
35
10
2
16
14
16
24
10
Depreciation
6
8
17
35
36
36
37
38
49
53
56
59
60
Profit before tax
96
85
117
-17
56
99
228
311
256
-18
98
329
344
Tax %
30%
40%
44%
-64%
36%
28%
32%
37%
28%
-42%
30%
20%
Net Profit +
67
49
64
-28
36
71
155
196
185
-26
68
262
273
EPS in Rs
2.24
1.29
1.55
-0.99
1.66
3.18
5.81
7.26
6.85
-0.90
2.51
9.77
10.17
Here is the list of courses, that you can go through here
Following reputable Instagram accounts focused on the stock market can offer a range of benefits, especially if you’re interested in learning more about investing and trading. However, it’s important to choose accounts wisely and understand the limitations of information provided on social media platforms. Here’s why you might consider following such accounts:
In conclusion, learning about the stock market can be a transformative journey with the potential to positively impact your financial knowledge, decision-making, and future. Whether you’re interested in investing, trading, or simply gaining a deeper understanding of the financial world, the benefits are manifold
.
Understanding the stock market empowers you to make informed financial decisions, seize investment opportunities, and plan for your long-term goals. It’s an avenue to diversify your portfolio, manage risk, and build wealth over time. Additionally, knowledge of the stock market can be a valuable asset in various career paths, providing insights into economic trends and financial markets.
However, remember that the stock market is not without risks. It’s essential to approach your learning journey with a commitment to continuous education, critical thinking, and responsible decision
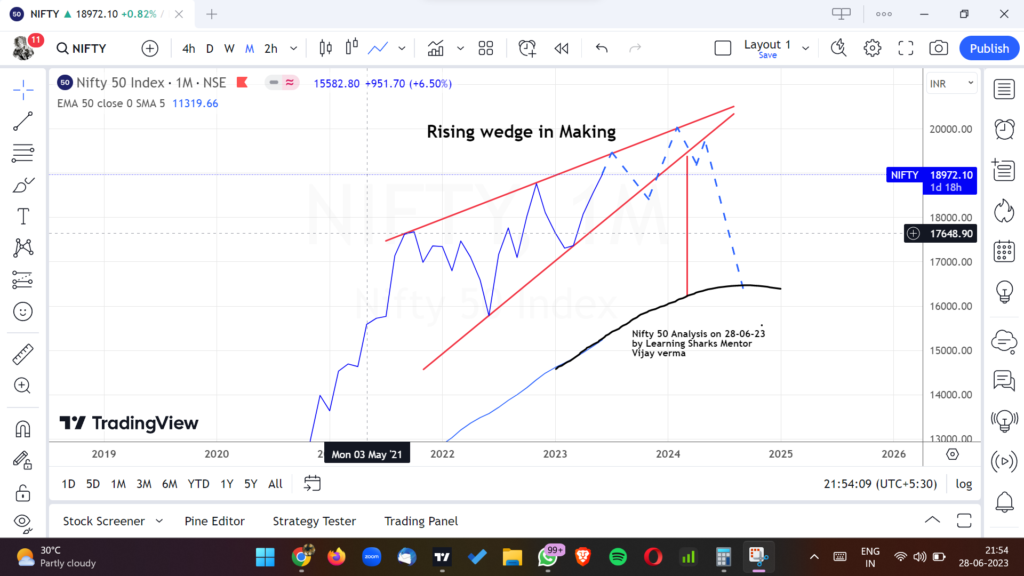
While our nation’s hero has touched the 19,000 mark for the first time, investors are happy and curious to know what’s next. What’s been in their minds has become a common question today. Will nifty go to 20,000? Well, Read more to know
First, let me congratulate all the investors for sticking by. Nifty 50, as we all know is an INDEX which showcases the typical retail, FII or DII mood. When it is trending up, demands are high and the economy is doing good. Vice versa, if it’s down, the economy isn’t doing so great.
While it has made a run to its new benchmark, is it going to stop here now? Short answer: No.
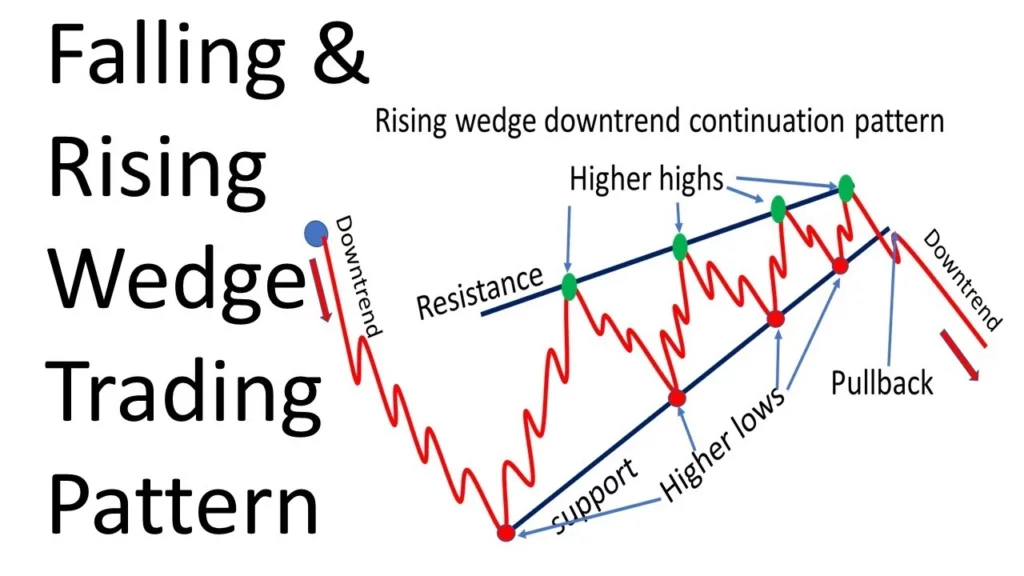
Al-though, corrections are healthy and necessary but will come to that in a second. NIFTY 50 and Sensex both have created an all-time high. Surprisingly, we have spotted a pattern in it. It’s called a rising wedge pattern ( in making).
What is the rising wedge pattern?
A rising wedge pattern is a technical chart pattern that frequently appears when the financial markets are on an uptrend. Two trendlines that converge towards one another, with the lower trendline being steeper than the higher trendline, are drawn to create it. Within the wedge formation, the price has a propensity to produce higher highs and higher lows.
Let’s just apply this to the Nifty 50 chart. Here’s what it looks like
It certainly looks like touching a further 20,000 benchmark. Before, giving us that most awaited fall that all PE or put holders waiting for. Our advice would be to play carefully, and not to be a victim of this euphoria.
Disclaimer: This is not financial advice or call. The analysis done above is merely for educational purposes. Please make your investment according to your own financial advisor. To know more about the pattern click here, Follow us on insta
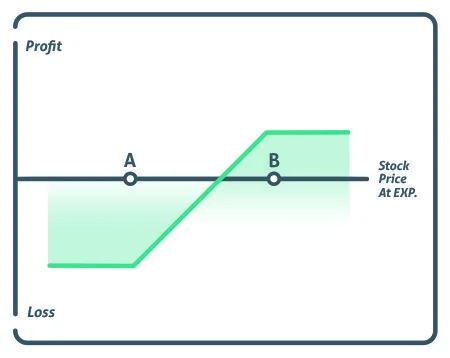
Investing methods known as options strategies use option contracts to meet specific investment objectives. Options are financial derivatives that grant the holder the right—but not the obligation—to buy or sell an underlying asset at a defined price within a predetermined window of time.
Here are a few typical option trading strategies:
Covered Call: With this technique, you sell a call option on an asset that you already hold the underlying. In addition to generating cash from the premium paid for selling the option, it offers some downside protection.
Buy a put option: on an underlying asset as part of the protective put strategy to hedge against potential downside risk. It functions as an insurance policy, preventing losses in the event that the asset’s price drops.
Long Call: By purchasing a call option, you have the right to purchase the underlying asset within a preset time frame at a set price (the strike price). When you believe the asset’s price will rise, you employ this tactic.
Long Put: With this technique, you purchase a put option that grants you the right to sell the underlying asset at a predetermined price within a predetermined window of time. When you anticipate a decline in the asset’s price, you use it.
Straddle: Buy both a call option and a put option with the same strike price and expiration date when you straddle. When you expect considerable price volatility but are unsure about the direction of the price movement, you utilise this method.
Strangle: A strangle is similar to a straddle in that it entails purchasing both calls and put options but with various strike prices. It is employed when substantial volatility is anticipated but with a preference for either an increase or decrease in the price of the underlying asset.
The butterfly spread is a limited-risk, limited-reward trading technique that combines long and short call (or put) options at various strike prices. When you anticipate that the price of the underlying asset will stay within a certain range, you employ it.
There are many more sophisticated choice techniques available; these are but a few examples. Each strategy has a unique risk-reward profile and is suitable for various market circumstances. Before adopting any options strategy, it’s critical to have a clear understanding of the dangers involved with options trading and to take into account speaking with a financial advisor or other expert.
Why option trading strategies fail
It’s critical to comprehend the potential risks and difficulties involved with trading options because there are a variety of reasons why options strategies can fail. The following are some typical causes of option failures:
Inaccurate Market Prediction: The success of option strategies frequently depends on the accuracy of the price forecast for the underlying asset. The technique could result in losses or have a limited possibility for profit if the market goes against expectations.
Time decay: Options contracts have a deadline after which all of their value has been lost (time decay). Time decay, commonly referred to as theta decay, causes options to lose value over time. If the price of the underlying asset does not move in the predicted direction within the given time frame, the method may experience losses due to time decay.
Inaccurate market forecasts: Options strategies frequently depend on forecasting the future course of underlying assets or the market as a whole. The technique might not succeed in producing the anticipated earnings if the projections prove to be inaccurate.
Ineffective risk management: When trading options, effective risk management is essential. Strategies that improperly control risk can result in large losses. This includes failing to place proper stop-loss orders, failing to diversify the portfolio, or committing an excessive amount of capital to a single deal.
Conclusion
Option strategies can be useful instruments for risk management, revenue generation, and capturing market opportunities, to sum up. They do, however, come with their own dangers and cannot be guaranteed to be profitable in all market conditions.
Before employing any option strategy, it is essential to have a firm grasp of options, risk management theories, and market dynamics.
Since its efficiency varies on variables like market conditions, underlying assets, risk tolerance, and personal investing goals, there is no one-size-fits-all “most working” option strategy. Different approaches have different goals, and different investors may find them to be more or less suitable.
Other pages to consider reading
“Option Volatility and Pricing: Advanced Trading Strategies and Techniques” by Sheldon Natenberg. Click here to find the version on Amazon.
Options as a Strategic Investment” by Lawrence G. McMillan. Find it here
Results for Class 10 from CBSE released: Girls outperform males with a pass percentage of 93.12
The CBSE released the Class 10 results on Friday, with 93.12% of students passing the test, a decrease of 1.28 percentage points from the previous year. In order to prevent “unhealthy competition,” the board has additionally stated that it will not disclose the merit list.
According to officials, the board has decided to stop awarding first, second, and third divisions based on pupils’ test results.
Girls once again outperformed boys, with a pass percentage of 94.25. The boys’ pass rate was 92.27 per cent.
For the sake of preventing unhealthy competition among the pupils, the CBSE will not release a merit list. However, the 0.1% of students who received the top scores across all disciplines will receive merit awards from the board, according to a senior board official.
CBSE Class 10 Result 2023: Gender-wise statistics
Girls – 94.25% Boys – 92.27% Transgender – 90.00%
PM Modi’s statement to 12th Graders in response to the 2023 CBSE Class 10th Results
“I would like to tell those bright youngsters who feel they could have done better in the Class XII exams – you have so much more to look forward to in the coming times. One set of exams doesn’t define you. Harness your talents in areas you are passionate about. You will shine!,” PM
tweeted.
HOW TO CHECK CBSE 10TH RESULT 2023
LIST OF OFFICIAL WEBSITES TO CHECK CBSE 10TH RESULT 2023
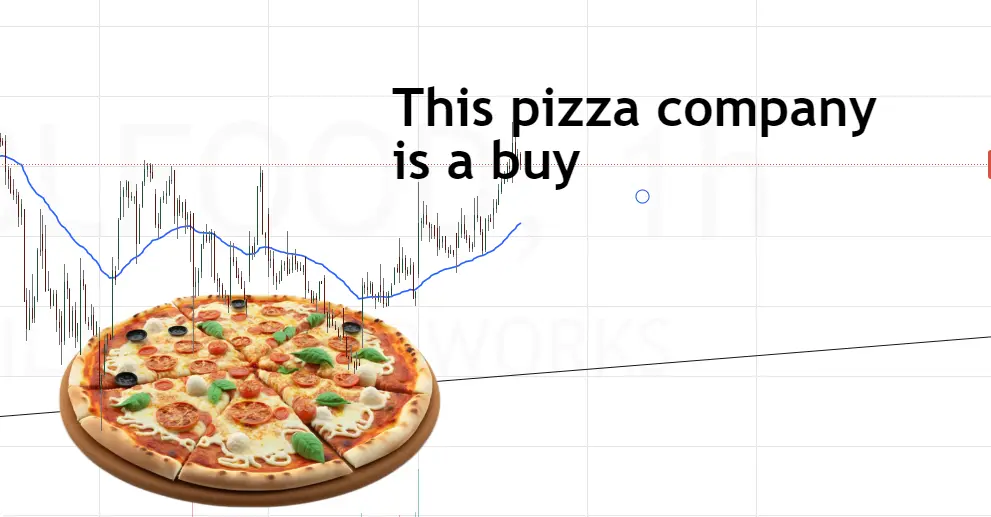
You all may have heard about this food company. Be it a festival or a break-up, Pizza always helps. Fortunately, When we talk about the pizza we have only a few companies to look at. Frankly, I’m more of a pasta fan Anyway.
Here, I was talking about DOMINOS. Yes, it is one of the favourite food companies. It is listed in the market as JUBILANT FOODWORKS. Jubilant Foodworks’ share price right now is Rs 449 a share as on 25-04-2023.
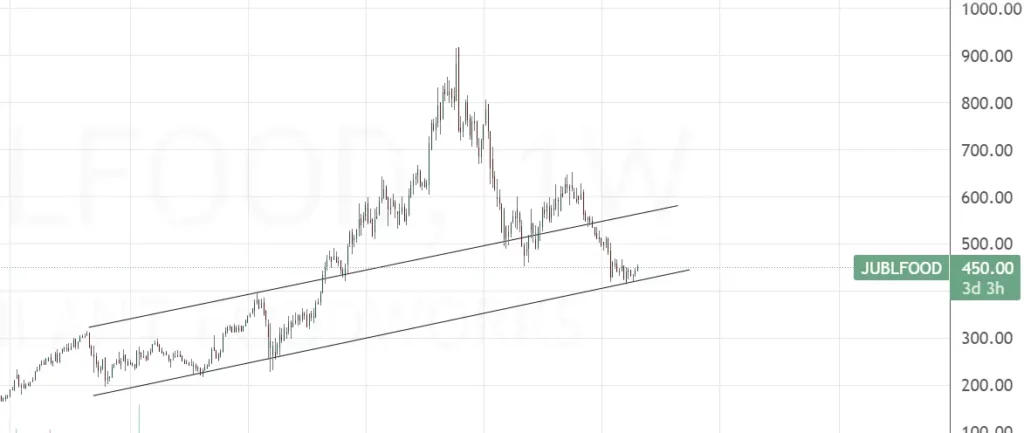
That’s why we think this stock can be added to the portfolio. Let’s look at the stock technically first. Along with many reasons to buy, this is one of the reasons.
It seems the stock is at the Support. Hence, out of many reasons, this course is a reason to buy. What is support? you ask
What is support?
In technical analysis, support and resistance are two fundamental ideas. Reading pricing charts correctly requires an understanding of both the meaning of these terms and how they are used in real-world situations.
Because of supply and demand, prices fluctuate. Prices increase when supply is insufficient to meet demand. Prices decrease as supply outpaces demand. When supply and demand are equal and prices are stable, prices will occasionally fluctuate sideways.
So, typically, support is the Demand zone. Traders and investors tend to buy or accumulate at this price.
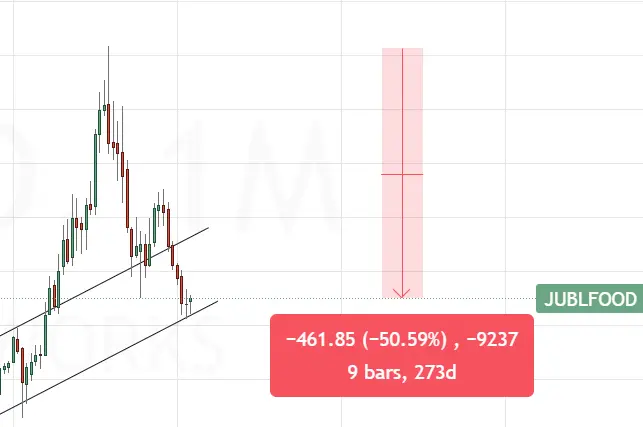
Furthermore, the stock is at its 50% discount from its ATH ( All time high). Thus, could be a good time to accumulate. Ahhh, Damn, i just want to eat a pizza now.
Let’s, look at the fundamentals of Jubilant Foodworks.
The balance sheet of Jubilant FoodWorks as on 25-4-23
Conclusion
Overall the company is a buying zone. However, this is not investment advice, this is merely for educational purposes. One should consult with your financial advisor.
To know more about the courses, check out our website. To know more about our crash course, check here.
Find here the Best Stock Market Books For Beginners-Share market books in Hindi, English and Marathi. On intraday, Technical analysis includes trade like a stock market wizard, a beginner’s guide to the stock market and you can be a stock market genius.
Below are the best stock market books for free download – PDF For beginners.
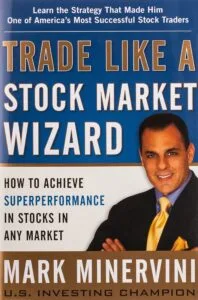
Title: Trade Like a Stock Market Wizard: How to Achieve Super Performance in Stocks in Any Market
Mark Minervini, a stock trader and investment genius who has won the US Investment Championship numerous times, wrote the book “Trade Like a Stock Market Wizard.” The book mostly guides his trading strategies and procedures, which he created during his successful career.
The book covers a wide range of topics, such as market analysis, finding high-potential stocks, risk management, and establishing a trading strategy. Minervini also shares his own experiences and cultural lessons, giving readers valuable insights into the world of stock trading.
2. You Can Be a Stock Market Genius Even if You’re Not Too Smart
Can you learn how to beat the stock market with a book? After all, billion-dollar portfolio managers can’t do it, and they assume no one can. Business academics not only believe it’s impossible, but they have plenty of facts to back it up. So, why should you invest in this book? Because Joel Greenblatt has been outperforming the stock market (with annual returns over 50%) for over ten years. And now he’s willing to teach you how to do it as well. In this funny and approachable book, you’ll discover the hidden locations of stock market gains.
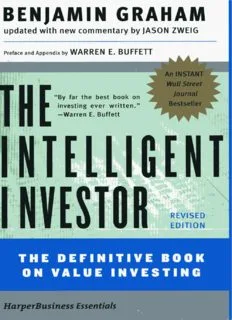
3. The Intelligent Investor – The Definitive Book on Value Investing
Publisher : Manjul Publishing House; First Edition (13 August 2021); Manjul Publishing House Pvt. Ltd., 2nd Floor, Usha Preet Complex, 42 Malviya Nagar, Bhopal – 462003 – India
Language : Hindi
बेंजामिन ग्राहम (1894-1976), वैल्यू इन्वेस्टिंग के जनक और आज के अनेक सफल व्यवसायियों की प्रेरणा हैं। वे सिक्योरिटी एनालिसिस और द इंटरप्रिटेशन ऑफ़ फ़ाइनेन्शियल स्टेटमेंट्स के लेखक भी हैं। जेसन ज़्वाइग मनी मैगज़ीन के वरिष्ठ लेखक तथा टाइम के अतिथि स्तंभकार, व म्यूज़ियम ऑफ़ अमेरिकन फ़ाइनेन्शियल हिस्ट्री के ट्रस्टी हैं। वे पूर्व में फ़ोर्ब्स के वरिष्ठ संपादक रहे हैं तथा 1987 से निवेश संबंधी लेखन कर रहे हैं।
4. Moving Averages 101: Incredible Signals That Will Make You Money in the Stock Market
Take advantage of our 20 years of trading knowledge. Reduce your odds of trading disaster by learning from someone who has been in the stock market for more than 20 years. Steve will explain moving averages and how to trade them.
Not sure where to begin? Do you have reservations about trading the 200-day moving average? Perhaps you don’t comprehend how to use moving averages in conjunction with other indicators. This book will help you understand trading better.
Understand moving averages This book will help you comprehend the power of moving averages.
Simple explanations of difficult subjects
Trading charts that are detailed and annotated
Gaining access to an active trading community
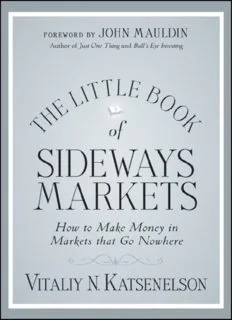
5. The Little Book of Sideways Markets: How to Make Money in Markets that Go Nowhere
Where does this leave your portfolio as the stock market becomes a roller-coaster ride of all-time highs and stomach-churning lows? You’re basically back where you started in 2000. This is good for Six Flags tourists, but for your retirement, savings, and investments, you’d like to get somewhere.
In The Little Book of Sideways Markets, respected value investor and author Vitaliy Katsenelson teaches you how to survive a market that is neither bull nor bear, but rather what he refers to as a cowardly lion—it exhibits brief bursts of confidence but is finally overpowered by fear.
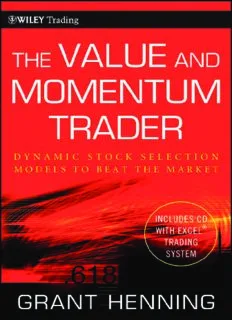
According to Grant Henning, stock market trading may be both highly profitable and severely harmful to your financial health. It is obvious that stock trading is not for everyone, and no one should jump into it without proper preparation. In a volatile stock market, winning stock trading strategies must be constantly refined and adjusted to changing market conditions.
Henning has taken the finest components of each investment technique, including momentum, value, growth, and fundamental and technical analysis, and fine-tuned a trading system based on Excel-based research methodologies he has devised that works in volatile markets. In The Value and Momentum Trader, he unveils his statistical trading strategies and demonstrates how to use them to make winning bets.
Are you ready to change your trading strategy? You may now utilise the Market Profile to enhance standard technical analysis approaches such as support and resistance, chart patterns, and trend lines, rather than relying on lagging and confused indicators placed on charts.
The Market Profile, created in the 1980s by financial specialists at the Chicago Board of Trade, has evolved into one of the most sophisticated analytical tools for traders, investors, and market analysts. AND NOW YOU CAN OWN THE POWER OF THE MARKET PROFILE.
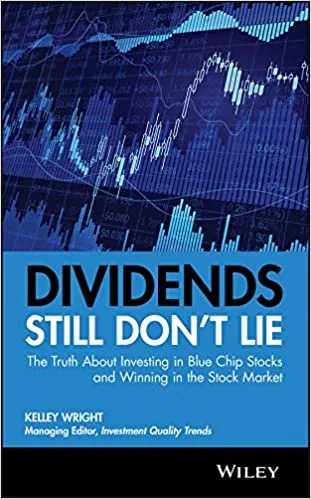
9. Dividends Still Don’t Lie: The Truth About Investing in Blue Chip Stocks and Winning in the Stock Market
Geraldine Weiss penned the classic Dividends Don’t Lie in 1988. That book described the dividend-value philosophy behind Investment Quality Trends, the highly successful newsletter started by Weiss and now edited by Kelley Wright. More than two decades later, the financial world has altered tremendously due to advances in computer technology and the Internet. Massive volumes of data and information may now be acquired, processed, and analysed in minutes.
What used to take weeks or months in a library can now be completed in one evening with a computer. What hasn’t changed is the dividend-value strategy’s track record of creating regular gains in the stock market. Dividends Still Don’t Lie demonstrates how the stock market continues to reward investors who recognise and value good value.
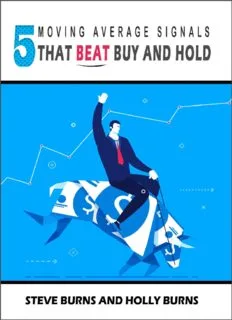
10. 5 Moving Average Signals That Beat Buy and Hold
Learn about five winning and time-tested trading techniques that outperform buy-and-hold investments. Steve walks you through the results of 16 years of backtesting on some of the most prominent moving average signals, so you can understand when to enter when to exit, and how to use backtesting to your benefit!
Conclusion
The stock market is not limited to books or theoretical knowledge. Although these new and old books are amazing to learn new topics. we’d still suggest you to learn practically. Here, are the list of courses, we offer.
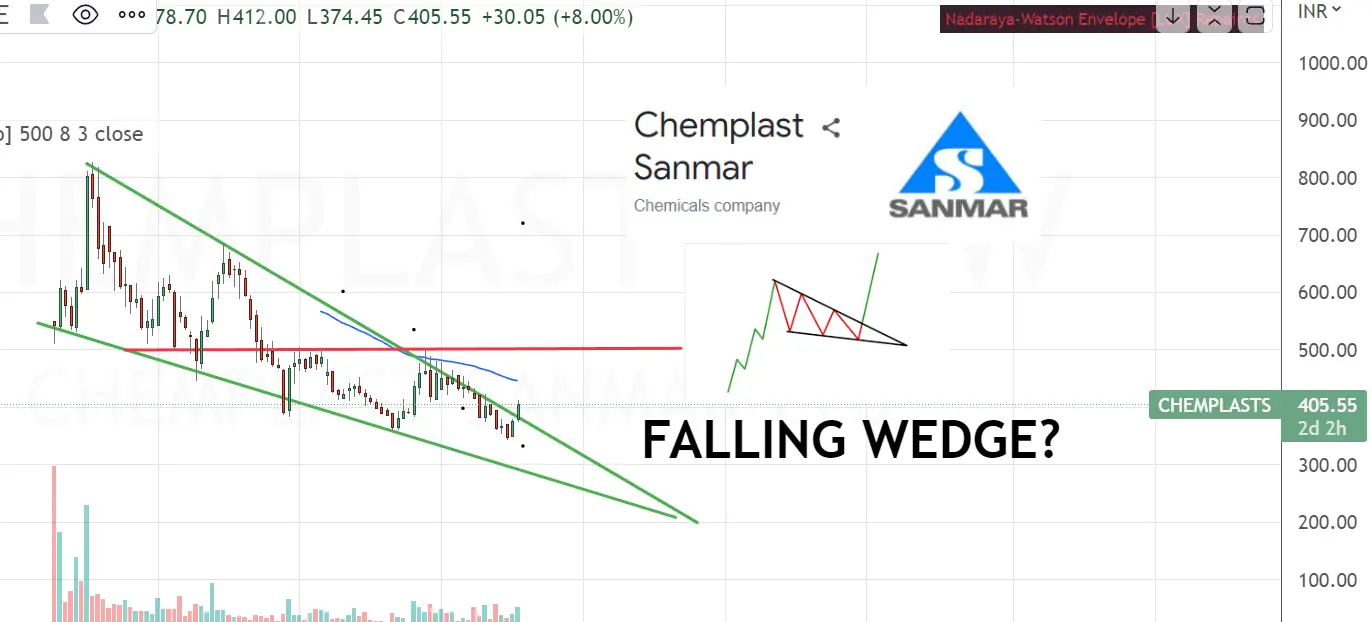
When the market makes lower lows and lower highs with a contracting range, a chart pattern arises. It suggests a possible reversal in the trend in the upward direction. That is called a Falling wedge pattern.
What are Technical Analysis Chart patterns?
A chart pattern is a shape within a price chart that helps to predict what prices will do next based on prior performance. Chart patterns are the foundation of technical analysis and necessitate a trader’s understanding of both what they are looking at and what they are looking for.
If you wanna learn about all the chart patterns for free, click here
Chemplast Sanmar Limited is a chemical firm based in India.[1] It is a leading producer of PVC resins, chlorochemicals, and pipe systems.
We recommend this stock at CMP 405, for multiple reasons. The stock has been taking a beating since its IPO listing. Fortunately, the company has been making only a profit, and it’s considered a bright addition to your portfolio.
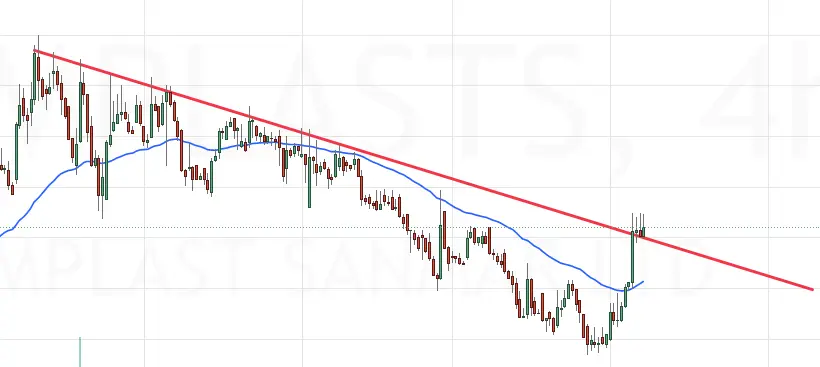
If you know about support and resistance; you will learn, the stock is on its resistance after multiple attempts of Breaking out.
Stock Breaking out of its resistance in the chart above.
Now that you have seen it on the chart along side the Falling wedge pattern. Let’s look at the fundamental side of the Chemplasts Sanmar.
Profit & Loss
Consolidated Figures in Rs. Crores / View StandalonePRODUCT SEGMENTS
Mar 2019
Mar 2020
Mar 2021
Mar 2022
TTM
Sales +
1,254
1,258
3,799
5,892
5,601
Expenses +
969
1,011
3,171
4,695
4,884
Operating Profit
286
247
628
1,197
717
OPM %
23%
20%
17%
20%
13%
Other Income +
12
8
484
57
-23
Interest
48
95
433
322
151
Depreciation
56
87
131
137
149
Profit before tax
193
72
547
796
395
Tax %
39%
36%
25%
18%
Net Profit
118
46
410
649
338
EPS in Rs
14.81
6.88
30.59
41.03
21.38
Dividend Payout %
0%
0%
0%
0%
Compounded Sales Growth
10 Years:
%
5 Years:
%
3 Years:
67%
TTM:
3%
Compounded Profit Growth
10 Years:
%
5 Years:
%
3 Years:
75%
TTM:
-50%
Stock Price CAGR
10 Years:
%
5 Years:
%
3 Years:
%
1 Year:
-35%
Return on Equity
10 Years:
%
5 Years:
%
3 Years:
12%
Last Year:
50%
P&l of Chemplasts sanmar
Balance Sheet
Consolidated Figures in Rs. Crores / View StandaloneCORPORATE ACTIONS
Mar 2019
Mar 2020
Mar 2021
Mar 2022
Sep 2022
Share Capital +
67
1,274
1,251
79
79
Reserves
2,433
1,845
-417
1,626
1,705
Borrowings +
253
82
943
882
925
Other Liabilities +
1,049
2,113
3,893
3,014
3,101
Total Liabilities
3,802
4,108
4,487
5,601
5,810
Fixed Assets +
2,108
2,174
3,148
3,259
3,211
CWIP
117
8
25
34
73
Investments
1,159
1,458
0
0
0
Other Assets +
418
467
1,313
2,308
2,525
Total Assets
3,802
4,108
4,487
5,601
5,810
The balance sheet of Chemplasts sanmar
Conclusion
Now that you have seen the fundamentals and the technicals of this stock. You would see the price CMP 405 is a good price to add on. However, as a Disclaimer, we suggest you do your complete analysis before adding this stock. This is not buying financial advice, but instead merely for education purposes.
If you are new to this page, Don’t forget to check out our courses page.