Fertilizers companies Coromandel Inter, FACT, Chambal Fertilizers, RCF, GSFC, Paradeep phosphates and National Fertilizer are all making a run this season. Should you add them to your portfolio? let’s find them out
On Thursday, 13 Apr, 23 Fertilizers & Chemicals Travancore Ltd was up ₹ 321 12.40% National Fertilizer Ltd was down ₹ 85.3 -0.87%, Coromandel International Ltd ₹ 927 -0.05% respectively.
Let’s look at companies Technicals one by one to find out which one to invest in
National Fertilizer Ltd
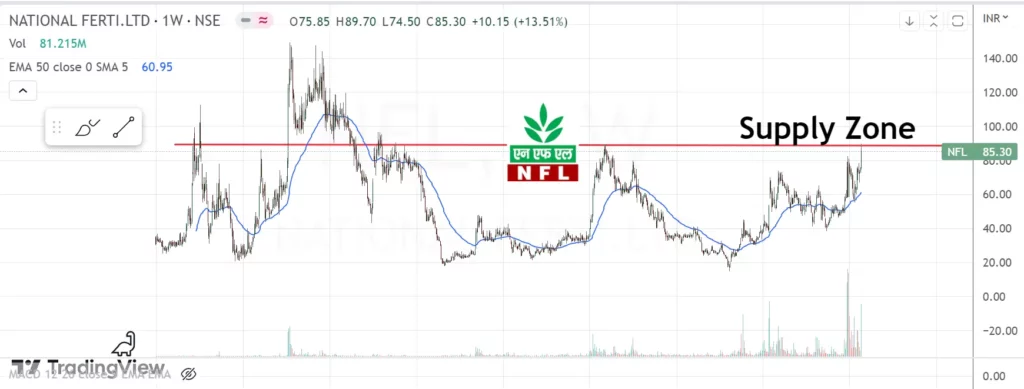
While the company has not been profitable all this while. However, The company has posted profits of 700 cr for 2022 as compared to a -95CR loss Last year. As per the price point, one should avoid making new positions.
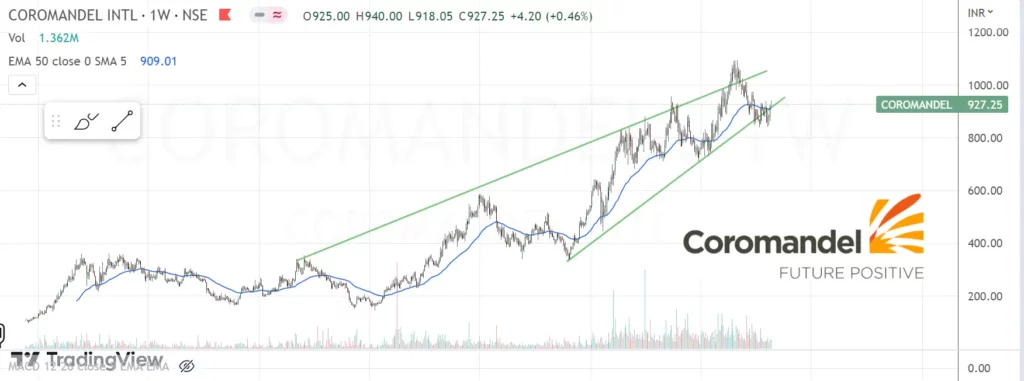
Coromandel International Ltd
| Net Profit | 26 | 197 | 208 | 213 | 294 | -181 | 237 | -95 | 700 |
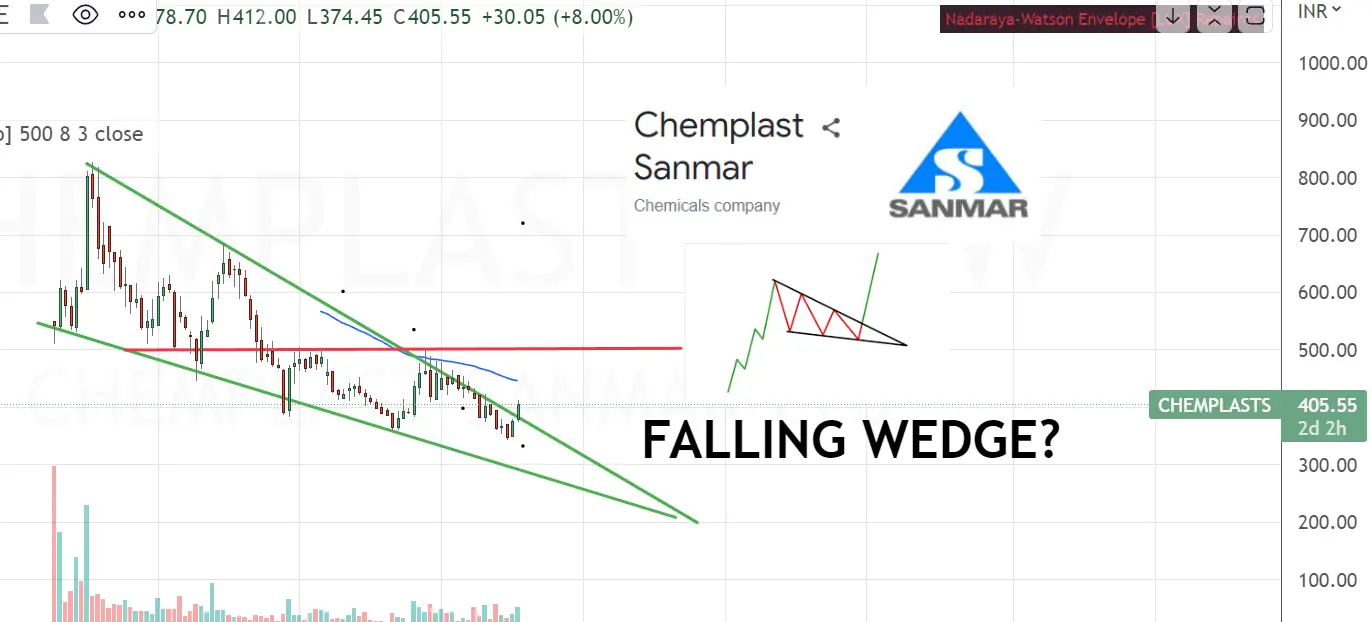
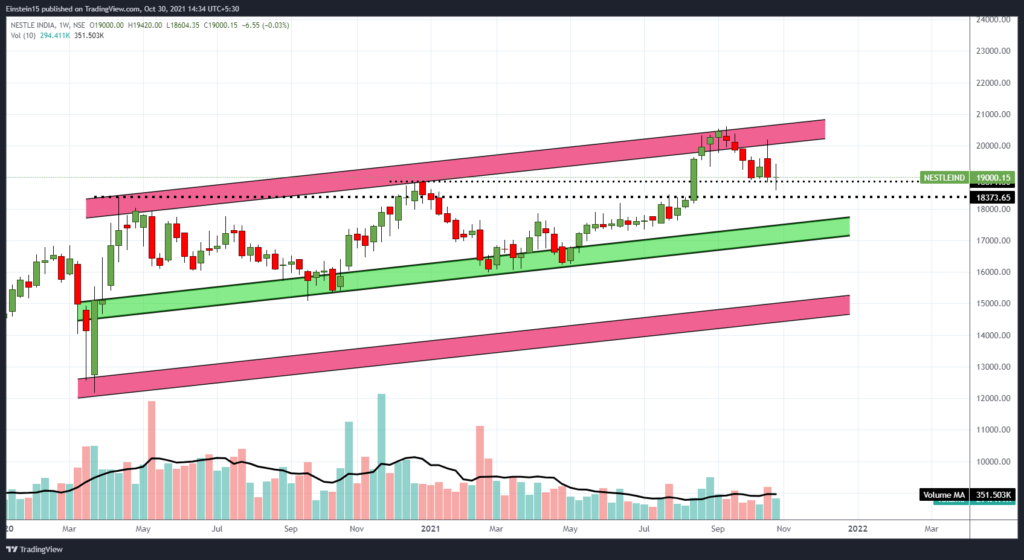
Coromandel seems to be making a fine entry at CMP 927 however, considering the stock could be making a BEARISH Rising wedge pattern. Hence, it is not advised to make an entry in this stock.
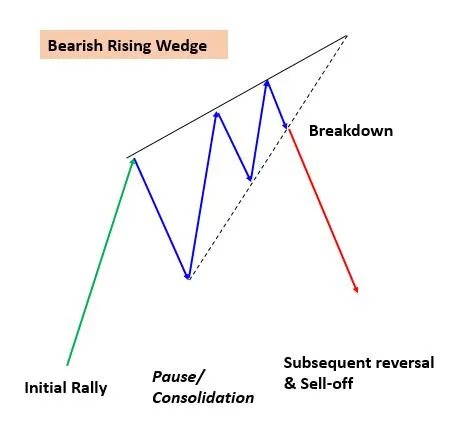
What is a rising wedge?
A technical signal known as a rising wedge suggests a reversal pattern typically observed in bad markets. This pattern appears on charts when the price rises and the pivot highs and lows converge towards the apex, which is a single point.
Fertilizers & Chemicals Travancore Ltd
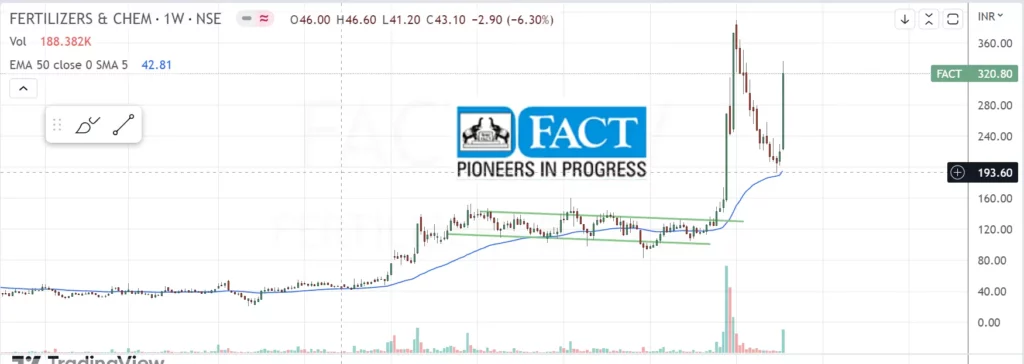
FACT seems to have taken the best of all already, Stock price currently trading at Rs320 a Piece. Already 64% up from its last low of Rs 193. It is not advised to make new positions in this stock.
The company has made over Rs 681Cr profit this year compared to 353cr Profit last year.
Chambal Fertilisers & Chemicals Ltd
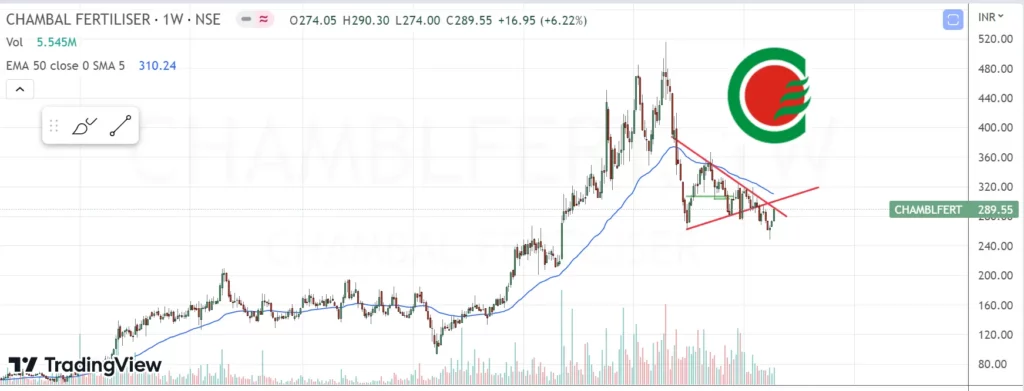
The only company that seems to have the advantage of being added to the portfolio. Chambal fertilisers posted a profit of 1,184CR this year compared to 1566CR last year which seems to be a fall yet profitable still.
The price of Chambal Fert is Rs 289 and it can be a good buy still in the portfolio with targets of up to Rs 312.
Rashtriya Chemicals & Fertilizers Ltd
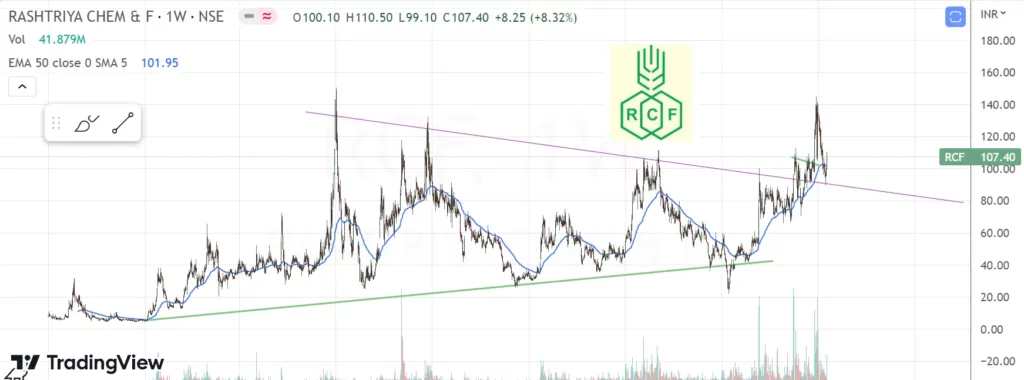
RCF has posted 1,041CR profit as compared to 702CR from the last year. Furthermore, the stock seems to be in the category of a buy zone. As can be seen in the start. RCF is making a symmetrical triangle pattern. To know more about this pattern, click here
Gujarat State Fertilizers & Chemicals Ltd
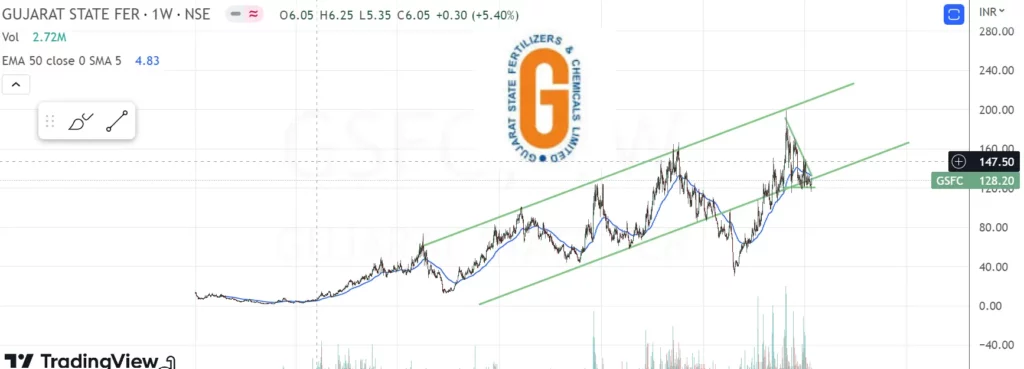
The company has posted a whooping profit of 1,345CR which was 891CR last year. Also, Stock seem to be on the support in a channel pattern. This can also be a decent addition in your portfolio.
Paradeep Phosphates Ltd
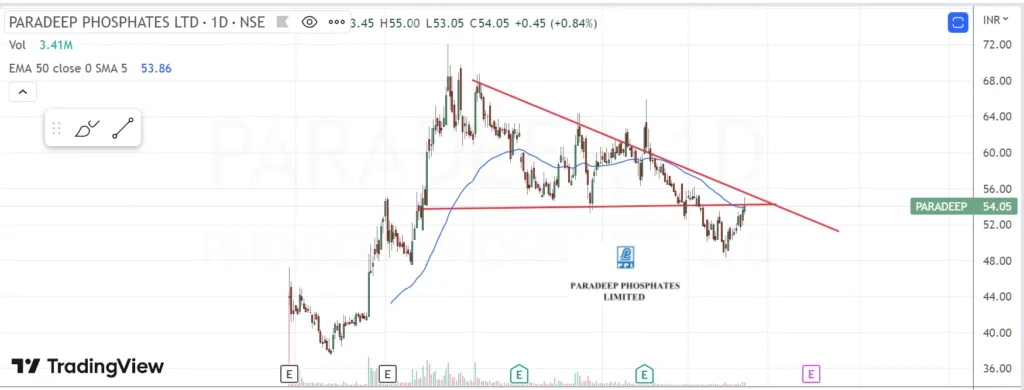
With only ₹ 4,402 Cr Market cap, Paradeep phosphates CMP 54 posted 330CR profit this year. Last year, PP gained 398CR which seems to be a decent fall. Considering the DII holds 20.73% of the company. we recommend this to be a decent accumulation.
Please note: Paradeep phosphates are making a descending triangle, which indicates a possible downfall. Or it has been done already, as you can see in the stock price,
Conclusion
While the sector/industry seems to be getting a lot of FII and DII attention. There are fewer stocks only which can be added to the portfolio at this time. We recommend you do your complete analysis of them before adding them. To stay updated follow us on Instagram.
This learning sharks article is of a general nature. Our articles are not meant to be investment advise; instead, we only offer analysis based on objective methods, past information, and projections from analysts. It doesn’t represent an advice to buy or sell any stock, and it doesn’t take into consideration your goals or financial position. We hope to provide you with long-term analysis that is driven by essential facts. Be aware that recent price-conscious announcements from businesses or high-quality information may not be taken into account in our analysis.
#stockmarket #sharemarket