Learning sharks-Share Market Institute

To know more about the Stock Market Courses Call Rajouri Garden 8595071711  or Noida 8920210950

Is Delta Corp a Buy? Gaming and Casino Stock🎮

Share market today

Do you play PUBG? or are you into the gaming industry? Don’t worry, It doesn’t matter if you play or not. However, learning more about technical and fundamental analysis is important if you want to earn in the stock Market. Let’s analyse Delta Corp NSE: 142.25 apiece.

Delta Corp has been in the news for its recent 28% imposed GST on its business. Since then the stock price fell from Rs 242 to 142 Today. Maybe it is time to take a look at this.

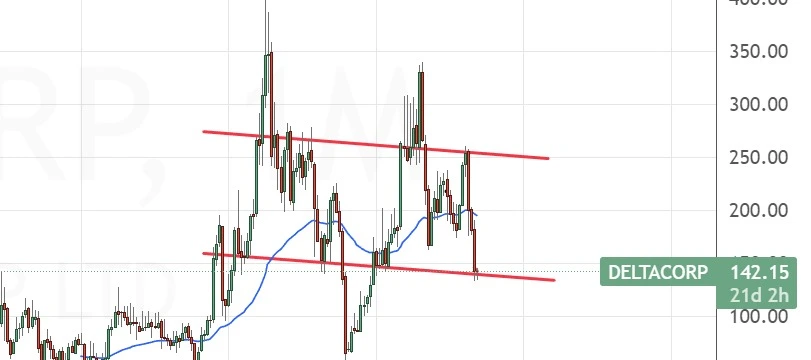
Considerably, the stock seems to be on its support right now, so we could see an upside from here. Few new positions can be made during this time as the company is doing well fundamentally.

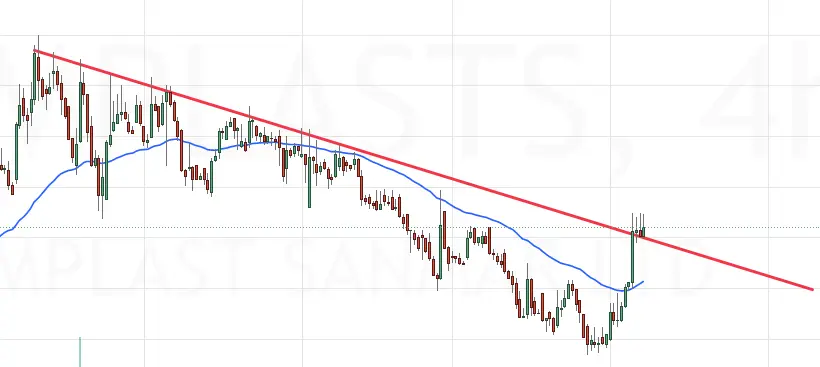
If you know a bit about breakout trading, or support and resistance,. You will find this stock trying to break its resistance in a smaller time frame.

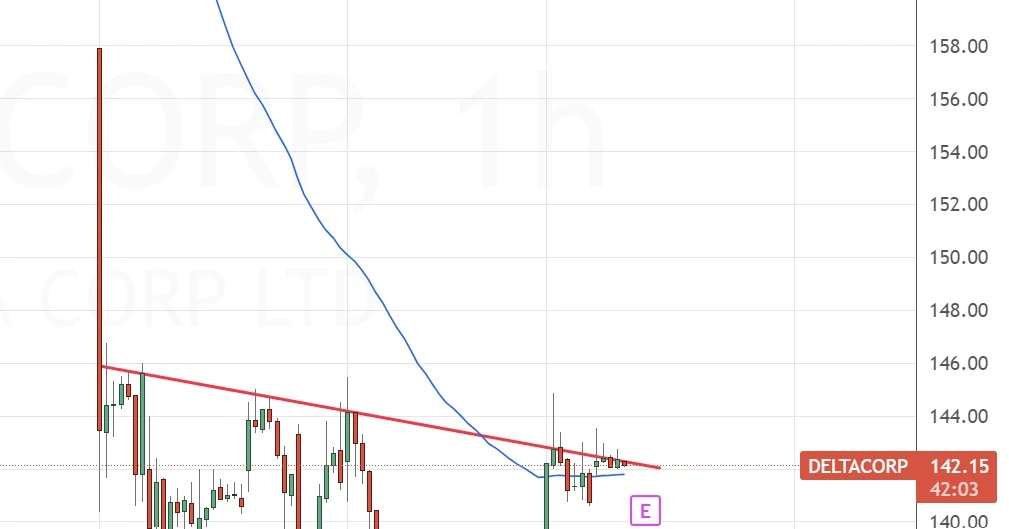
As the stock is getting close to its resistance, It could break. Again, this is just for the educational purposes. If you wanna trade in a stock, you need to learn proper ways to make money.

Let’s look at the fundamentals of the Delta Corp

Profit & Loss

Consolidated Figures in Rs. Crores / View StandalonePRODUCT SEGMENTS

Mar 2012Mar 2013Mar 2014Mar 2015Mar 2016Mar 2017Mar 2018Mar 2019Mar 2020Mar 2021Mar 2022Mar 2023TTM
Sales +3654255593003754556087987734196161,0211,043
Expenses +264330408233244293360482486397477654685
Operating Profit101951516713116124731528822139366359
OPM %28%22%27%22%35%36%41%40%37%5%23%36%34%
Other Income +13131622929353327304655
Interest1115335141351021614162410
Depreciation681735363637384953565960
Profit before tax9685117-175699228311256-1898329344
Tax %30%40%44%-64%36%28%32%37%28%-42%30%20%
Net Profit +674964-283671155196185-2668262273
EPS in Rs2.241.291.55-0.991.663.185.817.266.85-0.902.519.7710.17

Here is the list of courses, that you can go through here

#stockmarket #sharemarket #deltacorp

NIFTY 50 ANALYSIS! TOUCHED 19000, WHAT’S NEXT

While our nation’s hero has touched the 19,000 mark for the first time, investors are happy and curious to know what’s next. What’s been in their minds has become a common question today. Will nifty go to 20,000? Well, Read more to know

First, let me congratulate all the investors for sticking by. Nifty 50, as we all know is an INDEX which showcases the typical retail, FII or DII mood. When it is trending up, demands are high and the economy is doing good. Vice versa, if it’s down, the economy isn’t doing so great.

While it has made a run to its new benchmark, is it going to stop here now? Short answer: No.

Al-though, corrections are healthy and necessary but will come to that in a second. NIFTY 50 and Sensex both have created an all-time high. Surprisingly, we have spotted a pattern in it. It’s called a rising wedge pattern ( in making).

What is the rising wedge pattern?

A rising wedge pattern is a technical chart pattern that frequently appears when the financial markets are on an uptrend. Two trendlines that converge towards one another, with the lower trendline being steeper than the higher trendline, are drawn to create it. Within the wedge formation, the price has a propensity to produce higher highs and higher lows.

Let’s just apply this to the Nifty 50 chart. Here’s what it looks like

It certainly looks like touching a further 20,000 benchmark. Before, giving us that most awaited fall that all PE or put holders waiting for. Our advice would be to play carefully, and not to be a victim of this euphoria.

Disclaimer: This is not financial advice or call. The analysis done above is merely for educational purposes. Please make your investment according to your own financial advisor. To know more about the pattern click here, Follow us on insta

What are the options? why they fail and options strategies explained

Investing methods known as options strategies use option contracts to meet specific investment objectives. Options are financial derivatives that grant the holder the right—but not the obligation—to buy or sell an underlying asset at a defined price within a predetermined window of time.

Here are a few typical option trading strategies:

  • Covered Call: With this technique, you sell a call option on an asset that you already hold the underlying. In addition to generating cash from the premium paid for selling the option, it offers some downside protection.
  • Buy a put option: on an underlying asset as part of the protective put strategy to hedge against potential downside risk. It functions as an insurance policy, preventing losses in the event that the asset’s price drops.
  • Long Call: By purchasing a call option, you have the right to purchase the underlying asset within a preset time frame at a set price (the strike price). When you believe the asset’s price will rise, you employ this tactic.
  • Long Put: With this technique, you purchase a put option that grants you the right to sell the underlying asset at a predetermined price within a predetermined window of time. When you anticipate a decline in the asset’s price, you use it.
  • Straddle: Buy both a call option and a put option with the same strike price and expiration date when you straddle. When you expect considerable price volatility but are unsure about the direction of the price movement, you utilise this method.
  • Strangle: A strangle is similar to a straddle in that it entails purchasing both calls and put options but with various strike prices. It is employed when substantial volatility is anticipated but with a preference for either an increase or decrease in the price of the underlying asset.
  • The butterfly spread is a limited-risk, limited-reward trading technique that combines long and short call (or put) options at various strike prices. When you anticipate that the price of the underlying asset will stay within a certain range, you employ it.

There are many more sophisticated choice techniques available; these are but a few examples. Each strategy has a unique risk-reward profile and is suitable for various market circumstances. Before adopting any options strategy, it’s critical to have a clear understanding of the dangers involved with options trading and to take into account speaking with a financial advisor or other expert.

Why option trading strategies fail

It’s critical to comprehend the potential risks and difficulties involved with trading options because there are a variety of reasons why options strategies can fail. The following are some typical causes of option failures:

  • Inaccurate Market Prediction: The success of option strategies frequently depends on the accuracy of the price forecast for the underlying asset. The technique could result in losses or have a limited possibility for profit if the market goes against expectations.
  • Time decay: Options contracts have a deadline after which all of their value has been lost (time decay). Time decay, commonly referred to as theta decay, causes options to lose value over time. If the price of the underlying asset does not move in the predicted direction within the given time frame, the method may experience losses due to time decay.
  • Inaccurate market forecasts: Options strategies frequently depend on forecasting the future course of underlying assets or the market as a whole. The technique might not succeed in producing the anticipated earnings if the projections prove to be inaccurate.
  • Ineffective risk management: When trading options, effective risk management is essential. Strategies that improperly control risk can result in large losses. This includes failing to place proper stop-loss orders, failing to diversify the portfolio, or committing an excessive amount of capital to a single deal.

Conclusion

Option strategies can be useful instruments for risk management, revenue generation, and capturing market opportunities, to sum up. They do, however, come with their own dangers and cannot be guaranteed to be profitable in all market conditions.

Before employing any option strategy, it is essential to have a firm grasp of options, risk management theories, and market dynamics.

Since its efficiency varies on variables like market conditions, underlying assets, risk tolerance, and personal investing goals, there is no one-size-fits-all “most working” option strategy. Different approaches have different goals, and different investors may find them to be more or less suitable.

Other pages to consider reading

  1. “Option Volatility and Pricing: Advanced Trading Strategies and Techniques” by Sheldon Natenberg. Click here to find the version on Amazon.
  2. Options as a Strategic Investment” by Lawrence G. McMillan. Find it here
  3. Investopedia (www.investopedia.com)
  4. OptionsPlay (www.optionsplay.com)

#OptionsTrading #StockOptions #OptionStrategies #OptionsEducation #OptionsMarket #OptionsInvesting #OptionsTrader #OptionsIncom #VolatilityTrading #Derivatives

A Chemical Company which can make your portfolio shine

Falling wedge pattern

What is a Falling wedge pattern?

When the market makes lower lows and lower highs with a contracting range, a chart pattern arises. It suggests a possible reversal in the trend in the upward direction. That is called a Falling wedge pattern.

What are Technical Analysis Chart patterns?

A chart pattern is a shape within a price chart that helps to predict what prices will do next based on prior performance. Chart patterns are the foundation of technical analysis and necessitate a trader’s understanding of both what they are looking at and what they are looking for.

If you wanna learn about all the chart patterns for free, click here

Chemplast Sanmar Limited is a chemical firm based in India.[1] It is a leading producer of PVC resins, chlorochemicals, and pipe systems.

We recommend this stock at CMP 405, for multiple reasons. The stock has been taking a beating since its IPO listing. Fortunately, the company has been making only a profit, and it’s considered a bright addition to your portfolio.

If you know about support and resistance; you will learn, the stock is on its resistance after multiple attempts of Breaking out.

Stock Breaking out of its resistance in the chart above.

Now that you have seen it on the chart along side the Falling wedge pattern. Let’s look at the fundamental side of the Chemplasts Sanmar.

Profit & Loss

Consolidated Figures in Rs. Crores / View StandalonePRODUCT SEGMENTS

Mar 2019Mar 2020Mar 2021Mar 2022TTM
Sales +1,2541,2583,7995,8925,601
Expenses +9691,0113,1714,6954,884
Operating Profit2862476281,197717
OPM %23%20%17%20%13%
Other Income +12848457-23
Interest4895433322151
Depreciation5687131137149
Profit before tax19372547796395
Tax %39%36%25%18%
Net Profit11846410649338
EPS in Rs14.816.8830.5941.0321.38
Dividend Payout %0%0%0%0%
Compounded Sales Growth
10 Years:%
5 Years:%
3 Years:67%
TTM:3%
Compounded Profit Growth
10 Years:%
5 Years:%
3 Years:75%
TTM:-50%
Stock Price CAGR
10 Years:%
5 Years:%
3 Years:%
1 Year:-35%
Return on Equity
10 Years:%
5 Years:%
3 Years:12%
Last Year:50%
P&l of Chemplasts sanmar

Balance Sheet

Consolidated Figures in Rs. Crores / View StandaloneCORPORATE ACTIONS

Mar 2019Mar 2020Mar 2021Mar 2022Sep 2022
Share Capital +671,2741,2517979
Reserves2,4331,845-4171,6261,705
Borrowings +25382943882925
Other Liabilities +1,0492,1133,8933,0143,101
Total Liabilities3,8024,1084,4875,6015,810
Fixed Assets +2,1082,1743,1483,2593,211
CWIP1178253473
Investments1,1591,458000
Other Assets +4184671,3132,3082,525
Total Assets3,8024,1084,4875,6015,810
The balance sheet of Chemplasts sanmar

Conclusion

Now that you have seen the fundamentals and the technicals of this stock. You would see the price CMP 405 is a good price to add on. However, as a Disclaimer, we suggest you do your complete analysis before adding this stock. This is not buying financial advice, but instead merely for education purposes.

If you are new to this page, Don’t forget to check out our courses page.

To contact us, use this link.

#stockmarket #learningsharks #chemplastsanmar #fallingwedge #chartpatterns

Mental Health of Stock Market Traders- Trader’s health special

Trading stocks is a dynamic and unique career in and of itself. However, due to easy entry to the market and the potential for huge profits quickly, non-professional people enter the activity. The number of De-mat accounts created at various countries’ central depository systems indicates that the number of traders and investors joining the capital markets has reached historic highs. Most of them lose some or all of their money due to their unquenchable avarice before giving up or going back to learning the fundamentals. Even cautious buyers occasionally engage in trading, which depletes their wealth.

Life Style of a Trader

The prevalence of sleep disorders has increased as a result of contemporary socioeconomic and lifestyle variables. There needs to be advocacy for proper sleep hygiene, amount, and quality.
The week on the Indian stock exchanges runs from Monday to Friday. Trading is permitted on the equity exchange from 9:00 AM to 3:30 PM.

The commodity market, however, is available from 10 AM to 11:30 PM. Occasionally, suggestions to advance market timings were made. SEBI published a discussion document outlining the advantages of extending market hours. (SEBI, 2018). The ideas were mostly abandoned, though, for operational reasons.

Participants in the financial markets have lost two hours of slumber per day over the past century. Following a weekend of daylight saving time, the markets have experienced sharp declines that are ascribed to sleep asynchronies.

Stress in Life of a Trader

Griffith, Najand, and Shen (2019) investigated small investor mood measurement in the dimensions of fear, gloom, joy, and stress to forecast market returns and market volatility. Fear significantly and persistently affects market results. Stress has a one-day lag and is observed to have a relatively smaller effect on returns.

Joy and happiness have no bearing on forecasting returns. According to studies, optimistic investors who are joyful are more likely to anticipate positive market gains. The stressful nature of stock market trading often makes the trader’s worst adversary the merchant. The trader has an advantage if they are conscious of stress level measurement technology like Ambient Intelligence.

Mental Health of a Trader

Well-documented, violent stock market shocks and crashes are discussed in research groups. Examining the connections between behavioral agreement, correlation to stock market returns, and market volatility reveals a phase transition between the indicators.
Significant coupling strength causes a rise in all three variables.


Trading participants ignore their random factors and adhere to the market trend when coupling strength is equivalent to one. A lot of studies have been done on the effects of events on stock markets, including how they affect liquidity and volatility. Economic and Financial.


stress can potentially lead to human capital loss in the form of suicide or murder-suicide. Financial trading is a job that requires careful risk management. Dynamic and unpredictable markets frequently cause trades to skip the risk management step, which can result in financial loss and, in the worst instances, suicide. Mental health studies have found a close relationship between trading risk, financial debt, and stock market failure.

For some experienced traders, trading stocks is a type of self-employment. In general, self-employment increases job and life satisfaction but may also raise mental health issues, despite the fact that the self-employed do not see it as mentally challenging.

If you liked this article, do visit our Instagram page to follow more of such content.

FOR COURSES RELATED INFORMATION, CLICK HERE

AARTIIND SHARE PRICE ANALYSIS – Can you buy this Chemical company?

In advanced economies, Aarti industries saw better-than-expected demand trends in the chemical sector. Reduced raw material sourcing risk strengthens the investment case. The company’s reported stable margins are reassuring. As a result, long-term investors should accumulate the stock in stages. #stockmarket #buyingstocks #investment 

TECHNICAL ANALYSIS OF AARTI INDUSTRIES BY SURYAANSH

Lets look at the fundamentals of the stock .

Profit & Loss

Consolidated Figures in Rs. Crores / View StandalonePRODUCT SEGMENTS

Mar 2011Mar 2012Mar 2013Mar 2014Mar 2015Mar 2016Mar 2017Mar 2018Mar 2019Mar 2020Mar 2021Mar 2022TTM
Sales +1,4491,6672,0862,6192,8903,0063,1633,8064,1684,1864,5067,0006,719
Expenses +1,2511,4171,7252,2172,4242,4342,5093,1063,2023,2093,5255,0715,542
Operating Profit1982493614024665726547009659779821,9291,176
OPM %14%15%17%15%16%19%21%18%23%23%22%28%18%
Other Income +44411962729111
Interest56729511813811711713218312586114166
Depreciation505583898298123146163185231289304
Profit before tax961261872062553634164296226766651,527707
Tax %30%29%29%26%24%26%21%19%19%19%19%14%
Net Profit821041351632082683283465045475351,307590
EPS in Rs2.663.264.254.585.817.719.6210.2414.1815.3915.0236.0616.28
Dividend Payout %24%27%24%25%24%28%3%2%19%11%10%10%
Compounded Sales Growth
10 Years:15%
5 Years:17%
3 Years:19%
TTM:15%
Compounded Profit Growth
10 Years:29%
5 Years:33%
3 Years:39%
TTM:-50%
Stock Price CAGR
10 Years:40%
5 Years:16%
3 Years:16%
1 Year:-41%
Return on Equity
10 Years:22%
5 Years:22%
3 Years:22%
Last Year:28%
Profit and loss of aarti Industries 2023

Balance Sheet

Consolidated Figures in Rs. Crores / View StandaloneCORPORATE ACTIONS

Mar 2011Mar 2012Mar 2013Mar 2014Mar 2015Mar 2016Mar 2017Mar 2018Mar 2019Mar 2020Mar 2021Mar 2022Sep 2022
Share Capital +3840404444424141438787181181
Reserves4675517178269721,0961,3211,5382,5872,8923,4165,7334,507
Borrowings +5286288491,0391,2021,2921,5642,0832,4012,0982,8572,5942,767
Other Liabilities +3614425717607195385737308261,2561,2821,1641,185
Total Liabilities1,3951,6602,1762,6702,9382,9663,4994,3915,8586,3327,6429,6738,641
Fixed Assets +4124436748269671,2461,6971,9982,1472,4683,5934,4183,981
CWIP1854691171933132704367951,4181,2981,4901,392
Investments7694951171394147473337647328
Other Assets +8881,0681,3381,6091,6391,3661,4861,9102,8842,4092,6883,6913,240
Total Assets1,3951,6602,1762,6702,9382,9663,4994,3915,8586,3327,6429,6738,641
Balance sheet of Aarti Industries 2023

Join our Stock Market WhatsApp group

Investment, Trading, Financial updates, Stock trading tips

The Ultimate Guide to Joining a Stock Market WhatsApp Group

As the world becomes more interconnected, investors are seeking new and innovative ways to stay up to date on the latest stock market trends. One of the most popular methods is through joining a Stock Market WhatsApp group. These groups offer a wealth of information, tips, and insights from experienced traders and investors. If you’re interested in learning more about the stock market and increasing your knowledge, then joining a Stock Market WhatsApp group may be just what you need.

What is a Stock Market WhatsApp Group?

A Stock Market WhatsApp group is a community of individuals who share information and insights about the stock market. Members of the group can share news, analysis, and tips on specific stocks or market trends. These groups provide a platform for members to communicate and exchange ideas in real-time.

Benefits of Joining a Stock Market WhatsApp Group

Joining a Stock Market WhatsApp group can offer a number of benefits to investors, including:

Access to Expert Insights

One of the biggest benefits of joining a Stock Market WhatsApp group is having access to expert insights from experienced traders and investors. These individuals have years of experience and a wealth of knowledge to share, which can be invaluable to new investors.

Real-Time Updates and Alerts

Another advantage of joining a Stock Market WhatsApp group is being able to receive real-time updates and alerts about the stock market. This can help you make informed decisions about your investments and stay ahead of the game.

Networking Opportunities

Joining a Stock Market WhatsApp group can also provide you with opportunities to network with other investors and traders. This can lead to new connections, partnerships, and investment opportunities.

Increased Knowledge and Understanding

Finally, joining a Stock Market WhatsApp group can help you increase your knowledge and understanding of the stock market. With access to a wealth of information and insights from experienced traders and investors, you’ll be able to make better-informed decisions about your investments.

How to Find and Join a Stock Market WhatsApp Group

Finding and joining a Stock Market WhatsApp group is simple and straightforward. Here are a few links to join

Stock Market Whatsapp Group Link

Understanding the Stock Market: A Comprehensive Guide

share market course institution

The stock market can be a confusing and intimidating place for many individuals, especially those who are new to investing. However, it is important to understand the basics of how the stock market operates in order to make informed investment decisions. In this article, we will provide answers to some of the most frequently asked questions about the stock market and provide a comprehensive guide for individuals who are looking to invest.

What is the stock market?

The stock market is a platform where individuals can buy and sell ownership in public companies. This ownership is represented in the form of stock shares. The value of these stock shares is determined by supply and demand in the market, with the price of a stock rising as demand for the stock increases and vice versa.

How does the stock market work?

The stock market works by allowing individuals to buy and sell stock shares in publicly traded companies. When a company goes public, they sell a portion of their ownership in the form of stock shares to the public. This allows the company to raise capital that they can then use to grow their business.

Individuals who buy stock shares in these companies become part-owners of the company and are entitled to a portion of the company’s profits in the form of dividends. The value of the stock shares can also increase as the company grows and becomes more valuable.

What is the difference between the stock market and the stock exchange?

The stock market refers to the overall market where individuals can buy and sell stock shares in publicly traded companies. The stock exchange, on the other hand, refers to a specific platform where individuals can buy and sell stock shares.

What is a stock symbol?

A stock symbol is a unique identifier for a particular stock. This symbol is used to represent the stock on the stock exchange and can be used to easily track the performance of the stock. For example, the stock symbol for State bank of India is SBIN.

What are the different types of stocks?

There are two main types of stocks: common stock and preferred stock.

Common stock represents ownership in a company and gives individuals the right to vote on important company decisions, such as the election of directors and changes to the company’s charter. Common stock also gives individuals the right to receive dividends if the company pays them.

Preferred stock represents ownership in a company, but does not give individuals the right to vote on important company decisions. Preferred stock also gives individuals a higher priority when it comes to receiving dividends and a guaranteed rate of return.

How do I buy and sell stocks?

To buy and sell stocks, individuals must open a brokerage account with a broker who specializes in trading stocks. The broker will provide individuals with the tools and resources they need to buy and sell stocks.

Once an individual has opened a brokerage account, they can use the broker’s platform to research stocks and place orders to buy or sell stocks. The broker will then execute the trade on the individual’s behalf.

What are the risks associated with investing in the stock market?

Investing in the stock market is not without risks. The value of stock shares can be affected by a number of factors, including changes in the economy, shifts in market conditions, and the performance of the individual company. As a result, individuals can lose money when investing in the stock market.

However, the potential rewards of investing in the stock market can also be significant, making it a popular option for individuals who are looking to grow their wealth

Technical Trading Program

Learning sharks stock market Institute best technical trading program

Topics Covered

  1. Top Technical Analysis Tools for Traders
  2. Brokers Offering Technical Analysis Tools
  3. Ally Invest
  4. Charles Schwab
  5. E*TRADE
  6. Fidelity Investments
  7. Interactive Brokers
  8. Lightspeed
  9. Thinkorswim (TD Ameritrade)
  10. Trade Station
  11. Trader
  12. Technical Analysis Sites
  13. eSignal
  14. MarketGear from iVest+
  15. MetaStock
  16. NinjaTrader
  17. Slope of Hope

Top Technical Analysis trading tools

Firstly, The capacity to analyze Technical trading program data patterns is essential to a trader’s performance, especially for those who trade frequently. Techniques used in technical analysis trading tools can help traders make objective decisions. Buy and sell indicators can be produced by a technical analysis system, which can also assist in finding fresh trading opportunities. 


Secondly, In the last 15 years, software advancements have made it faster and easier to acquire millions of data points, making technical analysis tools for trading accessible to all internet traders. The majority of the better websites that provide technical analysis trading tools also direct novice traders toward a basic comprehension of the key ideas.


Thirdly,  A price may be required for some of these materials, while others are free or are part of the broker’s platform. We’ll look at various standalone resources as well as technical analysis tools included in brokers’ products. These are listed alphabetically and are not meant to imply any sort of order.

Brokers Offering Technical Analysis Trading Tools

Moreover, The following list of brokers makes use of Trading Central, a third-party source. Trading Central, a Canadian startup, offers top-notch technical analysis tools that many brokers have included in their platforms for active traders.


Furthermore, Based on acknowledged methods of technical analysis, Trading Central’s tools automatically evaluate price activity to recognize and interpret well-known chart patterns and other crucial circumstances. These technical event alerts provide traders with information on the advantages and disadvantages of the equities they are considering.

Individual investors cannot use these tools outside of brokerage platforms, however many active trader websites incorporate their technology.

Technical Analysis Trading Tools

Ally Invest

The stock screener on the brokerage platform from Ally Invest is run by Trading Central. Read Investopedia’s evaluation of Ally Invest here.

Charles Schwab

Importantly, Screener Plus, a tool available on Charles Schwab’s StreetSmart Edge platform for active traders, employs real-time streaming data to let users filter stocks and ETFs based on a variety of fundamental and technical factors, including technical indications from Trading Central (Recognia). 


Besides, The factors that are most essential to the trader can be set, and the results of Screener Plus can be integrated with the watch lists that the trader has already created. Trading Central (Recognia) pattern detection tools are incorporated into the customizable charts offered by StreetSmart Edge. There are no sketching tools available while charting on mobile devices, however, there are quite a few technical analysis indicators.

E-TRADE

Surely, The Live Action scanner offers over 100 pre-defined screens that scan the market in real time on live prices and live analytical measures based on technical, fundamental, earnings, sentiment, and news events on Power E*TRADE, the company’s active trading platform.


Clearly, The Oscillator scans included with Live Action improve clients’ portfolios by identifying overbought or oversold stocks and examining new opportunities. This Power E*TRADE platform’s built-in screens are very numerous and exclusive.


Undoubtedly, You can use the Recognia scanner to scan stocks based on technical occurrences or patterns and set alerts for when new requirements are satisfied. Power E*TRADE’s paper trading features can be used to evaluate your technical trading strategy. Read the E*TRADE review on Investopedia.

Fidelity Investments

Comparatively, Fidelity’s downloaded trading interface, Active Trader Pro, has a more comprehensive feature set than what is offered on the website. Charting options and trade tools are fully customizable in Active Trader Pro. You can receive alerts from the software regarding open positions as well as technical signs for companies you are tracking.


At last, Trading Central’s technical patterns and events have been incorporated into Fidelity’s web-based charting. A 30-day intraday data window, extended hours data, and more than 60 completely customizable technical indicators are all available with advanced charting on the web.


Of Course, Technical analysis is emphasized in the content of the Fidelity Learning Center, which consists of articles, videos, webinars, infographics, and recorded webinars. A select number of clients can participate in Fidelity’s weekly online coaching sessions to have in-depth conversations about options and technical analysis. The Fidelity review on Investopedia is available.

Interactive Brokers

However, On all of Interactive Brokers’ platforms, extensive customization of charting is available. This includes over 100 indicators and real-time streaming data. The flagship trading platform of IB, Trader Workstation (TWS), includes sophisticated technical analysis tools with over 120 indicators.


TWS offers a demo version that enables users to explore the platform’s features and simulate various trading scenarios. Additionally, you can link your IBKR account to a third-party analytics platform. At the Investors Marketplace, a comprehensive list of merchants is searchable. Read the Interactive Brokers review on Investopedia.

Lightspeed

Lightspeed’s flagship platform, a downloadable tool called Lightspeed Trader, is designed for extremely frequent traders and contains a highly customized live market scanner called LightScan that may assist you screen for current trading opportunities.


To present symbols that are sorted and filtered according to your preferences, LightScan searches the full universe of stocks. There are more than 100 searchable criteria that can be combined. Charting options are adjustable on the flagship platform.


For those who want to take the platform for a spin, there is a demo version accessible. The evaluation of Lightspeed may be found on Investopedia.

Thinkorswim (TD Ameritrade)

Thinkorswim, an advanced options-focused platform from TD Ameritrade, enables users to personalize the interface by adding their preferred tools and a trade ticket. Since There are several technical analysis trading tools available for stock traders even if the platform was first created for options trading. There are tools for drawing, technical indicators, and data visualization.


As a result of  With Thinkorswim, traders can use a built-in programming language called think script and make their own technical analysis trading tools. The most potent version of thinkorswim is the desktop version, although there is also a web version and a mobile app available. All of them contain live, streaming data that is used to support more than 400 technical investigations.


Therefore, The thinkorswim trading systems will continue to be available when the two businesses combine, according to Charles Schwab, which is acquiring TD Ameritrade. The platform integrations were anticipated to take another 18–36 months after the transaction was finalized in the fourth quarter of 2020.

Trade Station

The TradeStation platform excels at statistical modeling of trading strategies and technical analysis. Technical analysis is ingrained in the brokerage because it was founded by Omega Research, a company that develops tools for technical analysis.


The TradeStation 10 platform, which may be downloaded, has outstanding tick data-based charting capabilities. The charting software includes automated technical analysis, which shows technical patterns as they emerge on the charts. The features of web charting largely resemble those of TradeStation 10, and they include a new toolbar with access to changing time frames, drawing tools, sessions, and styles.


One of the best charting programs offered by any broker, it stands out for its seamless integration with TradeStation’s order management platform. Users of TradeStation can develop and backtest trading strategies based on technical events. The TradeStation trading simulator offers a sizable historical database for backtesting techniques in addition to all the capabilities included in TradeStation 10. Read the TradeStation review on Investopedia.

Trader

With a trading engine, a brokerage-account management system, and some market data, Tradier is a unique creature. Customers can log in and trade from any of Tradier’s developer partners because account preferences and market information are stored in the cloud. They also have a desktop version that may be downloaded.


Front-end designers can build their own trading platforms, mobile apps, algorithmic trading systems, or other tailored features for their clients using an application programming interface (API). Although many of the above-mentioned brokers offer the opportunity to connect a third-party platform to an online brokerage account, Tradier is the first broker to make this functionality the core of its business strategy.


If a standalone technical analysis site can be attached to Tradier’s brokerage administration platform, allowing trades while using analytical tools, we’ll note it in the following section.

Technical Analysis Sites

E-Signal

One of the illustrious names in technical analysis is ESignal. Technical analysis trading tools studies, backtesting of trading techniques, customizable charting, and data from international exchanges are all included in the most recent edition of eSignal, version 12. It is a downloadable Windows-based software program.


Users can trade with a number of brokers, such as Tradier and Interactive Brokers, via API. The Classic edition, which uses data that is 15 minutes delayed, costs $56 a month. The monthly cost of its Signature version, which uses real-time data and has a number of cutting-edge features, is $183. Monthly fees for the Elite edition are $378.

MarketGear from iVest+

With Market Gear’s charting features, you can evaluate prior transactions, draw permanent trendlines, view your trades, study customizable indicators, and choose from a variety of time frames.


To locate trade opportunities based on technical data, the scanner helps you search through more than 100 customizable technical indicators. As many scans as you like can be written; simply set your favorites for easy access.


To connect to TD Ameritrade, E*TRADE, ChoiceTrade, and Ally Invest, Market Gear uses their APIs. Costs begin at $75 per month.

MetaStock

Another established competitor in the technical analysis sector is MetaStock, which was established in the late 1980s. There are various software versions available; MetaStock R/T, which uses real-time trading data from your preferred exchanges, is the most helpful for frequent traders.


More than 150 indicators, line studies, and indication interpretations are included, along with information on how to trade each indicator. The Indicator Builder allows experienced users to create their own indicators. You have the option of developing and backtesting trading methods on your own or using the techniques that are already part of the package. 


On a chart, MetaStock can spot more than 30 candle patterns and advise you on how to read and use them.$100/month is the cost of a Metastock R/T subscription; data feeds are extra. MetaStock links to online brokers using an API.

NinjaTrader

Before making a real-money investment in a live market, you can develop, test, and simulate a trading system for stocks, foreign exchange, and futures using the trading environment provided by NinjaTrader. For advanced charting, backtesting, and trade simulation, NinjaTrader is free to use, although some indicators created by third parties have a cost.


The standard package includes more than 100 technical indicators in addition to fundamentals, charts, trade journaling, and research tools.


You can integrate NinjaTrader with TD Ameritrade, Interactive Brokers, FXCM, and other platforms via API, or you can use NinjaTrader’s own brokerage service to execute trades.

Slope of Hope

To share charts and trading experiences with a select handful of his admirers, Slope of Hope was launched in 2005 by inventor and perma-bear Tim Knight, who had just sold his charting website, Prophet.net, to TD Ameritrade. Nowadays, it serves as a hub for technical analysis, trading suggestions, charts, and discussions among traders of all shades.


Many of the features, such as a potent technical charting package, are available for free and are comparable to those of much more expensive websites. One of SlopeCharts’ most useful features is SlopeRules, which enables you to design and test a trading system using mathematical formulae. Set up an alert to notify you when the circumstances are met, then drag and drop the rules you want to apply on a chart, test them, and then utilize them.


For you to learn how to refine your trading talents, an integrated virtual trading system is offered that starts with an account with $100,000. Options traders will come across some excellent analytical tools.


Access to more data, thorough options analysis, and access to unique trading ideas are all features of premium membership tiers ($14.95–79.95 a month, two months free with an annual subscription).


The slope has released native mobile applications for iOS and Android smartphones that give users access to all posts and a portion of the website’s capabilities.