Learning sharks-Share Market Institute

To know more about the Stock Market Courses Call Rajouri Garden 8595071711  or Noida 8920210950

NIFTY 50 ANALYSIS! TOUCHED 19000, WHAT’S NEXT

While our nation’s hero has touched the 19,000 mark for the first time, investors are happy and curious to know what’s next. What’s been in their minds has become a common question today. Will nifty go to 20,000? Well, Read more to know

First, let me congratulate all the investors for sticking by. Nifty 50, as we all know is an INDEX which showcases the typical retail, FII or DII mood. When it is trending up, demands are high and the economy is doing good. Vice versa, if it’s down, the economy isn’t doing so great.

While it has made a run to its new benchmark, is it going to stop here now? Short answer: No.

Al-though, corrections are healthy and necessary but will come to that in a second. NIFTY 50 and Sensex both have created an all-time high. Surprisingly, we have spotted a pattern in it. It’s called a rising wedge pattern ( in making).

What is the rising wedge pattern?

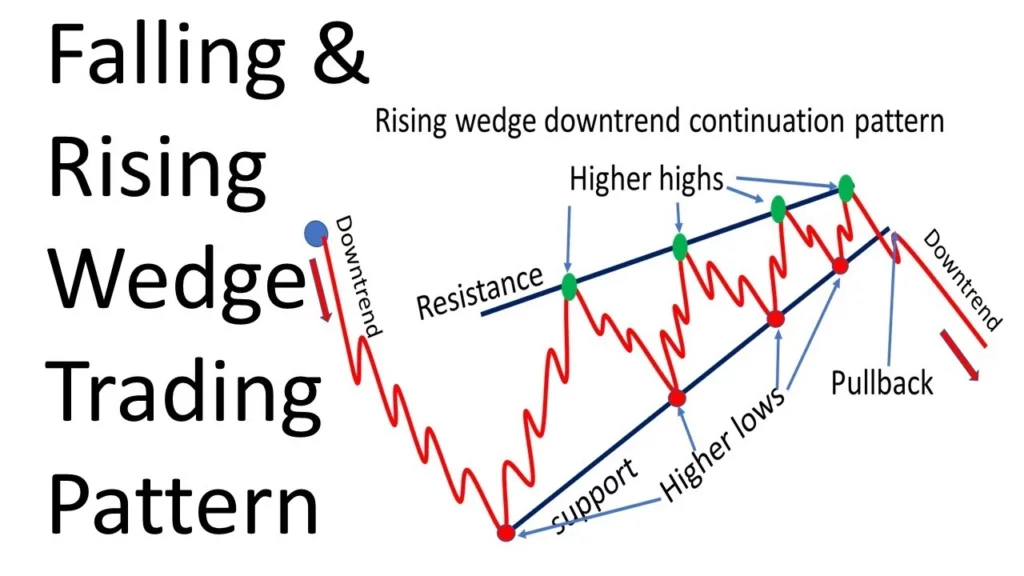
A rising wedge pattern is a technical chart pattern that frequently appears when the financial markets are on an uptrend. Two trendlines that converge towards one another, with the lower trendline being steeper than the higher trendline, are drawn to create it. Within the wedge formation, the price has a propensity to produce higher highs and higher lows.

Let’s just apply this to the Nifty 50 chart. Here’s what it looks like

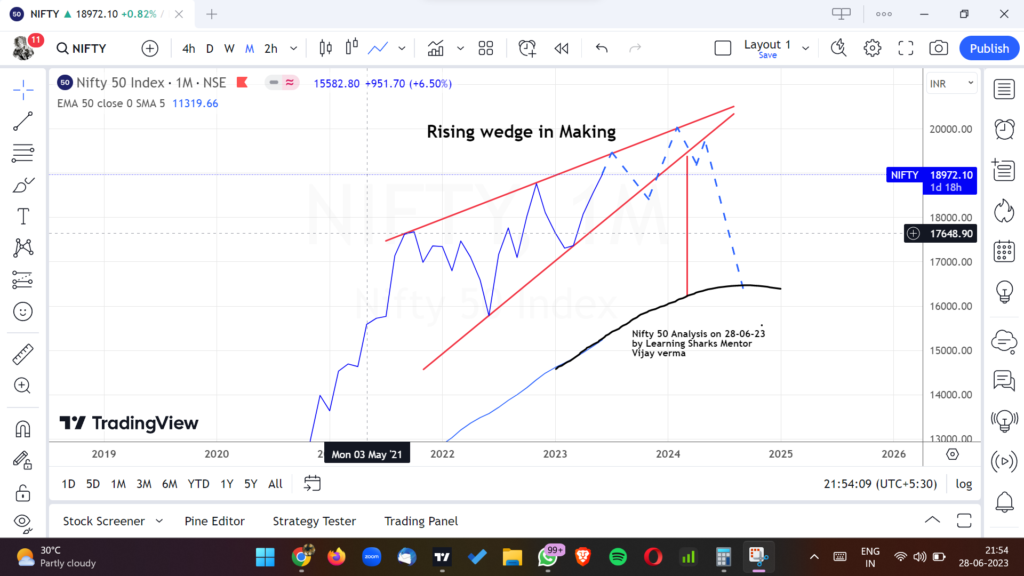
It certainly looks like touching a further 20,000 benchmark. Before, giving us that most awaited fall that all PE or put holders waiting for. Our advice would be to play carefully, and not to be a victim of this euphoria.

Disclaimer: This is not financial advice or call. The analysis done above is merely for educational purposes. Please make your investment according to your own financial advisor. To know more about the pattern click here, Follow us on insta

A Chemical Company which can make your portfolio shine

Falling wedge pattern

What is a Falling wedge pattern?

When the market makes lower lows and lower highs with a contracting range, a chart pattern arises. It suggests a possible reversal in the trend in the upward direction. That is called a Falling wedge pattern.

What are Technical Analysis Chart patterns?

A chart pattern is a shape within a price chart that helps to predict what prices will do next based on prior performance. Chart patterns are the foundation of technical analysis and necessitate a trader’s understanding of both what they are looking at and what they are looking for.

If you wanna learn about all the chart patterns for free, click here

Chemplast Sanmar Limited is a chemical firm based in India.[1] It is a leading producer of PVC resins, chlorochemicals, and pipe systems.

We recommend this stock at CMP 405, for multiple reasons. The stock has been taking a beating since its IPO listing. Fortunately, the company has been making only a profit, and it’s considered a bright addition to your portfolio.

If you know about support and resistance; you will learn, the stock is on its resistance after multiple attempts of Breaking out.

Stock Breaking out of its resistance in the chart above.

Now that you have seen it on the chart along side the Falling wedge pattern. Let’s look at the fundamental side of the Chemplasts Sanmar.

Profit & Loss

Consolidated Figures in Rs. Crores / View StandalonePRODUCT SEGMENTS

Mar 2019Mar 2020Mar 2021Mar 2022TTM
Sales +1,2541,2583,7995,8925,601
Expenses +9691,0113,1714,6954,884
Operating Profit2862476281,197717
OPM %23%20%17%20%13%
Other Income +12848457-23
Interest4895433322151
Depreciation5687131137149
Profit before tax19372547796395
Tax %39%36%25%18%
Net Profit11846410649338
EPS in Rs14.816.8830.5941.0321.38
Dividend Payout %0%0%0%0%
Compounded Sales Growth
10 Years:%
5 Years:%
3 Years:67%
TTM:3%
Compounded Profit Growth
10 Years:%
5 Years:%
3 Years:75%
TTM:-50%
Stock Price CAGR
10 Years:%
5 Years:%
3 Years:%
1 Year:-35%
Return on Equity
10 Years:%
5 Years:%
3 Years:12%
Last Year:50%
P&l of Chemplasts sanmar

Balance Sheet

Consolidated Figures in Rs. Crores / View StandaloneCORPORATE ACTIONS

Mar 2019Mar 2020Mar 2021Mar 2022Sep 2022
Share Capital +671,2741,2517979
Reserves2,4331,845-4171,6261,705
Borrowings +25382943882925
Other Liabilities +1,0492,1133,8933,0143,101
Total Liabilities3,8024,1084,4875,6015,810
Fixed Assets +2,1082,1743,1483,2593,211
CWIP1178253473
Investments1,1591,458000
Other Assets +4184671,3132,3082,525
Total Assets3,8024,1084,4875,6015,810
The balance sheet of Chemplasts sanmar

Conclusion

Now that you have seen the fundamentals and the technicals of this stock. You would see the price CMP 405 is a good price to add on. However, as a Disclaimer, we suggest you do your complete analysis before adding this stock. This is not buying financial advice, but instead merely for education purposes.

If you are new to this page, Don’t forget to check out our courses page.

To contact us, use this link.

#stockmarket #learningsharks #chemplastsanmar #fallingwedge #chartpatterns

Join our Stock Market WhatsApp group

Investment, Trading, Financial updates, Stock trading tips

The Ultimate Guide to Joining a Stock Market WhatsApp Group

As the world becomes more interconnected, investors are seeking new and innovative ways to stay up to date on the latest stock market trends. One of the most popular methods is through joining a Stock Market WhatsApp group. These groups offer a wealth of information, tips, and insights from experienced traders and investors. If you’re interested in learning more about the stock market and increasing your knowledge, then joining a Stock Market WhatsApp group may be just what you need.

What is a Stock Market WhatsApp Group?

A Stock Market WhatsApp group is a community of individuals who share information and insights about the stock market. Members of the group can share news, analysis, and tips on specific stocks or market trends. These groups provide a platform for members to communicate and exchange ideas in real-time.

Benefits of Joining a Stock Market WhatsApp Group

Joining a Stock Market WhatsApp group can offer a number of benefits to investors, including:

Access to Expert Insights

One of the biggest benefits of joining a Stock Market WhatsApp group is having access to expert insights from experienced traders and investors. These individuals have years of experience and a wealth of knowledge to share, which can be invaluable to new investors.

Real-Time Updates and Alerts

Another advantage of joining a Stock Market WhatsApp group is being able to receive real-time updates and alerts about the stock market. This can help you make informed decisions about your investments and stay ahead of the game.

Networking Opportunities

Joining a Stock Market WhatsApp group can also provide you with opportunities to network with other investors and traders. This can lead to new connections, partnerships, and investment opportunities.

Increased Knowledge and Understanding

Finally, joining a Stock Market WhatsApp group can help you increase your knowledge and understanding of the stock market. With access to a wealth of information and insights from experienced traders and investors, you’ll be able to make better-informed decisions about your investments.

How to Find and Join a Stock Market WhatsApp Group

Finding and joining a Stock Market WhatsApp group is simple and straightforward. Here are a few links to join

Stock Market Whatsapp Group Link

Understanding Stock Market Indicators: A Comprehensive Guide

Introduction to Stock Market Indicators

A beginner trader may find the stock market confusing, but with the help of stock market indicators, you can make informed decisions about when to buy and sell stocks. This comprehensive guide will teach you about the various types of stock market indicators and how to incorporate them into your trading strategy. To know more about the patterns, click here

  1. Introduction to Stock Market Indicators
  2. Types of Stock Market Indicators
    a. Technical Indicators
    b. Fundamental Indicators
    c. Momentum Indicators
    d. Trend Indicators
  3. How to Use Stock Market Indicators in Your Trading Strategy
  4. Conclusion

Types of Stock Market Indicators

Technical indicators and fundamental indicators are the two main types of stock market indicators.

Technical Indicators: Technical indicators are mathematical calculations based on a security’s price and/or volume. These indicators provide historical performance data and can be used to forecast future price movements. Moving averages, Bollinger Bands, and the Relative Strength Index are examples of technical indicators (RSI).

Fundamental Indicators

Fundamental indicators are economic and financial data, such as earnings, revenue, and the overall health of a company. These indicators provide information about a company’s financial health and are used to make predictions about future performance. Examples of fundamental indicators include the P/E ratio, Debt-to-Equity ratio, and the Price-to-Book ratio.

Momentum Indicators

Momentum indicators measure the rate of change in a security’s price. These indicators help traders identify whether a stock is gaining or losing momentum and can be used to make predictions about future price movements. Examples of momentum indicators include the Moving Average Convergence Divergence (MACD) and the Stochastic Oscillator.

Trend Indicators

Trend indicators measure the direction and strength of a trend. These indicators help traders identify whether a stock is in an uptrend, downtrend, or moving sideways. Examples of trend indicators include the Moving Average and the Trendline.

How to Use Stock Market Indicators in Your Trading Strategy:

  1. Choose the right indicators: Select indicators that align with your investment goals and trading style.
  2. Create a strategy: Develop a strategy that combines different indicators to create a comprehensive approach to trading.
  3. Monitor performance: Keep track of your trades and adjust your strategy as needed based on the performance of your indicators.
  4. Stay patient: Don’t make impulsive decisions based solely on one indicator. Wait for multiple indicators to confirm a trade before making a move.

Conclusion

Stock market indicators can be a valuable tool for traders, but they must be chosen carefully and in conjunction with a comprehensive strategy. You can make informed decisions about when to buy and sell stocks by combining different indicators and monitoring their performance.