Checked by: Vijay Verma
NESTLE started doing business in India in 1912, importing and selling finished goods there. The business gradually increased its presence in India. Are you holding this stock?
The company has maintained its share capital and its continuous supply of FMCG made this stock a multi-bagger. If anybody had invested in this stock in 2010, this stock would have given 600% growth along with Dividends and bonuses.
Nestle CMP is Rs20338 as of Dec 13 which is almost its all-time high. Ideally is it not advised to make a new entry at this point of time? While looking at the NIFTY 50 CMP 18608 again at its all-time high suggesting the stocks would see resistance at this level.
Let’s look at the technical analysis of the stock.
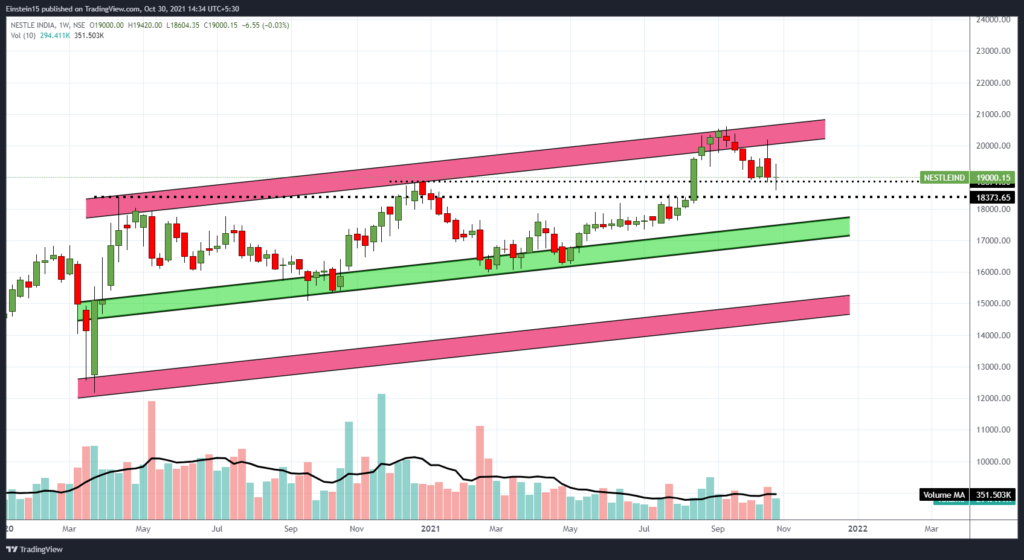
Looking at the technical analysis of the stock, the stock seems to be touching the upper band of the channel. Another entry can be taken somewhere around the support.
let’s look at the fundaments of this stock
Quarterly Results Figures in Rs. Crores
Profit & Loss
Figures in Rs. Crores
| Dec 2010 | Dec 2011 | Dec 2012 | Dec 2013 | Dec 2014 | Dec 2015 | Dec 2016 | Dec 2017 | Dec 2018 | Dec 2019 | Dec 2020 | Dec 2021 | TTM | |
|---|---|---|---|---|---|---|---|---|---|---|---|---|---|
| Sales + | 6,255 | 7,515 | 8,335 | 9,101 | 9,855 | 8,175 | 9,141 | 10,010 | 11,292 | 12,369 | 13,350 | 14,709 | 16,348 |
| Expenses + | 5,016 | 5,990 | 6,509 | 7,153 | 7,816 | 6,620 | 7,292 | 7,913 | 8,675 | 9,443 | 10,149 | 11,118 | 12,727 |
| Operating Profit | 1,239 | 1,525 | 1,825 | 1,948 | 2,039 | 1,555 | 1,850 | 2,097 | 2,618 | 2,926 | 3,202 | 3,592 | 3,620 |
| OPM % | 20% | 20% | 22% | 21% | 21% | 19% | 20% | 21% | 23% | 24% | 24% | 24% | 22% |
| Other Income + | 35 | 21 | 31 | 97 | 87 | -391 | 140 | 177 | 259 | 247 | 146 | -116 | -138 |
| Interest | 1 | 5 | 27 | 37 | 14 | 3 | 91 | 92 | 112 | 129 | 164 | 201 | 153 |
| Depreciation | 128 | 153 | 277 | 330 | 338 | 347 | 354 | 342 | 336 | 370 | 370 | 390 | 410 |
| Profit before tax | 1,145 | 1,388 | 1,553 | 1,678 | 1,774 | 814 | 1,545 | 1,839 | 2,429 | 2,673 | 2,813 | 2,884 | 2,920 |
| Tax % | 29% | 31% | 31% | 33% | 33% | 31% | 35% | 33% | 34% | 26% | 26% | 26% | |
| Net Profit | 819 | 962 | 1,068 | 1,117 | 1,185 | 563 | 1,001 | 1,225 | 1,607 | 1,968 | 2,082 | 2,145 | 2,165 |
| EPS in Rs | 84.91 | 99.73 | 110.76 | 115.87 | 122.87 | 58.42 | 103.86 | 127.07 | 166.67 | 204.16 | 215.98 | 222.46 | 224.55 |
| Dividend Payout % | 57% | 49% | 44% | 42% | 51% | 83% | 61% | 68% | 69% | 168% | 93% | 90% |
Balance Sheet
Figures in Rs. CroresCORPORATE ACTIONS
| Dec 2010 | Dec 2011 | Dec 2012 | Dec 2013 | Dec 2014 | Dec 2015 | Dec 2016 | Dec 2017 | Dec 2018 | Dec 2019 | Dec 2020 | Dec 2021 | Jun 2022 | |
|---|---|---|---|---|---|---|---|---|---|---|---|---|---|
| Share Capital + | 96 | 96 | 96 | 96 | 96 | 96 | 96 | 96 | 96 | 96 | 96 | 96 | 96 |
| Reserves | 759 | 1,178 | 1,702 | 2,272 | 2,741 | 2,721 | 3,186 | 3,324 | 3,577 | 1,822 | 1,923 | 1,988 | 2,232 |
| Borrowings + | 0 | 971 | 1,050 | 1,189 | 20 | 18 | 33 | 35 | 35 | 189 | 147 | 266 | 280 |
| Other Liabilities + | 1,703 | 2,157 | 2,315 | 2,756 | 2,963 | 3,251 | 3,495 | 3,907 | 4,379 | 5,065 | 5,733 | 5,860 | 6,007 |
| Total Liabilities | 2,558 | 4,402 | 5,164 | 6,314 | 5,820 | 6,086 | 6,810 | 7,363 | 8,088 | 7,173 | 7,900 | 8,210 | 8,616 |
| Fixed Assets + | 1,013 | 1,576 | 3,204 | 3,369 | 3,177 | 2,898 | 2,730 | 2,616 | 2,401 | 2,341 | 2,179 | 2,994 | 3,054 |
| CWIP | 349 | 1,372 | 344 | 295 | 245 | 231 | 188 | 94 | 105 | 143 | 639 | 246 | 197 |
| Investments | 151 | 134 | 365 | 851 | 812 | 1,325 | 1,756 | 1,979 | 2,658 | 1,751 | 1,464 | 774 | 809 |
| Other Assets + | 1,046 | 1,320 | 1,251 | 1,799 | 1,586 | 1,633 | 2,136 | 2,673 | 2,924 | 2,937 | 3,618 | 4,196 | 4,556 |
| Total Assets | 2,558 | 4,402 | 5,164 | 6,314 | 5,820 | 6,086 | 6,810 | 7,363 | 8,088 | 7,173 | 7,900 | 8,210 | 8,616 |
Cash Flows
Figures in Rs. Crores
| Dec 2010 | Dec 2011 | Dec 2012 | Dec 2013 | Dec 2014 | Dec 2015 | Dec 2016 | Dec 2017 | Dec 2018 | Dec 2019 | Dec 2020 | Dec 2021 | |
|---|---|---|---|---|---|---|---|---|---|---|---|---|
| Cash from Operating Activity + | 1,037 | 1,158 | 1,693 | 1,796 | 1,644 | 1,098 | 1,466 | 1,818 | 2,052 | 2,295 | 2,454 | 2,271 |
| Cash from Investing Activity + | -446 | -1,528 | -941 | -441 | -432 | -70 | -126 | -131 | -52 | 83 | -321 | -1,957 |
| Cash from Financing Activity + | -544 | 323 | -513 | -580 | -1,635 | -498 | -666 | -997 | -1,317 | -3,602 | -1,956 | -2,019 |
| Net Cash Flow | 47 | -47 | 239 | 775 | -423 | 529 | 674 | 691 | 683 | -1,223 | 177 | -1,704 |
Ratios
Figures in Rs. Crores
| Dec 2010 | Dec 2011 | Dec 2012 | Dec 2013 | Dec 2014 | Dec 2015 | Dec 2016 | Dec 2017 | Dec 2018 | Dec 2019 | Dec 2020 | Dec 2021 | |
|---|---|---|---|---|---|---|---|---|---|---|---|---|
| Debtor Days | 4 | 6 | 4 | 3 | 4 | 4 | 4 | 3 | 4 | 4 | 5 | 4 |
| Inventory Days | 82 | 89 | 86 | 79 | 82 | 103 | 107 | 91 | 92 | 107 | 107 | 111 |
| Days Payable | 106 | 92 | 63 | 68 | 71 | 94 | 91 | 99 | 118 | 124 | 115 | 122 |
| Cash Conversion Cycle | -20 | 3 | 28 | 14 | 15 | 12 | 20 | -5 | -22 | -14 | -3 | -7 |
| Working Capital Days | -51 | -14 | -11 | -17 | -13 | -21 | -10 | -15 | -21 | -19 | -21 | -15 |
| ROCE % | 161% | 90% | 62% | 53% | 56% | 46% | 54% | 57% | 71% | 96% | 139% | 147% |
Shareholding Pattern
Numbers in percentagesDEALS / TRADES
8 recently
| Dec 2019 | Mar 2020 | Jun 2020 | Sep 2020 | Dec 2020 | Mar 2021 | Jun 2021 | Sep 2021 | Dec 2021 | Mar 2022 | Jun 2022 | Sep 2022 | |
|---|---|---|---|---|---|---|---|---|---|---|---|---|
| Promoters + | 62.76 | 62.76 | 62.76 | 62.76 | 62.76 | 62.76 | 62.76 | 62.76 | 62.76 | 62.76 | 62.76 | 62.76 |
| FIIs + | 12.07 | 11.81 | 12.10 | 11.51 | 12.84 | 12.29 | 12.43 | 12.31 | 12.35 | 12.01 | 11.65 | 12.05 |
| DIIs + | 8.92 | 9.12 | 8.71 | 8.91 | 7.75 | 7.95 | 7.92 | 7.99 | 7.89 | 8.60 | 9.14 | 8.86 |
| Government + | 0.07 | 0.07 | 0.07 | 0.00 | 0.00 | 0.00 | 0.00 | 0.00 | 0.00 | 0.00 | 0.00 | 0.00 |
| Public + | 16.18 | 16.24 | 16.36 | 16.82 | 16.65 | 16.99 | 16.88 | 16.93 | 16.99 | 16.62 | 16.45 | 16.33 |
Overall the company seems good to hold. However, It might take a healthy correction. If you wanna learn about the course check out our courses page.
#stockmarket #sharemarket #nestle
Update – 15-04-23
Current Market price is 19465