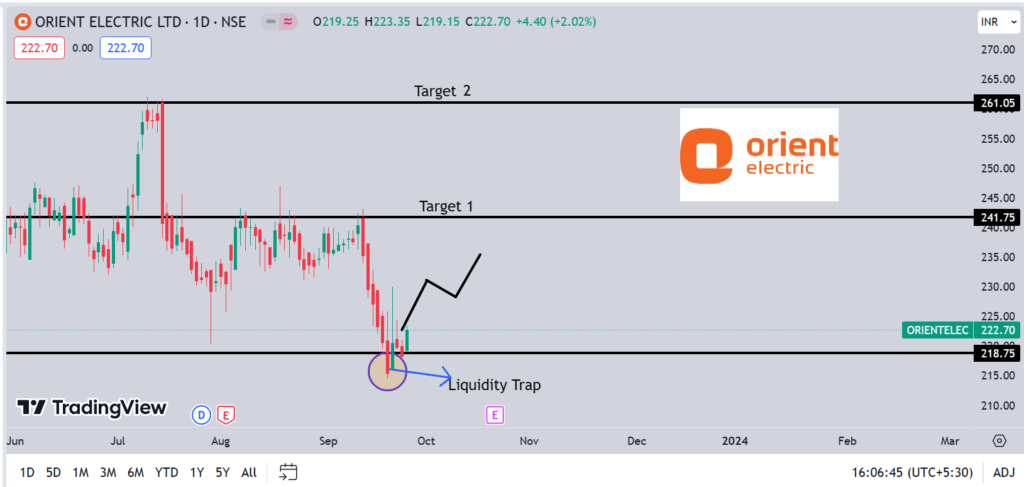
An Indian company called Orient Electric Limited provides electrical solutions for everyday life. The company’s main business activities include the production, acquisition, and marketing of switchgear, lighting, and other electrical consumer durables. The company has production facilities in Kolkata, Noida, and Faridabad. Lighting and Switchgear and Electrical Consumer Durables make up the company’s two business segments. Our experts advice that one can buy orient electric shares at Rs220 with a target of 240 and 260.
Technical Analysis
Let us look at the Fundamentals
Profit & Loss
Figures in Rs. CroresPRODUCT SEGMENTS
Mar 2017
Mar 2018
Mar 2019
Mar 2020
Mar 2021
Mar 2022
Mar 2023
TTM
Sales +
212
1,600
1,864
2,062
2,033
2,448
2,529
2,613
Expenses +
188
1,461
1,721
1,885
1,813
2,217
2,378
2,456
Operating Profit
24
139
143
177
220
231
151
157
OPM %
11%
9%
8%
9%
11%
9%
6%
6%
Other Income +
1
3
8
4
6
6
27
24
Interest
3
24
23
26
21
20
22
23
Depreciation
2
20
23
40
43
47
54
55
Profit before tax
20
98
105
114
162
170
102
103
Tax %
41%
35%
34%
31%
26%
25%
26%
Net Profit +
12
64
69
79
120
127
76
77
EPS in Rs
3.02
3.27
3.71
5.64
5.97
3.56
3.60
Dividend Payout %
0%
33%
31%
31%
35%
34%
42%
Compounded Sales Growth
10 Years:
%
5 Years:
10%
3 Years:
7%
TTM:
-1%
Compounded Profit Growth
10 Years:
%
5 Years:
3%
3 Years:
-1%
TTM:
-46%
Stock Price CAGR
10 Years:
%
5 Years:
10%
3 Years:
7%
1 Year:
-19%
Return on Equity
10 Years:
%
5 Years:
23%
3 Years:
22%
Last Year:
13%
Balance Sheet
Figures in Rs. CroresCORPORATE ACTIONS
Mar 2017
Mar 2018
Mar 2019
Mar 2020
Mar 2021
Mar 2022
Mar 2023
Share Capital +
21
21
21
21
21
21
21
Reserves
192
242
285
338
434
520
563
Borrowings +
211
186
135
155
61
68
97
Other Liabilities +
338
359
447
446
645
579
583
Total Liabilities
740
808
889
960
1,162
1,187
1,265
Fixed Assets +
109
106
117
190
186
212
226
CWIP
0
5
4
10
11
3
86
Investments
0
0
0
0
0
0
0
Other Assets +
630
698
768
760
965
972
953
Total Assets
740
808
889
960
1,162
1,187
1,265
Disclaimer : The information mentioned above is merely an opinion and should only be treated for educational purposes. If you have any questions or feedback about this article, you can write us back. To reach out, you can use our contact us page.
A technical technique known as a candlestick chart condenses data from many time frames into a single price bar. They are therefore more beneficial than conventional open, high, low, close (OHLC) bars or straightforward lines that connect closing price dots. Candlesticks create patterns that, when finished, may be used to forecast price movement.
Candlesticks are typically employed daily with the theory that each candle represents a complete day’s worth of news, data, and price movement. This implies that swing or longer-term traders might benefit more from candles.
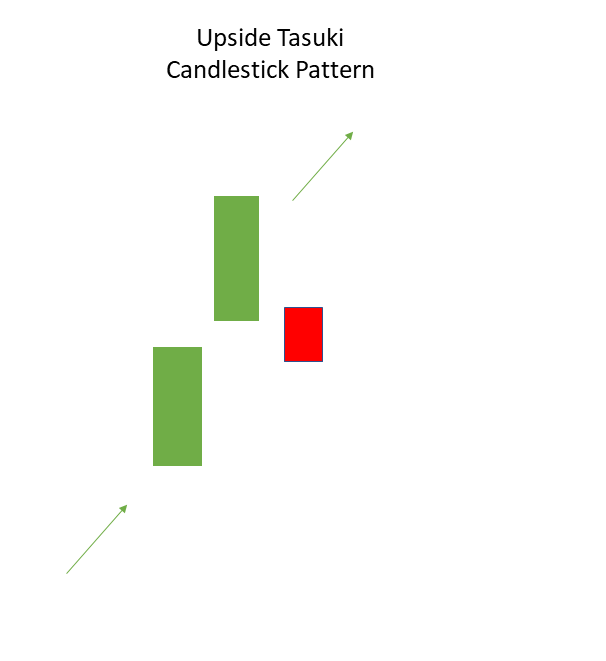
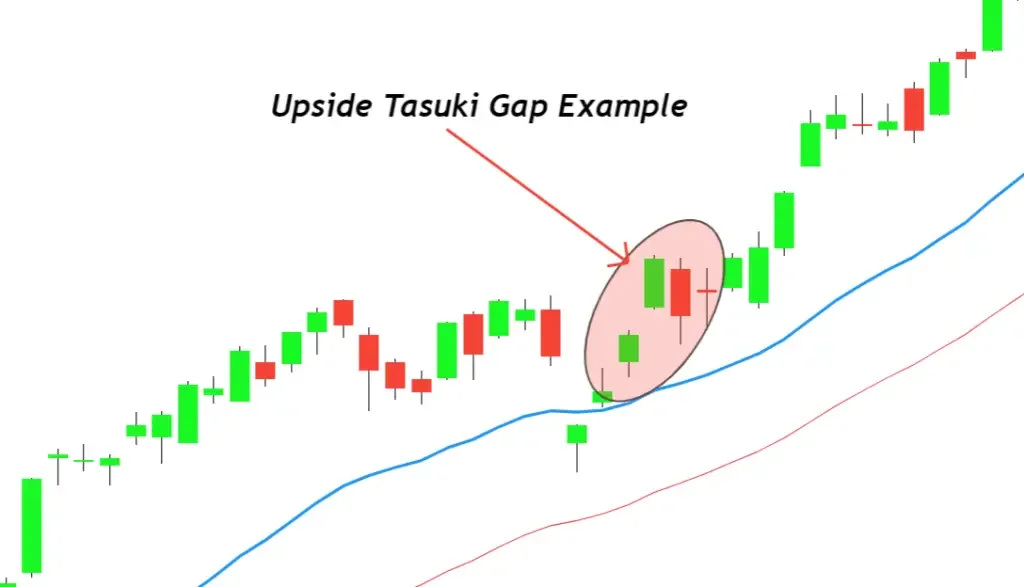
Upside Tasuki Gap
It is a bullish continuation candlestick pattern that has developed during an uptrend that is still present.
Three candles make up this candlestick pattern, the first of which is a long-bodied bullish candlestick produced following a gap up, and the second of which is a bullish candlestick chart as well.
A bearish candle that closes the space left between the first two bullish candlesticks is the third candlestick.
Example:
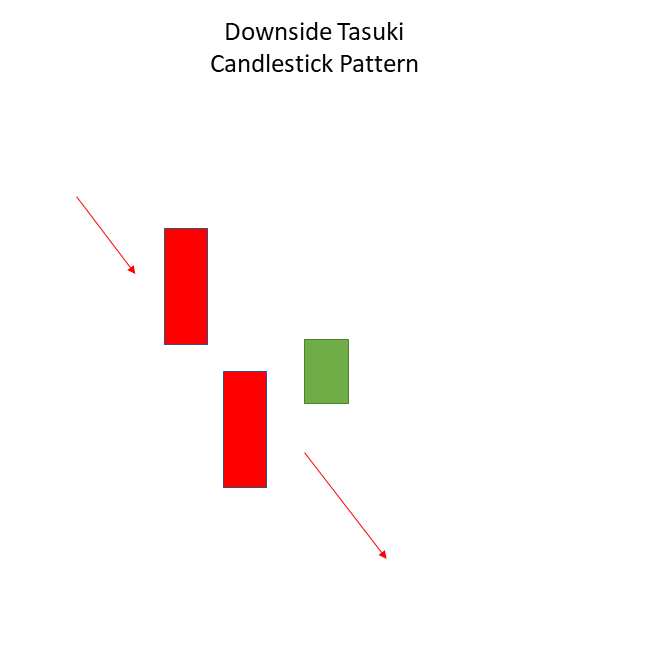
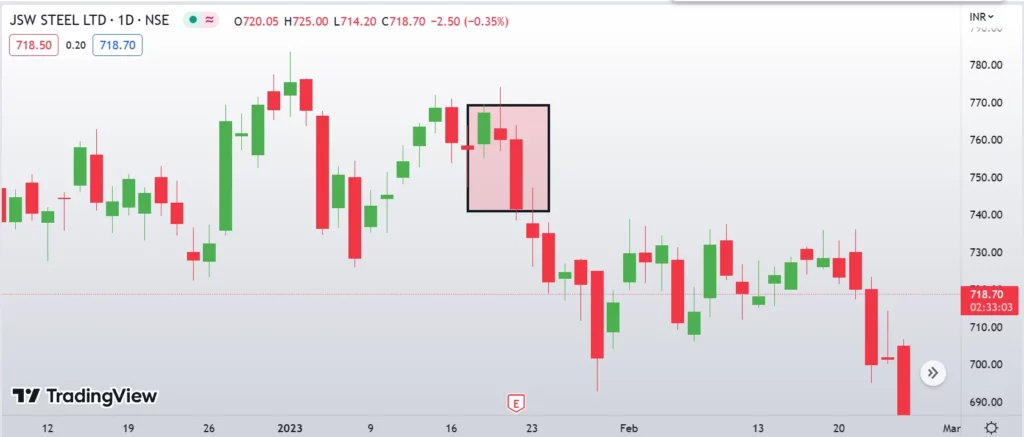
Downside Tasuki Gap
It is a continuous downtrend-related bearish continuation candlestick pattern.
Three candles make up this candlestick pattern, the first of which is a long-bodied bearish candlestick created following a gap down. The second candlestick is also a bearish candlestick.
A bullish candle that fills the space left open by the first two bearish candles is the third candlestick.
Example:
Disclaimer : The information mentioned above is merely an opinion and should only be treated for educational purposes. If you have any questions or feedback about this article, you can write us back. To reach out, you can use our contact us page.
Transitions between rising and sliding trends are frequently indicated by stock chart patterns. Using a sequence of trendlines and/or curves, one can identify a price pattern, which is a recognizable configuration of price movement.
A continuation pattern develops when the trend continues in its current direction after a brief pause; a reversal pattern emerges when a price pattern signifies a shift in trend direction.
What is a Candlestick Pattern
A technical technique known as a candlestick chart condenses data from many time frames into a single price bar. They are therefore more beneficial than conventional open, high, low, close (OHLC) bars or straightforward lines that connect closing price dots. Candlesticks create patterns that, when finished, may be used to forecast price movement.
Candlesticks are typically employed daily with the theory that each candle represents a complete day’s worth of news, data, and price movement. This implies that swing or longer-term traders might benefit more from candles.
Most importantly, every candle has a tale to tell. The best way to look at a candle is as a competition between buyers and sellers. A light candle (green or white are usual default displays) indicates that the day belonged to the purchasers, whilst a dark candle (red or black) indicates that the day belonged to the sellers.
But what makes candlesticks so appealing as a charting tool is what transpires between the open and the close, as well as the struggle between buyers and sellers.
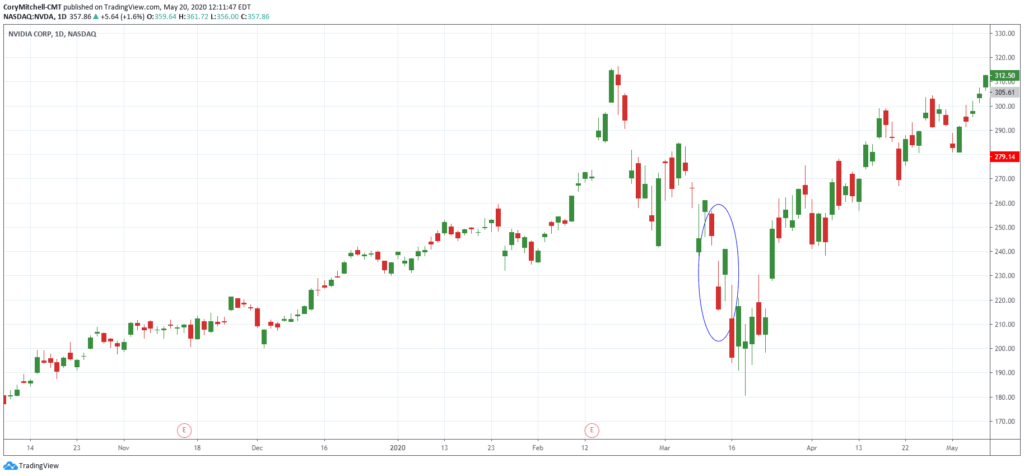
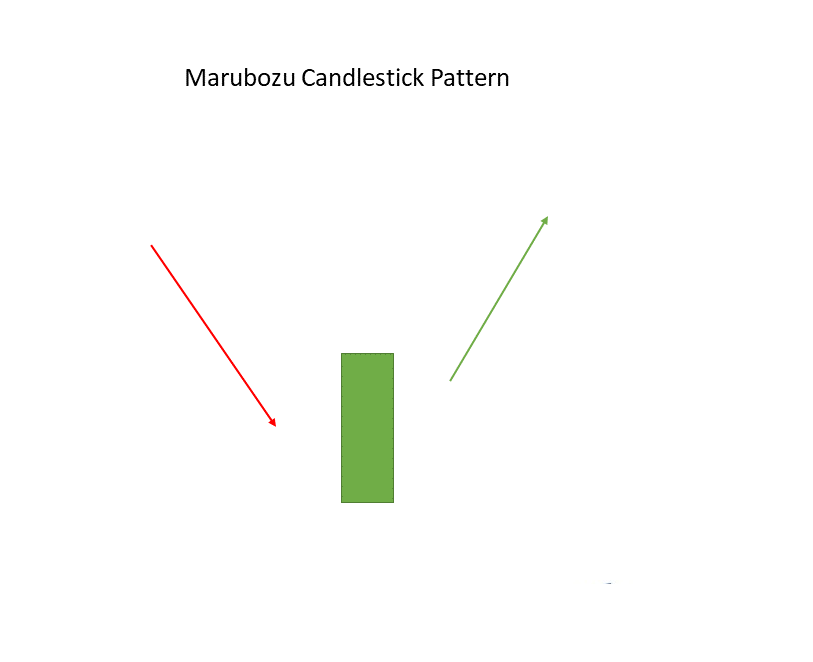
White Marubozu
After a slump, the White Marubozu is a single candlestick pattern that denotes a bullish reversal.
The markets may turn bullish since this candlestick has a long bullish body and no upper or lower shadows, which indicates that the bulls are applying purchasing pressure.
Example:
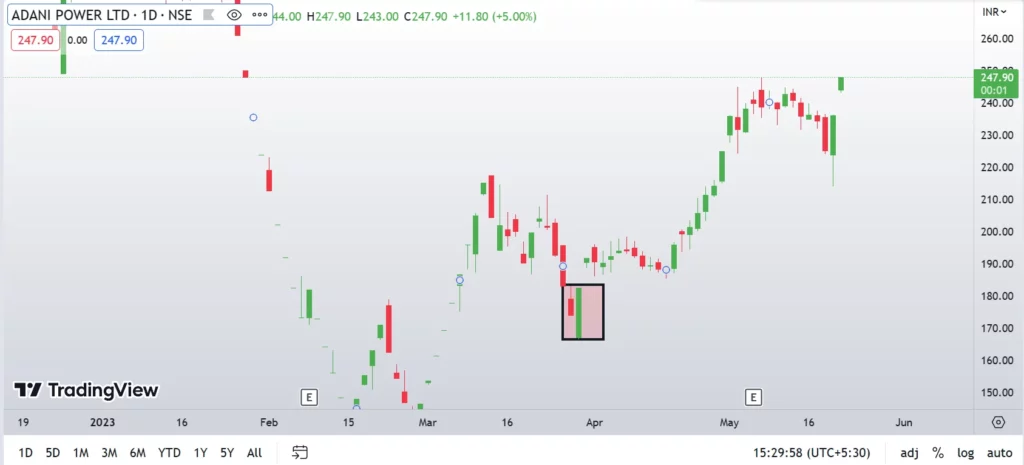
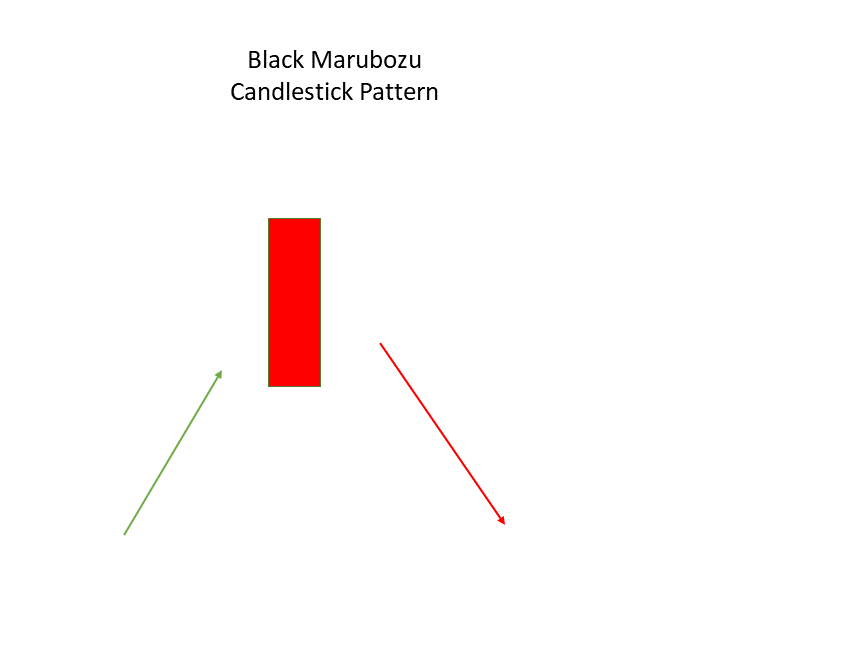
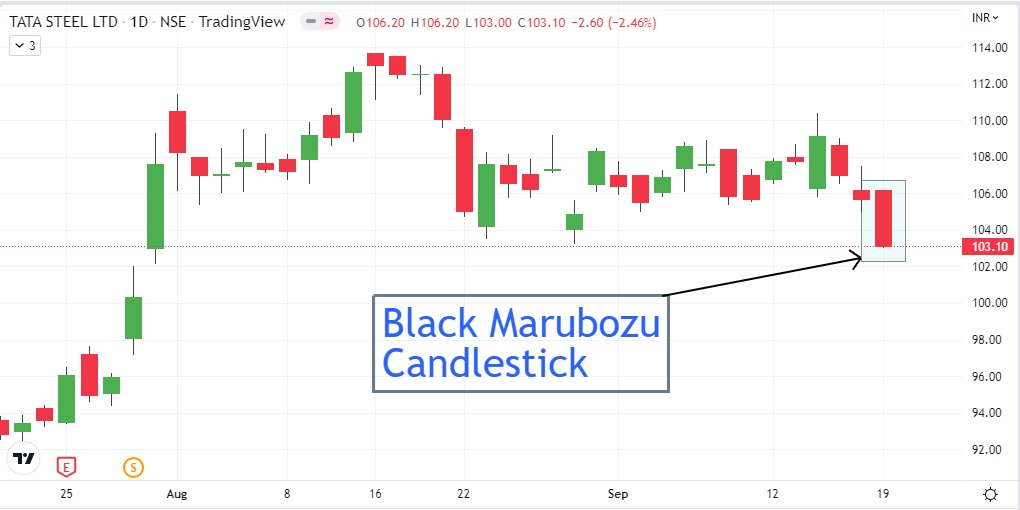
Black Marubozu
After an uptrend, the Black Marubozu is a single candlestick pattern that denotes a bearish reversal.
With no upper or lower shadows and a long bearish body, this candlestick pattern indicates that the bears are applying selling pressure and that the markets may become negative.
The purchasers should exercise cautious and close their positions when this candle forms.
Example:
Disclaimer : The information mentioned above is merely an opinion and should only be treated for educational purposes. If you have any questions or feedback about this article, you can write us back. To reach out, you can use our contact us page.
Star Health Insurance earns net profit of Rs 102 crore in March quarter. The net premium income increased to Rs 19,426.57 crore compared to Rs 14,289.66 crore. our experts suggest that one can make buy position once it break the resistance of Rs 600.
Q4 Results
For the fourth quarter that ended in March 2023, Star Health and Allied Insurance reported a net profit of Rs. 102 crore on Friday.
The independent health insurance reported an 82 rupee deficit for the January-March fiscal quarter.
According to a regulatory filing, the insurer’s gross written premium (GWP) for the quarter increased from Rs 3,689 crore to Rs 4,199 crore.
From Rs 14,289.66 crore to Rs 19,426.57 crore, net premium income grew.
Profit after tax (PAT) for the entire fiscal year 2022–2023 was Rs 619 crore compared to a loss of Rs 1,041 crore in FY22.
“During the year ended March 31, 2023, the company pursuant to the approval received from the Insurance Regulatory and Development Authority of India (Irdai) has exercised Call Option and redeemed the Subordinated debenture in full on September 6, 2022, and October 29, 2022, amounting to Rs 200 crore and Rs 50 crore, respectively, including interest thereon,” the insurance company stated.
The corresponding debenture redemption reserve amounting to Rs 15 crore has been reversed and credited to the profit and loss account, it added.
The board appointed Anand Roy as the Chief Executive Officer and Managing Director of the company.
Let us look at the Fundamentals
Profit & Loss
Figures in Rs. CroresPRODUCT SEGMENTS
Mar 2015
Mar 2016
Mar 2017
Mar 2018
Mar 2019
Mar 2020
Mar 2021
Mar 2022
Mar 2023
Sales +
1,069
1,595
2,012
2,888
3,775
4,987
5,050
10,602
12,096
Expenses +
1,189
1,439
1,871
2,673
3,565
4,544
6,447
11,962
11,275
Operating Profit
-120
156
141
215
210
443
-1,397
-1,360
821
OPM %
-11%
10%
7%
7%
6%
9%
-28%
-13%
7%
Other Income +
0
0
0
0
0
0
-3
7
6
Interest
1
2
3
20
0
0
0
0
0
Depreciation
19
18
20
23
28
29
46
43
0
Profit before tax
-140
137
118
171
182
413
-1,446
-1,397
826
Tax %
0%
0%
0%
1%
30%
35%
25%
25%
25%
Net Profit
-140
137
118
170
128
268
-1,086
-1,041
619
EPS in Rs
-3.87
3.53
2.59
3.73
2.81
5.46
-19.81
-18.08
10.63
Dividend Payout %
0%
0%
0%
0%
0%
0%
0%
0%
0%
Compounded Sales Growth
10 Years:
%
5 Years:
33%
3 Years:
34%
TTM:
14%
Compounded Profit Growth
10 Years:
%
5 Years:
29%
3 Years:
32%
TTM:
160%
Stock Price CAGR
10 Years:
%
5 Years:
%
3 Years:
%
1 Year:
-17%
Return on Equity
10 Years:
%
5 Years:
-8%
3 Years:
-12%
Last Year:
11%
Balance Sheet
Figures in Rs. CroresCORPORATE ACTIONS
Mar 2015
Mar 2016
Mar 2017
Mar 2018
Mar 2019
Mar 2020
Mar 2021
Mar 2022
Mar 2023
Share Capital +
362
387
456
456
456
491
548
576
582
Reserves
-220
-27
334
504
773
1,153
2,947
4,045
6,007
Borrowings +
0
0
0
250
250
250
250
720
470
Other Liabilities +
954
1,012
1,423
2,138
3,394
4,233
6,756
8,173
9,299
Total Liabilities
1,096
1,372
2,213
3,347
4,872
6,127
10,501
13,514
16,358
Fixed Assets +
46
62
77
92
85
90
183
243
111
CWIP
12
3
7
5
13
12
19
4
0
Investments
502
807
1,428
2,165
3,030
4,290
6,733
11,243
13,392
Other Assets +
535
500
700
1,085
1,744
1,735
3,565
2,023
2,854
Total Assets
1,096
1,372
2,213
3,347
4,872
6,127
10,501
13,514
16,358
Disclaimer : The information mentioned above is merely an opinion and should only be treated for educational purposes. If you have any questions or feedback about this article, you can write us back. To reach out, you can use our contact us page.
When explaining how to become wealthy through stock market investments, seasoned investors have frequently advised trying to hold onto a stock for as long as possible. They encourage a positional investor who wants to profit from stocks to use the “buy, sell, and forget” technique.
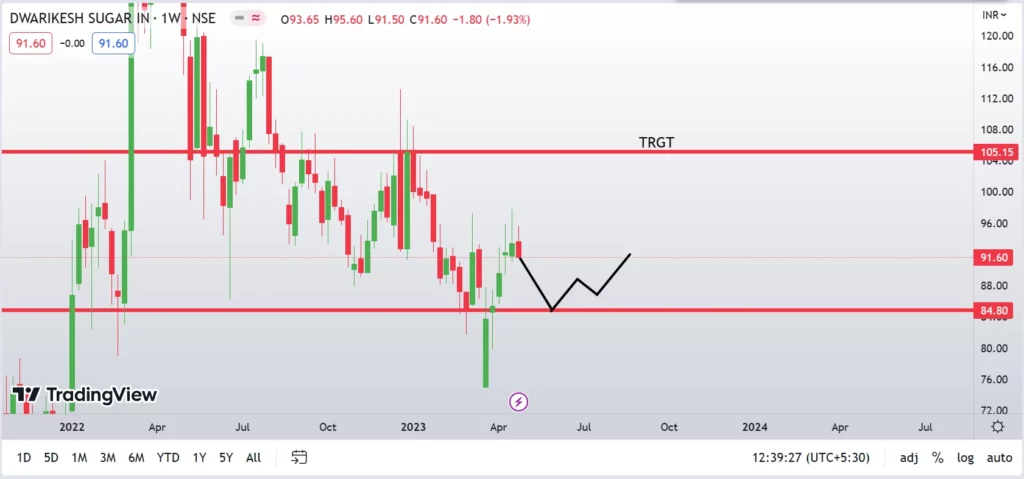
We must examine Dwarikesh Sugar shares in order to comprehend how a long-term investor might profit from their investments. One of the multibagger stocks on the Indian stock market, it increased the value of its stockholders from 1 lakh to 54 lakh during the past ten years.
Despite being under stress for the previous year, the multibagger sugar stock has increased.
Dwarikesh Sugar Industries’ stock has been in base-building mode for the past year, but it was one of the stocks that experienced a notable resurgence during the post-Covid stock market recovery.
Dwarikesh Sugar Share is one of the multibagger stocks that the Indian stock market has generated in recent years, and it has a history of providing exceptional returns to its shareholders. This multibagger sugar stock has increased from about $1.70 to $92 per share over the past ten years, giving its stockholders a return of more than 5,300%.
Let us look at the Fundamentals
Profit & Loss
Standalone Figures in Rs. Crores / View ConsolidatedPRODUCT SEGMENTS
Sep 2011
Sep 2012
Sep 2013
Mar 2015
Mar 2016
Mar 2017
Mar 2018
Mar 2019
Mar 2020
Mar 2021
Mar 2022
Mar 2023
Sales +
593
699
928
1,128
794
1,190
1,430
1,084
1,336
1,839
1,974
2,103
Expenses +
519
605
869
1,043
686
917
1,287
955
1,200
1,638
1,683
1,888
Operating Profit
75
94
59
86
108
273
142
129
136
201
291
215
OPM %
13%
13%
6%
8%
14%
23%
10%
12%
10%
11%
15%
10%
Other Income +
0
2
13
10
13
18
17
36
5
7
3
14
Interest
60
79
71
75
52
52
25
21
33
48
32
26
Depreciation
33
33
33
47
31
30
32
33
37
41
44
50
Profit before tax
-18
-16
-32
-27
39
209
102
111
72
120
219
152
Tax %
26%
28%
39%
37%
1%
25%
1%
14%
-3%
24%
29%
31%
Net Profit
-13
-11
-19
-17
39
156
101
95
73
92
155
105
EPS in Rs
-0.81
-0.69
-1.19
-1.03
2.39
8.29
5.39
5.05
3.90
4.86
8.24
5.57
Dividend Payout %
0%
0%
0%
0%
0%
12%
0%
20%
26%
26%
24%
36%
Compounded Sales Growth
10 Years:
12%
5 Years:
8%
3 Years:
16%
TTM:
7%
Compounded Profit Growth
10 Years:
27%
5 Years:
1%
3 Years:
13%
TTM:
-32%
Stock Price CAGR
10 Years:
41%
5 Years:
29%
3 Years:
71%
1 Year:
-28%
Return on Equity
10 Years:
21%
5 Years:
19%
3 Years:
19%
Last Year:
15%
Balance Sheet
Standalone Figures in Rs. Crores / View ConsolidatedCORPORATE ACTIONS
Sep 2011
Sep 2012
Sep 2013
Mar 2015
Mar 2016
Mar 2017
Mar 2018
Mar 2019
Mar 2020
Mar 2021
Mar 2022
Mar 2023
Share Capital +
32
32
47
47
47
19
19
19
19
19
19
19
Reserves
104
103
73
56
70
267
347
445
465
560
654
721
Borrowings +
467
525
392
624
656
533
342
656
846
609
524
375
Other Liabilities +
66
108
179
302
260
200
276
246
279
257
222
166
Total Liabilities
653
752
660
999
1,001
1,019
984
1,365
1,609
1,445
1,420
1,280
Fixed Assets +
496
470
440
399
356
331
341
319
430
410
388
582
CWIP
5
0
0
0
0
1
0
16
2
1
142
0
Investments
0
0
0
0
0
0
0
0
0
0
0
0
Other Assets +
153
282
220
600
644
687
642
1,029
1,177
1,035
889
697
Total Assets
653
752
660
999
1,001
1,019
984
1,365
1,609
1,445
1,420
1,280
Disclaimer : The information mentioned above is merely an opinion and should only be treated for educational purposes. If you have any questions or feedback about this article, you can write us back. To reach out, you can use our contact us page.
President Joe Biden said on Tuesday that he will run for re-election in 2024, a move that will determine whether Americans are willing to elect the 80-year-old Democrat, who is already the country’s oldest president, to another four years in office.
In a professionally prepared video distributed by his new campaign team, Biden made his declaration and stated that it is his responsibility to defend American democracy. Images from the attack on the U.S. Capitol by supporters of former President Donald Trump on January 6, 2021, are shown at the beginning.
We are still engaged in a struggle for America’s soul, Biden claimed in his 2004 presidential campaign. “Now is not the time for complacency. I’m running for reelection because of this.
“Let’s finish this job. I know we can,” he said.
Biden called the Republican programmes “threats to American freedom” and vowed to battle efforts to restrict access to healthcare for women, slash Social Security, and outlaw books, all the while denouncing “MAGA extremists.” MAGA is for Trump’s “Make America Great Again” campaign slogan; Biden’s Republican opponent in the November 2024 election may very well be him.
In the two years since he took over from Trump, Biden won Congress’ approval for billions of dollars in federal funds to tackle the COVID-19 pandemic and for new infrastructure, and oversaw the lowest levels of unemployment since 1969, although a 40-year high in inflation has marred his economic record.
Biden’s age makes his re-election bid a historic and risky gamble for the Democratic Party, which faces a tough election map to hold the Senate in 2024 and is the minority in the House of Representatives now.
Biden’s approval ratings were stuck at just 39% in a Reuters/Ipsos poll released on April 19 and there are steep concerns about his age among some Americans; he would be 86 by the end of a prospective second term, almost a decade higher than the average U.S. male’s life expectancy.
Doctors declared Biden, who does not drink alcohol and exercises five times a week, “fit for duty” after an examination in February. The White House says his record shows that he is mentally sharp enough for the rigors of the job.
Biden will be joined in his 2024 quest by his running mate, Vice President Kamala Harris.
Disclaimer : The information mentioned above is merely an opinion and should only be treated for educational purposes. If you have any questions or feedback about this article, you can write us back. To reach out, you can use our contact us page.
Candlestick charts are a technical tool that packs data for multiple time frames into single price bars. This makes them more useful than traditional open, high, low, close (OHLC) bars or simple lines that connect the dots of closing prices. Candlesticks build patterns that may predict price direction once completed.
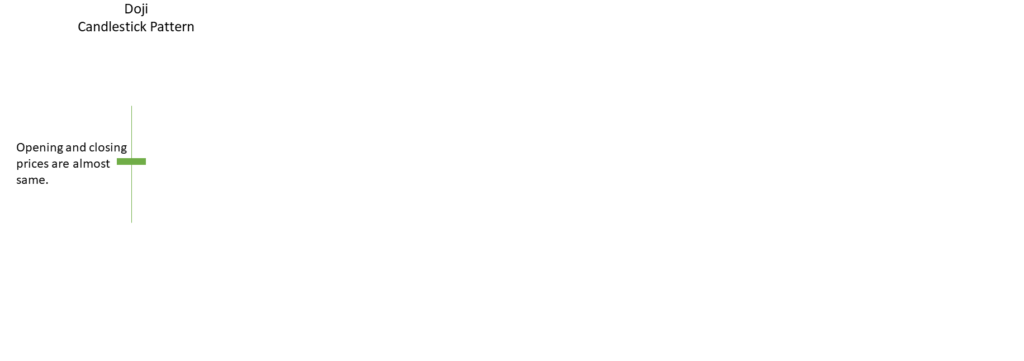
Doji candle
Dojis are a tool used in technical analysis to find patterns in the price of securities. A trading session is known as a “doji” when a security’s open and close are almost equal, like a candlestick on a chart. The Japanese expression “the same thing” is where the word “doji” originates.
Example:
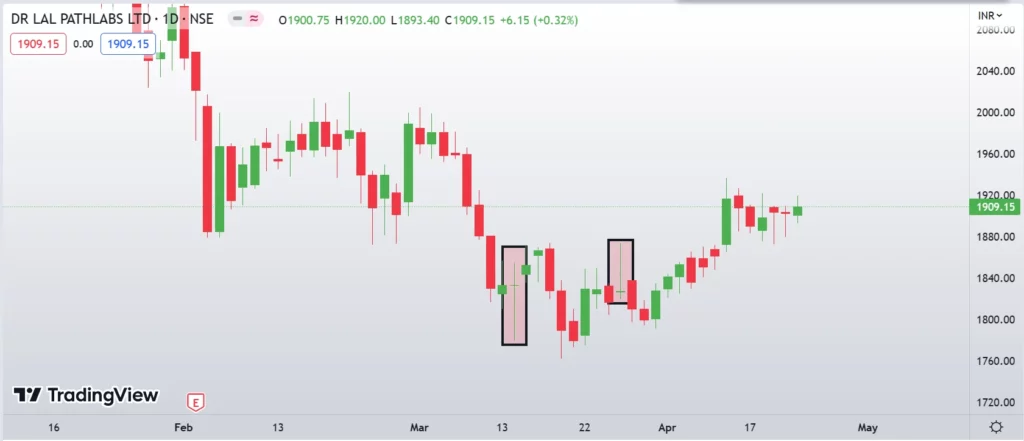
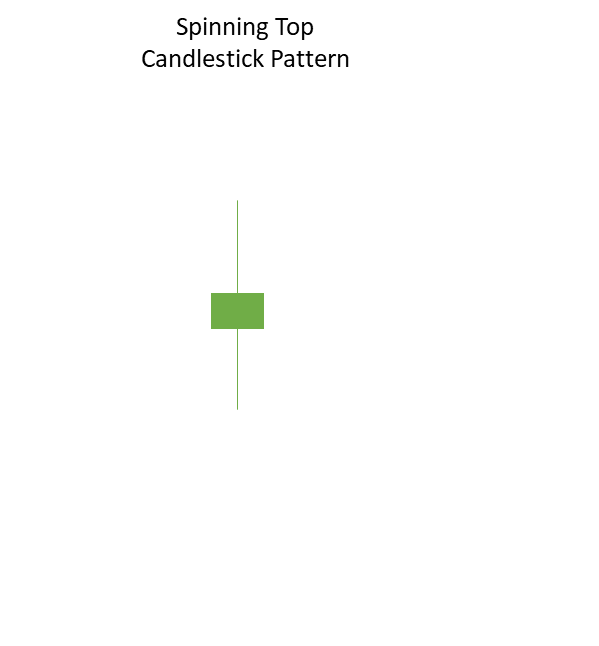
Spinning Top
The spinning top candlestick pattern has the same meaning as the Doji, which stands for market uncertainty.
The true body of a spinning top is larger than a Doji, which is the only structural distinction between the two.
Example:
Disclaimer : The information mentioned above is merely an opinion and should only be treated for educational purposes. If you have any questions or feedback about this article, you can write us back. To reach out, you can use our contact us page.
Being a good trader depends on a variety of elements, one of which is maintaining the proper mindset. Learn how to enhance your trading psychology to lessen the impact of emotions and biases when you are trading.
What is Trading Psychology?
The term “trading psychology” describes a trader’s frame of mind while they are actively trading. It might decide how much of a profit they are able to secure or it can explain why a trader suffered significant losses.
In trading psychology, innate human traits like biases and emotions are crucial. The major goal of studying trade psychology is to increase one’s awareness of the different dangers linked to bad psychological traits and to cultivate more positive traits. Trading psychology experts typically do not operate out of bias or emotion. Therefore, they have a better possibility of making money while trading or, at the very least, of limiting their losses.
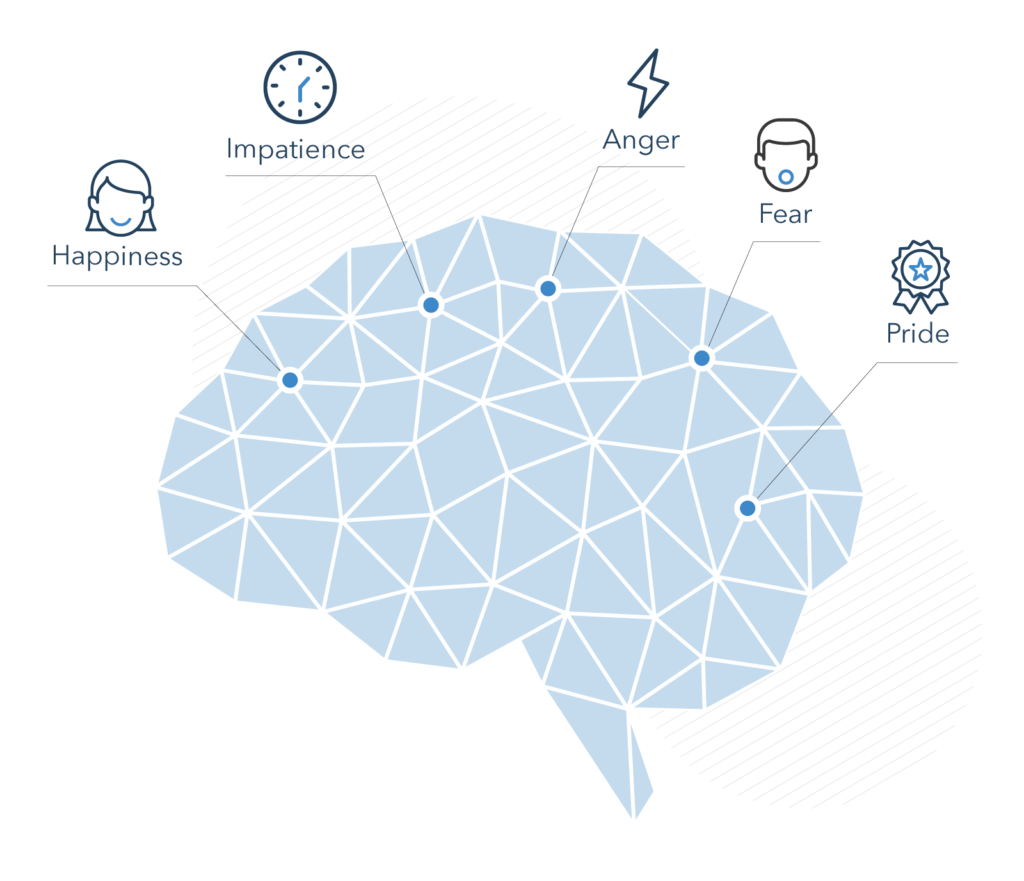
Trading psychology is different for every trader, as it is influenced by each individual’s own emotions and pre-determined biases. Some of the emotions which impact trading are:
Happiness
Impatience
Anger
Fear
Pride
How to improve your Trading Psychology
Knowing your own emotions, prejudices, and personality factors will make it easier for you to improve your trading psychology. Once you are aware of these, you may create a trading strategy that takes them into consideration in an effort to lessen their potential impact on your choice-making.
For instance, if you naturally possess confidence, you can discover that overconfidence and pride impair your ability to make decisions. For instance, instead of taking a slight loss on your trading account, you can choose to let losses accumulate in the hopes that the market will turn around. Greater losses or the eventual demise of your trading account could result from this.
Stops are a means to limit your losses and decide when to close a particular trade before you initiate the position, which can be used to counteract this. By doing this, you have become mindful of your own prejudices and emotions because you have chosen to take action against them rather than acting on them.
How does Bias affect Trading?
Biases have an impact on trade since they are, by definition, a decidedly biased preference for one product over another. They may therefore impair your judgement and drive you to act on instinct rather than logical fundamental or technical analysis, which can make your decision-making difficult when you are trading.
This is because trading bias means that you could be more likely to trade an asset that you have had past success on, or to avoid an asset on which you have incurred a historic loss. It is important that traders are aware of their conscious biases as this can help them overcome them and approach the markets with a more rational and calculated mindset.
There are five main types of bias:
Representative bias means that you will stick to or be more inclined to replicate previously successful trades. You might do this without carrying out analysis for every trade of this type because in the past, it has paid off for you. However, even if two trades seem similar, it is important to approach every trade on its own merits rather than on historical success
Negativity bias makes you more inclined to only look at the negative side of a trade, rather than acknowledging what went right. This could mean that you scrap an entire strategy when, in fact, you might only have needed to tweak it slightly to turn a profit
Status quo bias means that you will continue to use old strategies or trades rather than exploring new ones – you will stick to the status quo. The danger arises when you fail to assess whether those old methods are still viable in the current market
Confirmation bias is when you seek out, or give greater weight to, news and analysis that confirms your pre-formulated ideas. It may also be that you don’t seek out, or disregard, information which disproves your convictions
Gambler’s fallacy is where you assume that because an asset has been increasing, it will continue to rise. There is no reason to believe that it should, similar to how there is no reason that a coin should land tails side up – rather than heads – after doing so a few times in a row.
The ability to recognize your personality traits early on is one of the keys to establishing good trading psychology. You must be completely honest with yourself and acknowledge any impulsive inclinations or a propensity for irrational behavior’s.
If this is the case, it is critical to keep these characteristics in check when you are actively trading as they may drive you to make snap judgements that lack sufficient analytical support. However, it’s also crucial to utilize your unique strengths.
Recognizing your biases, as described above, is just as crucial as recognizing your personality traits and emotions. Although biases are a natural part of human nature, you should be conscious of them before entering or exiting any deals.
2 Develop and follow a trading plan
A trading strategy is essential to helping you reach your objectives. The blueprint for your trading, a trading plan should include your time commitments, available trading capital, risk-to-reward ratio, and a trading method you are at ease with.
For instance, a trading plan might specify that you’ll dedicate an hour to trading every morning and evening and that you won’t risk more than 2% of your portfolio’s entire worth on any one trade. As the guidelines for entering or closing a trade are already stated for you, this can help you minimize losses and limit the impact of emotions on your trading.
Trading plans should also take into account individual factors that could affect your trading discipline such as your emotions, biases and personality traits. If you make clear what your biases are before you start trading, you might be less inclined to act on them.
3 Have patience
It is essential that you have patience with your positions because patience is a fundamental component of discipline. When you make decisions based on emotions like fear, you run the risk of closing a position too soon and losing money. Have faith in your analysis, and practice patience and self-control. Similarly, it is crucial to exercise patience when trying to enter a trade and to do so at the correct time rather than immediately.
For instance, you could want to wait until right before a Bank of England (BoE) announcement if you wanted to speculate on particular GBP currency pairs like EUR/GBP or GBP/USD because there is typically more volatility at this time.
4 Be adaptive
While it is important to have a trading plan, remember that no two days on the markets are the same, and winning streaks don’t exist in trading. With this in mind, you should become comfortable in assessing how the markets are different from day to day and adapt accordingly.
If there is more volatility on one day compared to the day before and the markets are moving particularly unpredictably, you may decide to put your trading activity on hold until you’re sure you understand what is happening. Being adaptive can help to limit your emotions and rule out representative and status quo biases, enabling you to assess each situation on its own merits – ensuring that you are pragmatic during your time on the markets.
5 Take a break after a loss
Sometimes, rather than immediately entering another trade in an effort to make up some of your losses, it is preferable to take a brief break from your trading account to collect your thoughts and compose yourself.
The most successful traders are those that accept losses and use them as teaching experiences. Before returning to their platform, they usually take a few minutes to themselves. During this time, they evaluate what went wrong with that specific trade in the hopes of learning from it so they won’t make the same mistake again.
6 Accept your winnings
Quitting when you’re ahead and taking your winnings is just as crucial as taking a break after a setback. You might feel invincible after a run of victories or one particularly sizable victory, at which point you might move into another position and try to repeat the process.
Since today is “your day” on the markets, you can even initiate a string of fresh positions in the hope that none of them would lose money. Due to this, you can end up taking unwarranted risks or diversifying your portfolio too quickly without first researching each market.
7 Keep a trading log
You can keep track of all your wins and losses, as well as the feelings you had during each trade, by keeping a trading journal. As a result, it represents the conclusion of all the earlier ideas discussed in this essay. You can use it to determine whether or not the decisions you made at any given time were wise ones.
A trading journal can be used, for example, to note the moment you decided to reduce your losses and the final price the asset reached. You can determine if you made the proper choice or not by doing this.
Trading psychology summed up
Trading psychology is all about your mindset during your time on the markets and it can inform an explanation of your profits or losses
It is important for you to be aware of your own weaknesses and biases before entering a position but, equally, it is important that you understand your own strengths
Learn from your wins as much as your losses, but remember that winning streaks don’t exist in trading and that each position should be assessed on its own merits
Knowing when to take a profit or cut a loss can be the difference between a good day and a bad day on the markets
Keep a trading log as a record for you to see what worked, what didn’t work, and whether your decision at the time was correct in hindsight. Use this information to improve your decision making in the future.
Disclaimer : The information mentioned above is merely an opinion and should only be treated for educational purposes. If you have any questions or feedback about this article, you can write us back. To reach out, you can use our contact us page
Candlestick charts are a technical tool that packs data for multiple time frames into single price bars. This makes them more useful than traditional open, high, low, close (OHLC) bars or simple lines that connect the dots of closing prices. Candlesticks build patterns that may predict price direction once completed. Proper color coding adds depth to this colorful technical tool, which dates back to 18th century Japanese rice traders.
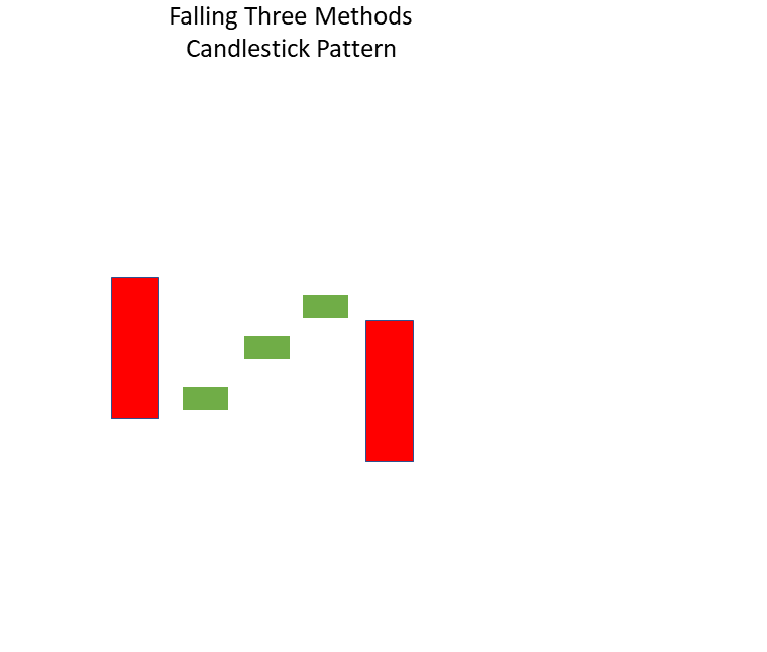
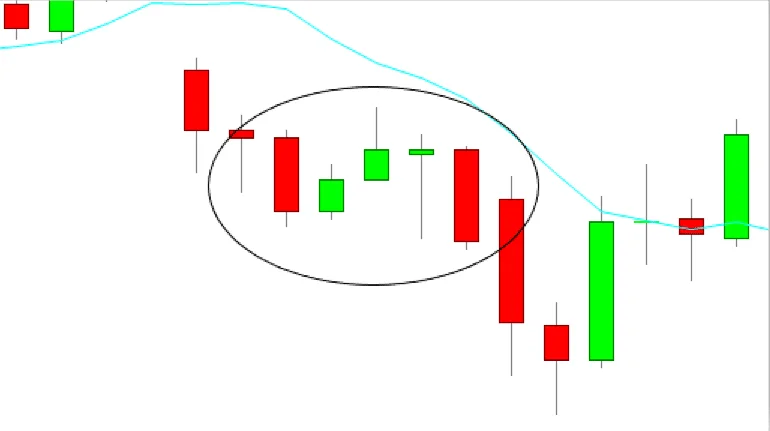
Falling Three Methods
The “falling three methods” is a five-candle bearish continuation pattern that denotes a break in the current downward trend but not a turn around.
The candlestick pattern consists of three shorter counter-trend candlesticks in the Centre and two longer downtrend candlestick charts at the beginning and finish of the pattern.
Example:
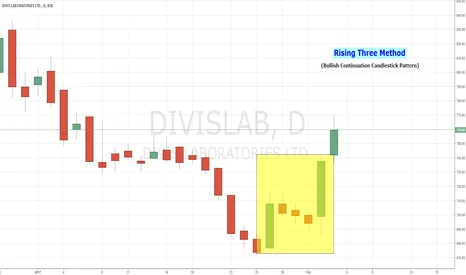
Rising Three Methods:
The “rising three methods” is a bullish, five-candle continuation pattern that denotes a break in the current uptrend without a trend reversal.
Two lengthy candlesticks in the direction of the trend, in this example an uptrend, make up the candlestick pattern. three shorter counter-trend candlesticks in the middle, with two longer candlesticks at the start and end.
Example:
Disclaimer : The information mentioned above is merely an opinion and should only be treated for educational purposes. If you have any questions or feedback about this article, you can write us back. To reach out, you can use our contact us page Support@learningsharks.in
A technical technique known as a candlestick chart condenses data from many time frames into a single price bar. They are therefore more beneficial than conventional open, high, low, close (OHLC) bars or straightforward lines that connect closing price dots. Candlesticks create patterns that, when finished, may be used to forecast price movement.
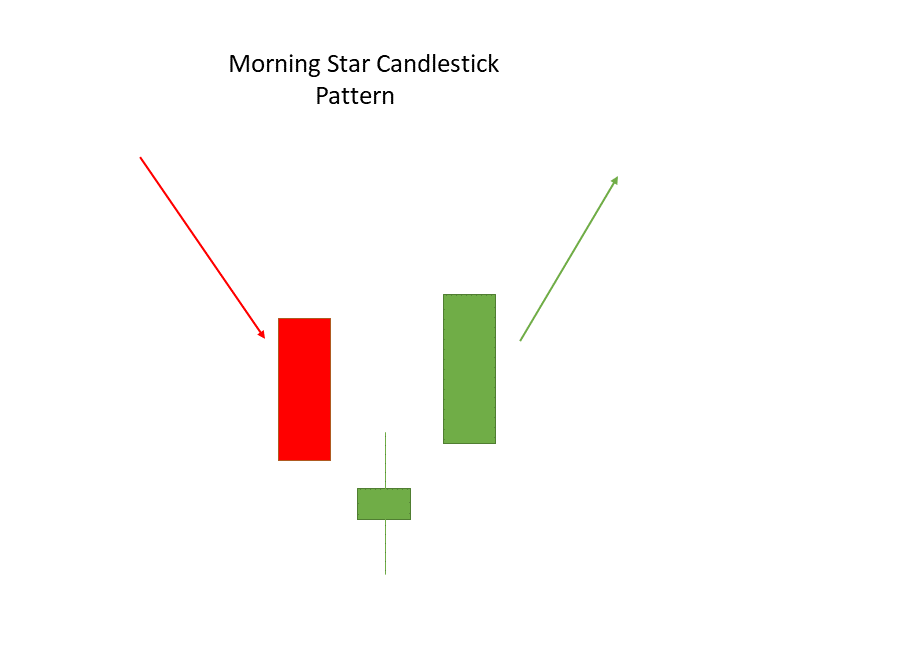
The Morning Star
After a slump, the Morning Star multiple candlestick chart pattern forms, signaling a bullish reversal.
It consists of three candlesticks: a bearish candle in the first, a Doji in the second, and a bullish candle in the third.
The first candle indicates that the downward trend is still in effect. A Doji on the second candle suggests market uncertainty. The market’s bulls are back, and a reversal will occur, according to the third bullish candle.
The true bodies of the first and third candles should be entirely clear of the second candle.
Example:
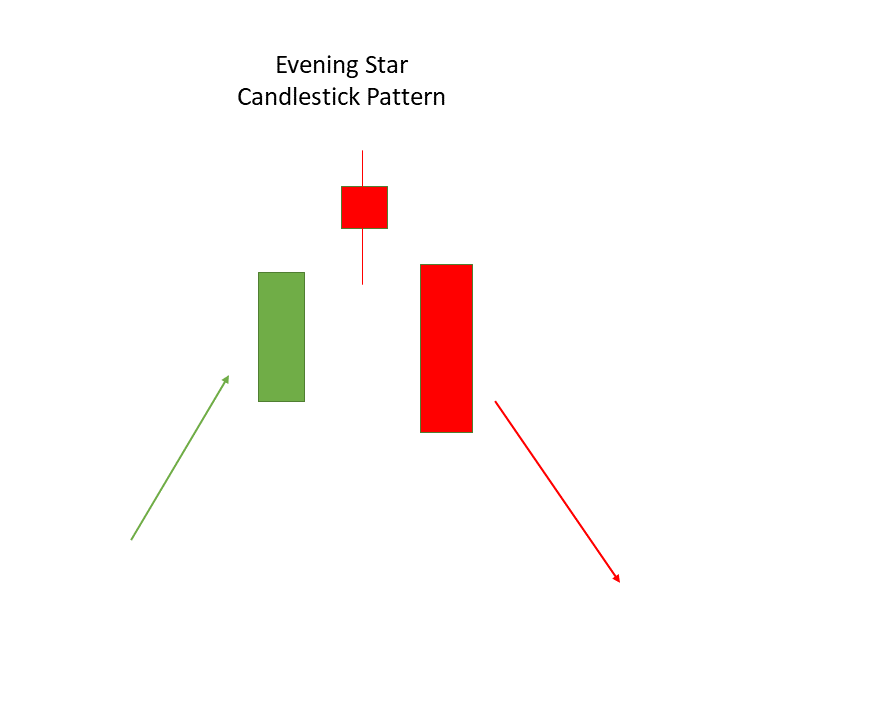
The Evening Star
The numerous candlestick pattern known as the Evening Star is formed after an uptrend and indicates a negative reversal.
It consists of three candlesticks: a bullish candle, a doji candle, and a bearish candle.
The first candle represents the uptrend continuing, the second candle is a Doji and represents market uncertainty, and the third bearish candle represents the return of the bears and the impending reversal.
The true bodies of the first and third candles should be entirely clear of the second candle.
Example:
Disclaimer : The information mentioned above is merely an opinion and should only be treated for educational purposes. If you have any questions or feedback about this article, you can write us back. To reach out, you can use our contact us page.Support@learningsharks.in