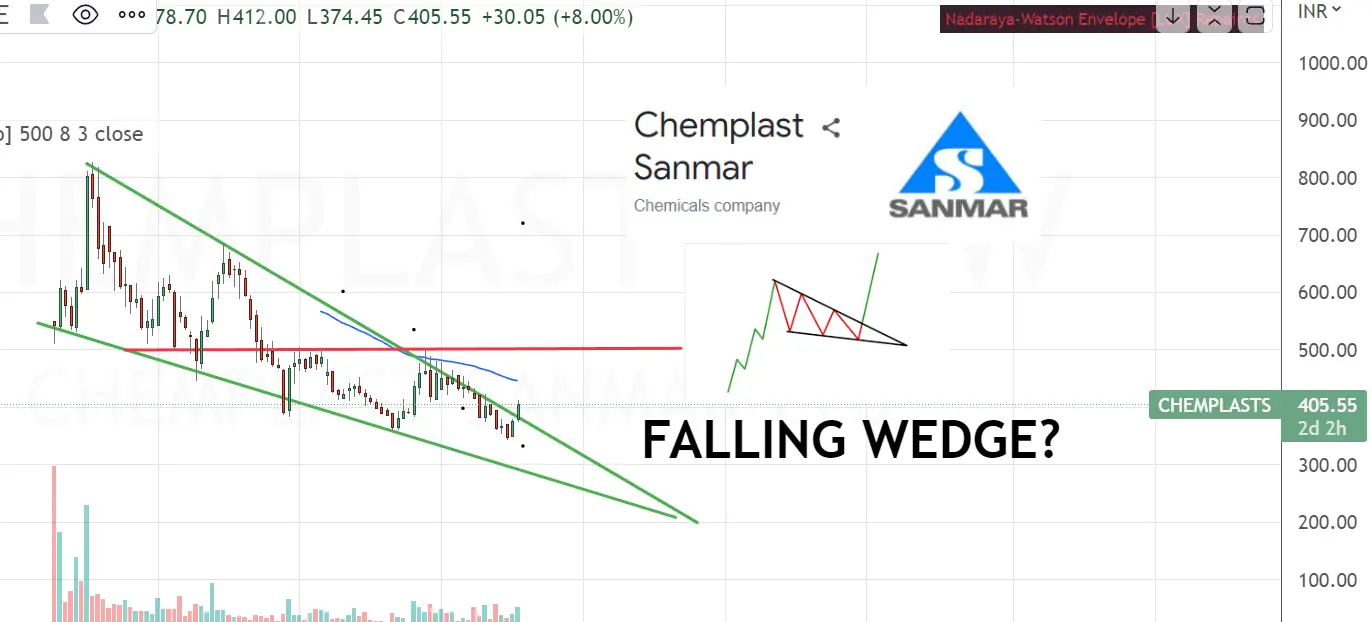
What is a Falling wedge pattern?
When the market makes lower lows and lower highs with a contracting range, a chart pattern arises. It suggests a possible reversal in the trend in the upward direction. That is called a Falling wedge pattern.
What are Technical Analysis Chart patterns?
A chart pattern is a shape within a price chart that helps to predict what prices will do next based on prior performance. Chart patterns are the foundation of technical analysis and necessitate a trader’s understanding of both what they are looking at and what they are looking for.
If you wanna learn about all the chart patterns for free, click here
Chemplast Sanmar Limited is a chemical firm based in India.[1] It is a leading producer of PVC resins, chlorochemicals, and pipe systems.
We recommend this stock at CMP 405, for multiple reasons. The stock has been taking a beating since its IPO listing. Fortunately, the company has been making only a profit, and it’s considered a bright addition to your portfolio.
If you know about support and resistance; you will learn, the stock is on its resistance after multiple attempts of Breaking out.
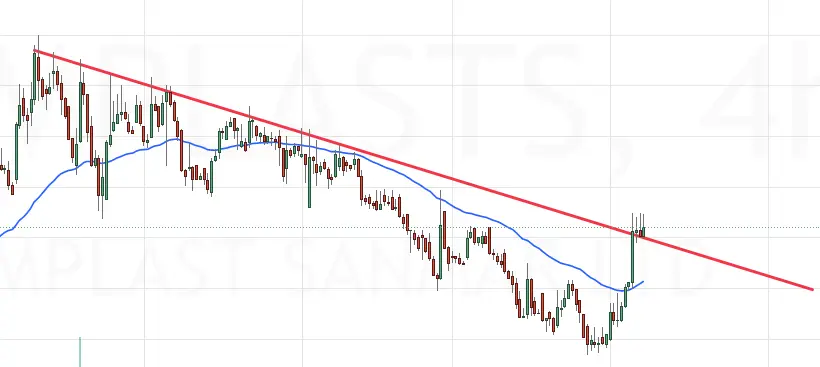
Stock Breaking out of its resistance in the chart above.
Now that you have seen it on the chart along side the Falling wedge pattern. Let’s look at the fundamental side of the Chemplasts Sanmar.
Profit & Loss
Consolidated Figures in Rs. Crores / View StandalonePRODUCT SEGMENTS
| Mar 2019 | Mar 2020 | Mar 2021 | Mar 2022 | TTM | |
|---|---|---|---|---|---|
| Sales + | 1,254 | 1,258 | 3,799 | 5,892 | 5,601 |
| Expenses + | 969 | 1,011 | 3,171 | 4,695 | 4,884 |
| Operating Profit | 286 | 247 | 628 | 1,197 | 717 |
| OPM % | 23% | 20% | 17% | 20% | 13% |
| Other Income + | 12 | 8 | 484 | 57 | -23 |
| Interest | 48 | 95 | 433 | 322 | 151 |
| Depreciation | 56 | 87 | 131 | 137 | 149 |
| Profit before tax | 193 | 72 | 547 | 796 | 395 |
| Tax % | 39% | 36% | 25% | 18% | |
| Net Profit | 118 | 46 | 410 | 649 | 338 |
| EPS in Rs | 14.81 | 6.88 | 30.59 | 41.03 | 21.38 |
| Dividend Payout % | 0% | 0% | 0% | 0% |
| Compounded Sales Growth | |
|---|---|
| 10 Years: | % |
| 5 Years: | % |
| 3 Years: | 67% |
| TTM: | 3% |
| Compounded Profit Growth | |
|---|---|
| 10 Years: | % |
| 5 Years: | % |
| 3 Years: | 75% |
| TTM: | -50% |
| Stock Price CAGR | |
|---|---|
| 10 Years: | % |
| 5 Years: | % |
| 3 Years: | % |
| 1 Year: | -35% |
| Return on Equity | |
|---|---|
| 10 Years: | % |
| 5 Years: | % |
| 3 Years: | 12% |
| Last Year: | 50% |
Balance Sheet
Consolidated Figures in Rs. Crores / View StandaloneCORPORATE ACTIONS
| Mar 2019 | Mar 2020 | Mar 2021 | Mar 2022 | Sep 2022 | |
|---|---|---|---|---|---|
| Share Capital + | 67 | 1,274 | 1,251 | 79 | 79 |
| Reserves | 2,433 | 1,845 | -417 | 1,626 | 1,705 |
| Borrowings + | 253 | 82 | 943 | 882 | 925 |
| Other Liabilities + | 1,049 | 2,113 | 3,893 | 3,014 | 3,101 |
| Total Liabilities | 3,802 | 4,108 | 4,487 | 5,601 | 5,810 |
| Fixed Assets + | 2,108 | 2,174 | 3,148 | 3,259 | 3,211 |
| CWIP | 117 | 8 | 25 | 34 | 73 |
| Investments | 1,159 | 1,458 | 0 | 0 | 0 |
| Other Assets + | 418 | 467 | 1,313 | 2,308 | 2,525 |
| Total Assets | 3,802 | 4,108 | 4,487 | 5,601 | 5,810 |
Conclusion
Now that you have seen the fundamentals and the technicals of this stock. You would see the price CMP 405 is a good price to add on. However, as a Disclaimer, we suggest you do your complete analysis before adding this stock. This is not buying financial advice, but instead merely for education purposes.
If you are new to this page, Don’t forget to check out our courses page.
To contact us, use this link.
#stockmarket #learningsharks #chemplastsanmar #fallingwedge #chartpatterns