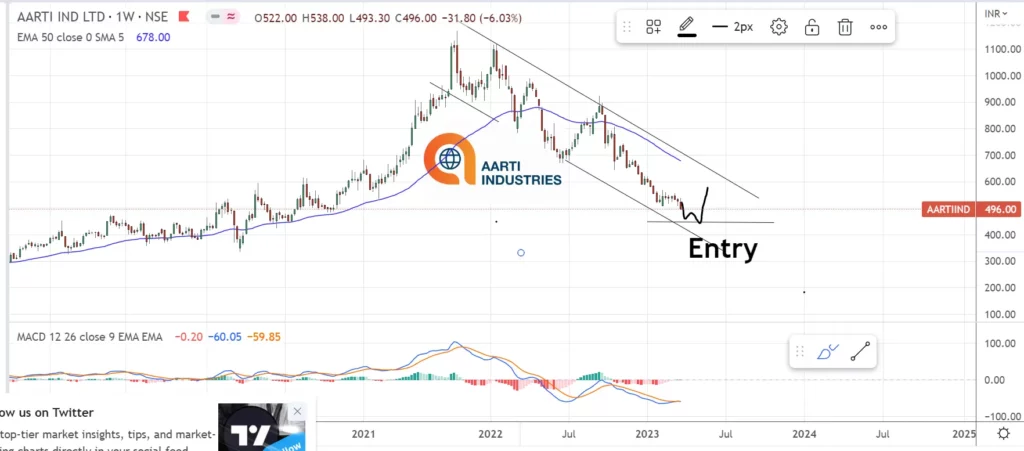
In advanced economies, Aarti industries saw better-than-expected demand trends in the chemical sector. Reduced raw material sourcing risk strengthens the investment case. The company’s reported stable margins are reassuring. As a result, long-term investors should accumulate the stock in stages. #stockmarket #buyingstocks #investment
Lets look at the fundamentals of the stock .
Profit & Loss
Consolidated Figures in Rs. Crores / View StandalonePRODUCT SEGMENTS
Mar 2011
Mar 2012
Mar 2013
Mar 2014
Mar 2015
Mar 2016
Mar 2017
Mar 2018
Mar 2019
Mar 2020
Mar 2021
Mar 2022
TTM
Sales +
1,449
1,667
2,086
2,619
2,890
3,006
3,163
3,806
4,168
4,186
4,506
7,000
6,719
Expenses +
1,251
1,417
1,725
2,217
2,424
2,434
2,509
3,106
3,202
3,209
3,525
5,071
5,542
Operating Profit
198
249
361
402
466
572
654
700
965
977
982
1,929
1,176
OPM %
14%
15%
17%
15%
16%
19%
21%
18%
23%
23%
22%
28%
18%
Other Income +
4
4
4
11
9
6
2
7
2
9
1
1
1
Interest
56
72
95
118
138
117
117
132
183
125
86
114
166
Depreciation
50
55
83
89
82
98
123
146
163
185
231
289
304
Profit before tax
96
126
187
206
255
363
416
429
622
676
665
1,527
707
Tax %
30%
29%
29%
26%
24%
26%
21%
19%
19%
19%
19%
14%
Net Profit
82
104
135
163
208
268
328
346
504
547
535
1,307
590
EPS in Rs
2.66
3.26
4.25
4.58
5.81
7.71
9.62
10.24
14.18
15.39
15.02
36.06
16.28
Dividend Payout %
24%
27%
24%
25%
24%
28%
3%
2%
19%
11%
10%
10%
Compounded Sales Growth
10 Years:
15%
5 Years:
17%
3 Years:
19%
TTM:
15%
Compounded Profit Growth
10 Years:
29%
5 Years:
33%
3 Years:
39%
TTM:
-50%
Stock Price CAGR
10 Years:
40%
5 Years:
16%
3 Years:
16%
1 Year:
-41%
Return on Equity
10 Years:
22%
5 Years:
22%
3 Years:
22%
Last Year:
28%
Profit and loss of aarti Industries 2023
Balance Sheet
Consolidated Figures in Rs. Crores / View StandaloneCORPORATE ACTIONS