Find here the Best Stock Market Books For Beginners-Share market books in Hindi, English and Marathi. On intraday, Technical analysis includes trade like a stock market wizard, a beginner’s guide to the stock market and you can be a stock market genius.
Below are the best stock market books for free download – PDF For beginners.
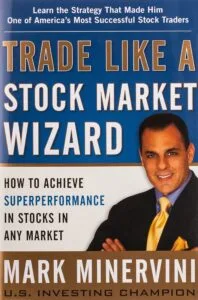
1. Trade like a stock market wizard
To buy this book: Click here
To download the pdf: Click here
BOOK DETAILS :
Author: Mark Minervini
Title: Trade Like a Stock Market Wizard: How to Achieve Super Performance in Stocks in Any Market
Mark Minervini, a stock trader and investment genius who has won the US Investment Championship numerous times, wrote the book “Trade Like a Stock Market Wizard.” The book mostly guides his trading strategies and procedures, which he created during his successful career.
The book covers a wide range of topics, such as market analysis, finding high-potential stocks, risk management, and establishing a trading strategy. Minervini also shares his own experiences and cultural lessons, giving readers valuable insights into the world of stock trading.
2. You Can Be a Stock Market Genius Even if You’re Not Too Smart

To buy this book: Click here
To Download the PDF: Click here
Publisher : Simon & Schuster (1 March 1997)
Language : English
Can you learn how to beat the stock market with a book? After all, billion-dollar portfolio managers can’t do it, and they assume no one can. Business academics not only believe it’s impossible, but they have plenty of facts to back it up. So, why should you invest in this book? Because Joel Greenblatt has been outperforming the stock market (with annual returns over 50%) for over ten years. And now he’s willing to teach you how to do it as well.
In this funny and approachable book, you’ll discover the hidden locations of stock market gains.
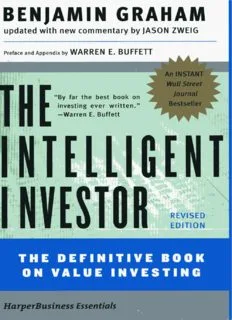
3. The Intelligent Investor – The Definitive Book on Value Investing
To buy this book: Click here
To Download the PDF: Click here
Publisher : Manjul Publishing House; First Edition (13 August 2021); Manjul Publishing House Pvt. Ltd., 2nd Floor, Usha Preet Complex, 42 Malviya Nagar, Bhopal – 462003 – India
Language : Hindi
बेंजामिन ग्राहम (1894-1976), वैल्यू इन्वेस्टिंग के जनक और आज के अनेक सफल व्यवसायियों की प्रेरणा हैं। वे सिक्योरिटी एनालिसिस और द इंटरप्रिटेशन ऑफ़ फ़ाइनेन्शियल स्टेटमेंट्स के लेखक भी हैं। जेसन ज़्वाइग मनी मैगज़ीन के वरिष्ठ लेखक तथा टाइम के अतिथि स्तंभकार, व म्यूज़ियम ऑफ़ अमेरिकन फ़ाइनेन्शियल हिस्ट्री के ट्रस्टी हैं। वे पूर्व में फ़ोर्ब्स के वरिष्ठ संपादक रहे हैं तथा 1987 से निवेश संबंधी लेखन कर रहे हैं।
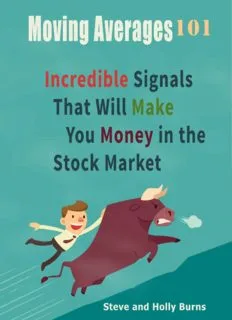
4. Moving Averages 101: Incredible Signals That Will Make You Money in the Stock Market
To buy this book: Click here
To Download the PDF: Click here
Publisher : Stolly Media, LLC (12 July 2015)
Language : English
Take advantage of our 20 years of trading knowledge.
Reduce your odds of trading disaster by learning from someone who has been in the stock market for more than 20 years. Steve will explain moving averages and how to trade them.
Not sure where to begin? Do you have reservations about trading the 200-day moving average? Perhaps you don’t comprehend how to use moving averages in conjunction with other indicators. This book will help you understand trading better.
Understand moving averages This book will help you comprehend the power of moving averages.
- Simple explanations of difficult subjects
- Trading charts that are detailed and annotated
- Gaining access to an active trading community
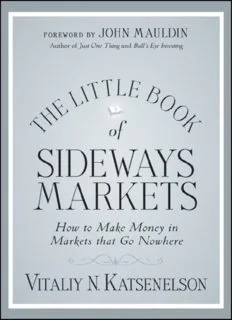
5. The Little Book of Sideways Markets: How to Make Money in Markets that Go Nowhere
To buy this book: Click here
To Download the PDF: Click here
Where does this leave your portfolio as the stock market becomes a roller-coaster ride of all-time highs and stomach-churning lows? You’re basically back where you started in 2000. This is good for Six Flags tourists, but for your retirement, savings, and investments, you’d like to get somewhere.
In The Little Book of Sideways Markets, respected value investor and author Vitaliy Katsenelson teaches you how to survive a market that is neither bull nor bear, but rather what he refers to as a cowardly lion—it exhibits brief bursts of confidence but is finally overpowered by fear.
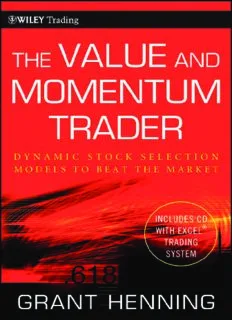
6. The Value and Momentum Trader
To buy this book: Click here
To Download the PDF: Click here
According to Grant Henning, stock market trading may be both highly profitable and severely harmful to your financial health. It is obvious that stock trading is not for everyone, and no one should jump into it without proper preparation. In a volatile stock market, winning stock trading strategies must be constantly refined and adjusted to changing market conditions.
Henning has taken the finest components of each investment technique, including momentum, value, growth, and fundamental and technical analysis, and fine-tuned a trading system based on Excel-based research methodologies he has devised that works in volatile markets. In The Value and Momentum Trader, he unveils his statistical trading strategies and demonstrates how to use them to make winning bets.
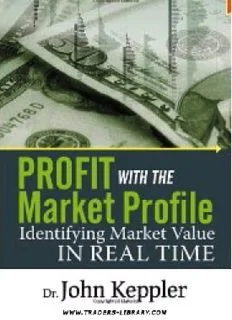
7.Profit with the Market Profile
To buy this book: Click here
To Download the PDF: Click here
Are you ready to change your trading strategy? You may now utilise the Market Profile to enhance standard technical analysis approaches such as support and resistance, chart patterns, and trend lines, rather than relying on lagging and confused indicators placed on charts.
The Market Profile, created in the 1980s by financial specialists at the Chicago Board of Trade, has evolved into one of the most sophisticated analytical tools for traders, investors, and market analysts. AND NOW YOU CAN OWN THE POWER OF THE MARKET PROFILE.
9. Dividends Still Don’t Lie: The Truth About Investing in Blue Chip Stocks and Winning in the Stock Market
To buy this book: Click here
To Download the PDF: Click here
Geraldine Weiss penned the classic Dividends Don’t Lie in 1988. That book described the dividend-value philosophy behind Investment Quality Trends, the highly successful newsletter started by Weiss and now edited by Kelley Wright. More than two decades later, the financial world has altered tremendously due to advances in computer technology and the Internet. Massive volumes of data and information may now be acquired, processed, and analysed in minutes.
What used to take weeks or months in a library can now be completed in one evening with a computer. What hasn’t changed is the dividend-value strategy’s track record of creating regular gains in the stock market. Dividends Still Don’t Lie demonstrates how the stock market continues to reward investors who recognise and value good value.
10. 5 Moving Average Signals That Beat Buy and Hold
To buy this book: Click here
To Download the PDF: Click here
Learn about five winning and time-tested trading techniques that outperform buy-and-hold investments. Steve walks you through the results of 16 years of backtesting on some of the most prominent moving average signals, so you can understand when to enter when to exit, and how to use backtesting to your benefit!
Conclusion
The stock market is not limited to books or theoretical knowledge. Although these new and old books are amazing to learn new topics. we’d still suggest you to learn practically. Here, are the list of courses, we offer.
To see all the books’ pdf pages with over 100+ free books, click Free stock market ebooks
#stockmarketbooks #sharemarketbooks #pdffree #Beginners