Learning sharks-Share Market Institute

To know more about the Stock Market Courses Call Rajouri Garden at 8595071711, Noida 8920210950 or Paschim Vihar at 7827445731 

Pay Your fees Here

Admissions are open for this quarter. Use the link to register for any course Fee Payments

Is Delta Corp a Buy? Gaming and Casino Stock🎮

Share market today

Do you play PUBG? or are you into the gaming industry? Don’t worry, It doesn’t matter if you play or not. However, learning more about technical and fundamental analysis is important if you want to earn in the stock Market. Let’s analyse Delta Corp NSE: 142.25 apiece.

Delta Corp has been in the news for its recent 28% imposed GST on its business. Since then the stock price fell from Rs 242 to 142 Today. Maybe it is time to take a look at this.
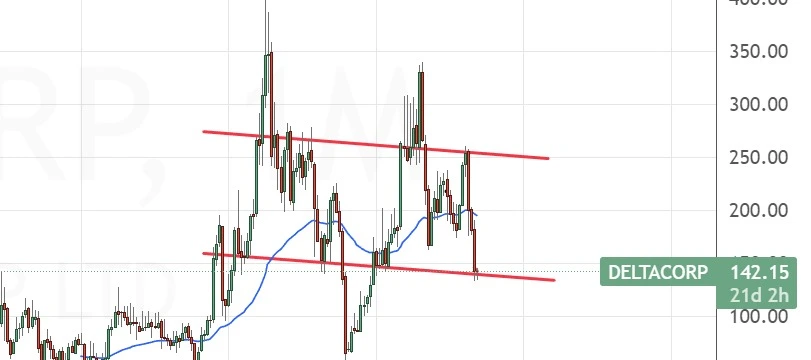
Considerably, the stock seems to be on its support right now, so we could see an upside from here. Few new positions can be made during this time as the company is doing well fundamentally.

If you know a bit about breakout trading, or support and resistance,. You will find this stock trying to break its resistance in a smaller time frame.
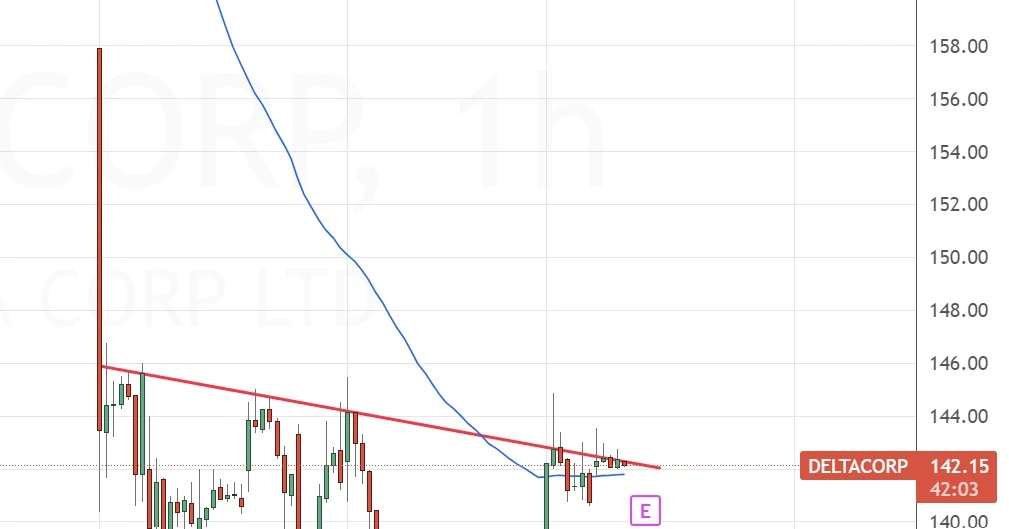
As the stock is getting close to its resistance, It could break. Again, this is just for the educational purposes. If you wanna trade in a stock, you need to learn proper ways to make money.

Let’s look at the fundamentals of the Delta Corp

Profit & Loss

Consolidated Figures in Rs. Crores / View StandalonePRODUCT SEGMENTS

Mar 2012Mar 2013Mar 2014Mar 2015Mar 2016Mar 2017Mar 2018Mar 2019Mar 2020Mar 2021Mar 2022Mar 2023TTM
Sales +3654255593003754556087987734196161,0211,043
Expenses +264330408233244293360482486397477654685
Operating Profit101951516713116124731528822139366359
OPM %28%22%27%22%35%36%41%40%37%5%23%36%34%
Other Income +13131622929353327304655
Interest1115335141351021614162410
Depreciation681735363637384953565960
Profit before tax9685117-175699228311256-1898329344
Tax %30%40%44%-64%36%28%32%37%28%-42%30%20%
Net Profit +674964-283671155196185-2668262273
EPS in Rs2.241.291.55-0.991.663.185.817.266.85-0.902.519.7710.17

Here is the list of courses, that you can go through here

#stockmarket #sharemarket #deltacorp

Understanding Stock Market Indicators: A Comprehensive Guide

Introduction to Stock Market Indicators

A beginner trader may find the stock market confusing, but with the help of stock market indicators, you can make informed decisions about when to buy and sell stocks. This comprehensive guide will teach you about the various types of stock market indicators and how to incorporate them into your trading strategy. To know more about the patterns, click here

  1. Introduction to Stock Market Indicators
  2. Types of Stock Market Indicators
    a. Technical Indicators
    b. Fundamental Indicators
    c. Momentum Indicators
    d. Trend Indicators
  3. How to Use Stock Market Indicators in Your Trading Strategy
  4. Conclusion

Types of Stock Market Indicators

Technical indicators and fundamental indicators are the two main types of stock market indicators.

Technical Indicators: Technical indicators are mathematical calculations based on a security’s price and/or volume. These indicators provide historical performance data and can be used to forecast future price movements. Moving averages, Bollinger Bands, and the Relative Strength Index are examples of technical indicators (RSI).

Fundamental Indicators

Fundamental indicators are economic and financial data, such as earnings, revenue, and the overall health of a company. These indicators provide information about a company’s financial health and are used to make predictions about future performance. Examples of fundamental indicators include the P/E ratio, Debt-to-Equity ratio, and the Price-to-Book ratio.

Momentum Indicators

Momentum indicators measure the rate of change in a security’s price. These indicators help traders identify whether a stock is gaining or losing momentum and can be used to make predictions about future price movements. Examples of momentum indicators include the Moving Average Convergence Divergence (MACD) and the Stochastic Oscillator.

Trend Indicators

Trend indicators measure the direction and strength of a trend. These indicators help traders identify whether a stock is in an uptrend, downtrend, or moving sideways. Examples of trend indicators include the Moving Average and the Trendline.

How to Use Stock Market Indicators in Your Trading Strategy:

  1. Choose the right indicators: Select indicators that align with your investment goals and trading style.
  2. Create a strategy: Develop a strategy that combines different indicators to create a comprehensive approach to trading.
  3. Monitor performance: Keep track of your trades and adjust your strategy as needed based on the performance of your indicators.
  4. Stay patient: Don’t make impulsive decisions based solely on one indicator. Wait for multiple indicators to confirm a trade before making a move.

Conclusion

Stock market indicators can be a valuable tool for traders, but they must be chosen carefully and in conjunction with a comprehensive strategy. You can make informed decisions about when to buy and sell stocks by combining different indicators and monitoring their performance.

Skip to content