If you are waiting for the EV market to boom, then you are just another nature lover. Cars running on petrol have been among us are favorites for ages. Then came the CNG which was another eco-friendly alternative. EV is the next best thing coming on the market. We already have many auto stocks running in the race to be the top EV provider to fuel this ambition.
Here are some of the top stocks in the automotive sector along with their fundamentals. One can find themselves around these companies already striving for the same ambition.
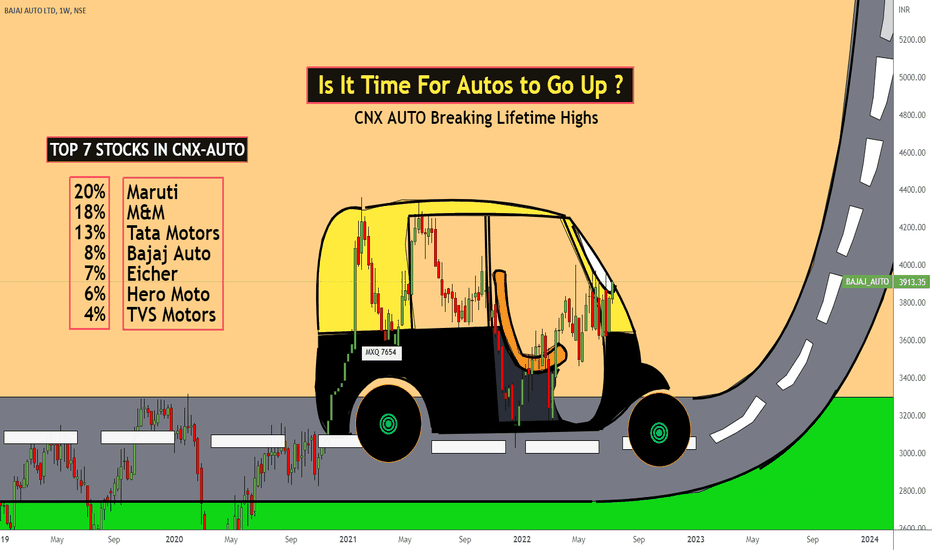
In our list, Here are some of the top stocks, you can invest in and trade in the stock market.
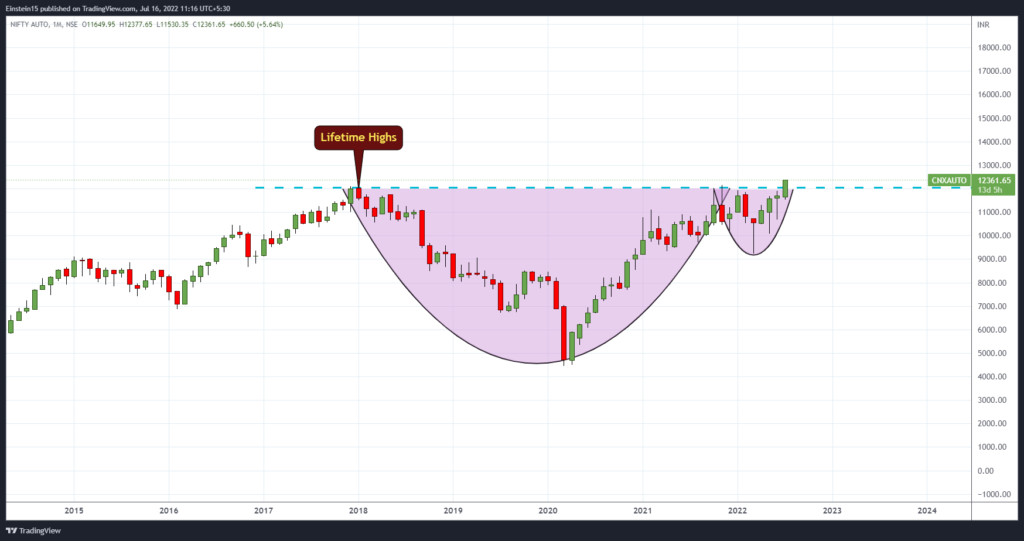
- CNX Auto ( Nifty Auto )
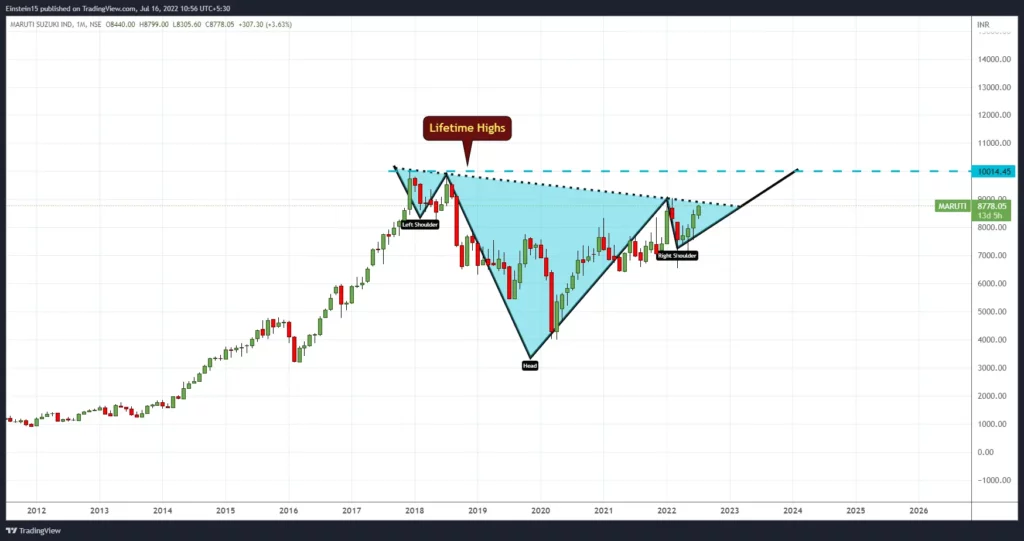
2. Maruti Share price
Balance Sheet
Consolidated Figures in Rs. Crores / View StandaloneCORPORATE ACTIONS
| Mar 2011 | Mar 2012 | Mar 2013 | Mar 2014 | Mar 2015 | Mar 2016 | Mar 2017 | Mar 2018 | Mar 2019 | Mar 2020 | Mar 2021 | Mar 2022 | Sep 2022 | |
|---|---|---|---|---|---|---|---|---|---|---|---|---|---|
| Share Capital + | 144 | 144 | 151 | 151 | 151 | 151 | 151 | 151 | 151 | 151 | 151 | 151 | 151 |
| Reserves | 14,164 | 15,530 | 18,877 | 21,345 | 24,167 | 30,465 | 36,924 | 42,408 | 46,941 | 49,262 | 52,350 | 55,182 | 57,030 |
| Borrowings + | 454 | 1,421 | 1,569 | 2,004 | 666 | 231 | 484 | 121 | 160 | 184 | 541 | 426 | 625 |
| Other Liabilities + | 4,344 | 6,004 | 6,920 | 7,975 | 9,492 | 11,879 | 14,402 | 17,568 | 16,717 | 14,031 | 18,335 | 18,896 | 21,214 |
| Total Liabilities | 19,106 | 23,099 | 27,517 | 31,476 | 34,477 | 42,726 | 51,960 | 60,248 | 63,969 | 63,628 | 71,376 | 74,656 | 79,020 |
| Fixed Assets + | 5,672 | 7,746 | 10,022 | 11,034 | 12,490 | 12,530 | 13,311 | 13,389 | 15,437 | 15,744 | 14,989 | 13,747 | 17,361 |
| CWIP | 879 | 943 | 1,966 | 2,640 | 1,890 | 1,007 | 1,252 | 2,132 | 1,607 | 1,415 | 1,497 | 2,936 | 2,246 |
| Investments | 5,439 | 6,545 | 7,421 | 10,527 | 13,298 | 20,676 | 29,151 | 36,123 | 37,504 | 37,488 | 42,945 | 42,035 | 42,907 |
| Other Assets + | 7,116 | 7,866 | 8,107 | 7,275 | 6,800 | 8,513 | 8,247 | 8,604 | 9,421 | 8,980 | 11,946 | 15,937 | 16,506 |
| Total Assets | 19,106 | 23,099 | 27,517 | 31,476 | 34,477 | 42,726 | 51,960 | 60,248 | 63,969 | 63,628 | 71,376 | 74,656 | 79,020 |
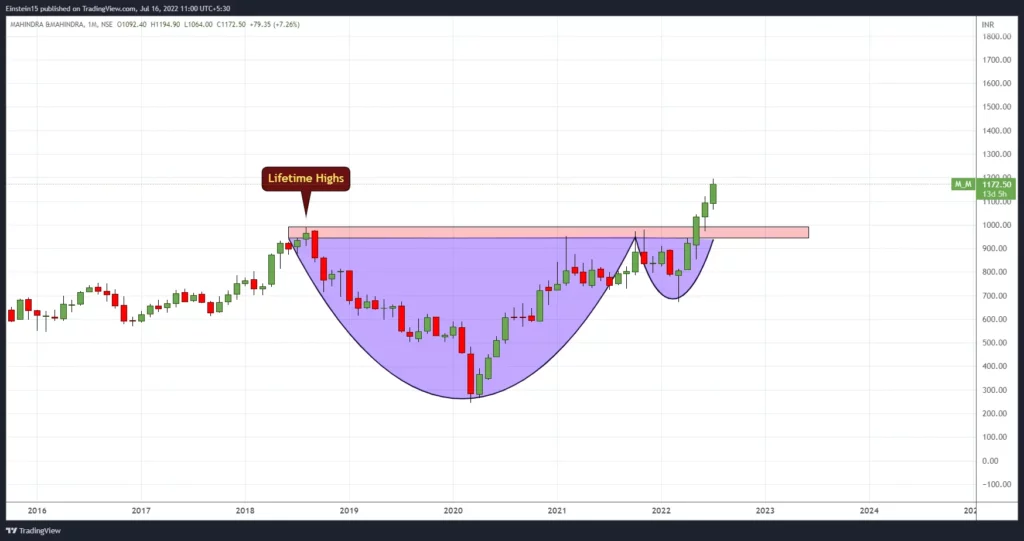
3. M&M Share price
Balance Sheet
Consolidated Figures in Rs. Crores / View StandaloneCORPORATE ACTIONS
| Mar 2011 | Mar 2012 | Mar 2013 | Mar 2014 | Mar 2015 | Mar 2016 | Mar 2017 | Mar 2018 | Mar 2019 | Mar 2020 | Mar 2021 | Mar 2022 | Sep 2022 | |
|---|---|---|---|---|---|---|---|---|---|---|---|---|---|
| Share Capital + | 294 | 295 | 295 | 295 | 296 | 270 | 271 | 543 | 544 | 554 | 555 | 556 | 556 |
| Reserves | 13,990 | 16,409 | 19,666 | 23,012 | 25,561 | 26,222 | 29,467 | 36,232 | 39,439 | 39,415 | 41,027 | 46,567 | 49,956 |
| Borrowings + | 17,047 | 23,121 | 28,711 | 35,167 | 37,911 | 41,553 | 48,762 | 55,898 | 70,848 | 82,092 | 80,625 | 77,605 | 83,273 |
| Other Liabilities + | 19,005 | 23,623 | 27,460 | 29,415 | 30,608 | 31,806 | 35,296 | 43,696 | 51,057 | 43,655 | 42,762 | 47,661 | 58,329 |
| Total Liabilities | 50,337 | 63,448 | 76,131 | 87,889 | 94,376 | 99,852 | 113,835 | 136,369 | 161,889 | 165,716 | 164,968 | 172,388 | 192,115 |
| Fixed Assets + | 14,708 | 17,198 | 18,307 | 18,381 | 19,047 | 20,585 | 20,989 | 26,182 | 28,983 | 29,689 | 21,380 | 26,018 | 27,965 |
| CWIP | 1,408 | 1,488 | 1,631 | 2,191 | 3,032 | 2,371 | 4,279 | 4,269 | 4,760 | 6,856 | 7,873 | 6,703 | 1,720 |
| Investments | 4,714 | 5,347 | 6,440 | 8,082 | 10,027 | 11,603 | 14,662 | 16,018 | 18,268 | 19,210 | 28,778 | 30,060 | 32,272 |
| Other Assets + | 29,506 | 39,414 | 49,752 | 59,234 | 62,270 | 65,293 | 73,905 | 89,900 | 109,878 | 109,960 | 106,938 | 109,607 | 130,157 |
| Total Assets | 50,337 | 63,448 | 76,131 | 87,889 | 94,376 | 99,852 | 113,835 | 136,369 | 161,889 | 165,716 | 164,968 | 172,388 | 192,115 |
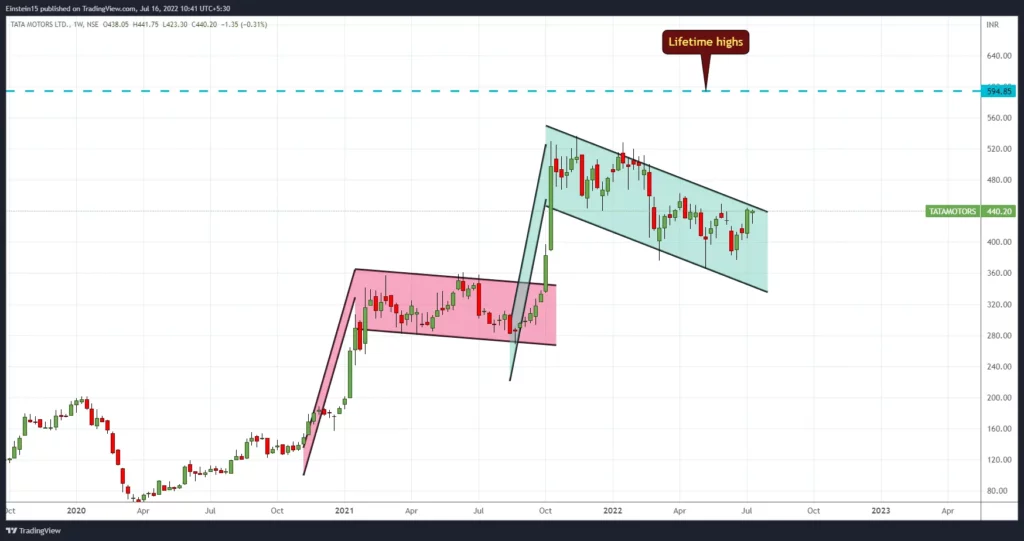
4. Tata Motors Share Price
Balance Sheet
Consolidated Figures in Rs. Crores / View StandaloneCORPORATE ACTIONS
| Mar 2011 | Mar 2012 | Mar 2013 | Mar 2014 | Mar 2015 | Mar 2016 | Mar 2017 | Mar 2018 | Mar 2019 | Mar 2020 | Mar 2021 | Mar 2022 | Sep 2022 | |
|---|---|---|---|---|---|---|---|---|---|---|---|---|---|
| Share Capital + | 635 | 635 | 638 | 644 | 644 | 679 | 679 | 679 | 679 | 720 | 766 | 766 | 766 |
| Reserves | 18,534 | 32,064 | 36,999 | 64,960 | 55,618 | 78,273 | 57,383 | 94,749 | 59,500 | 61,491 | 54,481 | 43,795 | 25,409 |
| Borrowings + | 32,811 | 47,149 | 53,716 | 60,642 | 73,610 | 69,360 | 78,604 | 88,950 | 106,175 | 124,788 | 142,131 | 146,449 | 144,354 |
| Other Liabilities + | 48,403 | 62,919 | 76,977 | 92,180 | 107,442 | 114,872 | 135,914 | 142,813 | 139,349 | 133,181 | 144,193 | 138,051 | 145,111 |
| Total Liabilities | 100,382 | 142,766 | 168,330 | 218,426 | 237,315 | 263,184 | 272,580 | 327,192 | 305,703 | 320,179 | 341,570 | 329,061 | 315,640 |
| Fixed Assets + | 35,349 | 44,360 | 55,512 | 69,092 | 88,479 | 107,232 | 95,944 | 121,414 | 111,234 | 127,107 | 138,708 | 138,855 | 133,965 |
| CWIP | 11,457 | 15,946 | 18,454 | 33,263 | 28,640 | 25,919 | 33,699 | 40,034 | 31,884 | 35,622 | 20,964 | 10,251 | 1,797 |
| Investments | 2,544 | 8,918 | 8,765 | 10,687 | 15,337 | 23,767 | 20,338 | 20,813 | 15,771 | 16,308 | 24,620 | 29,380 | 22,126 |
| Other Assets + | 51,032 | 73,542 | 85,600 | 105,385 | 104,858 | 106,266 | 122,600 | 144,932 | 146,814 | 141,141 | 157,278 | 150,575 | 157,752 |
| Total Assets | 100,382 | 142,766 | 168,330 | 218,426 | 237,315 | 263,184 | 272,580 | 327,192 | 305,703 | 320,179 | 341,570 | 329,061 | 315,640 |
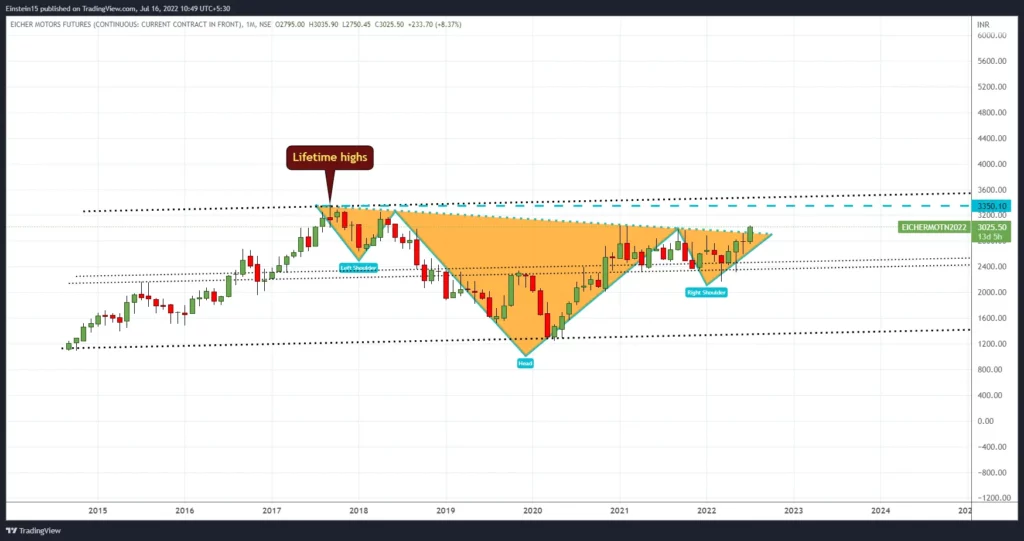
5. Eicher Motor
Balance Sheet
Consolidated Figures in Rs. Crores / View StandaloneCORPORATE ACTIONS
| Dec 2010 | Dec 2011 | Dec 2012 | Dec 2013 | Dec 2014 | Mar 2016 | Mar 2017 | Mar 2018 | Mar 2019 | Mar 2020 | Mar 2021 | Mar 2022 | Sep 2022 | |
|---|---|---|---|---|---|---|---|---|---|---|---|---|---|
| Share Capital + | 27 | 27 | 27 | 27 | 27 | 27 | 27 | 27 | 27 | 27 | 27 | 27 | 27 |
| Reserves | 1,205 | 1,466 | 1,728 | 2,028 | 2,489 | 3,626 | 5,318 | 7,003 | 8,891 | 9,954 | 11,411 | 12,581 | 13,250 |
| Borrowings + | 96 | 43 | 23 | 84 | 58 | 23 | 112 | 151 | 187 | 249 | 219 | 108 | 168 |
| Other Liabilities + | 1,636 | 2,257 | 2,694 | 3,197 | 3,829 | 1,263 | 1,552 | 2,341 | 2,281 | 2,220 | 2,901 | 3,485 | 3,787 |
| Total Liabilities | 2,963 | 3,793 | 4,471 | 5,337 | 6,403 | 4,939 | 7,009 | 9,522 | 11,387 | 12,450 | 14,559 | 16,201 | 17,232 |
| Fixed Assets + | 384 | 504 | 992 | 1,656 | 2,309 | 790 | 873 | 1,502 | 1,875 | 2,378 | 2,433 | 2,424 | 2,902 |
| CWIP | 70 | 352 | 504 | 464 | 419 | 94 | 374 | 333 | 450 | 312 | 314 | 505 | 81 |
| Investments | 459 | 513 | 638 | 825 | 1,078 | 3,388 | 4,987 | 5,581 | 4,923 | 5,749 | 3,902 | 7,721 | 8,954 |
| Other Assets + | 2,050 | 2,424 | 2,337 | 2,391 | 2,597 | 667 | 775 | 2,106 | 4,140 | 4,011 | 7,909 | 5,551 | 5,296 |
| Total Assets | 2,963 | 3,793 | 4,471 | 5,337 | 6,403 | 4,939 | 7,009 | 9,522 | 11,387 | 12,450 | 14,559 | 16,201 | 17,232 |
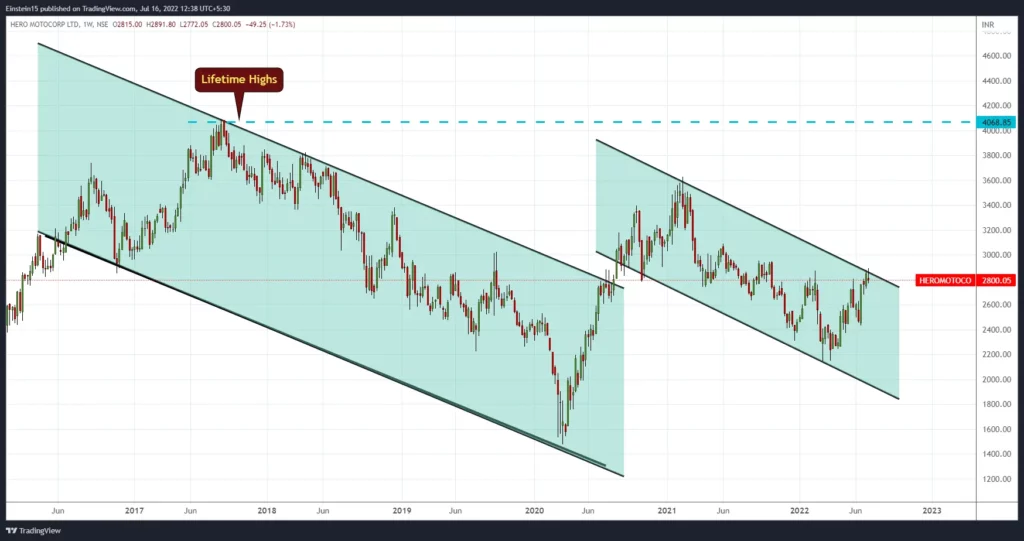
6. Hero motor cop
Balance Sheet
Consolidated Figures in Rs. Crores / View StandaloneCORPORATE ACTIONS
| Mar 2014 | Mar 2015 | Mar 2016 | Mar 2017 | Mar 2018 | Mar 2019 | Mar 2020 | Mar 2021 | Mar 2022 | Sep 2022 | |
|---|---|---|---|---|---|---|---|---|---|---|
| Share Capital + | 40 | 40 | 40 | 40 | 40 | 40 | 40 | 40 | 40 | 40 |
| Reserves | 5,583 | 6,500 | 8,794 | 10,276 | 11,932 | 13,080 | 14,366 | 15,376 | 15,807 | 16,375 |
| Borrowings + | 284 | 100 | 232 | 261 | 228 | 312 | 453 | 584 | 605 | 727 |
| Other Liabilities + | 4,215 | 4,014 | 3,829 | 4,736 | 5,197 | 5,072 | 4,815 | 7,096 | 6,027 | 7,069 |
| Total Liabilities | 10,122 | 10,654 | 12,896 | 15,312 | 17,397 | 18,504 | 19,674 | 23,096 | 22,478 | 24,211 |
| Fixed Assets + | 2,247 | 2,952 | 3,784 | 4,599 | 4,961 | 4,952 | 6,473 | 6,380 | 6,194 | 6,409 |
| CWIP | 855 | 719 | 653 | 581 | 355 | 573 | 391 | 495 | 517 | 171 |
| Investments | 4,106 | 3,118 | 4,501 | 6,066 | 7,669 | 6,114 | 8,359 | 10,582 | 10,528 | 10,033 |
| Other Assets + | 2,914 | 3,864 | 3,958 | 4,066 | 4,411 | 6,865 | 4,451 | 5,639 | 5,240 | 7,598 |
| Total Assets | 10,122 | 10,654 | 12,896 | 15,312 | 17,397 | 18,504 | 19,674 | 23,096 | 22,478 | 24,211 |
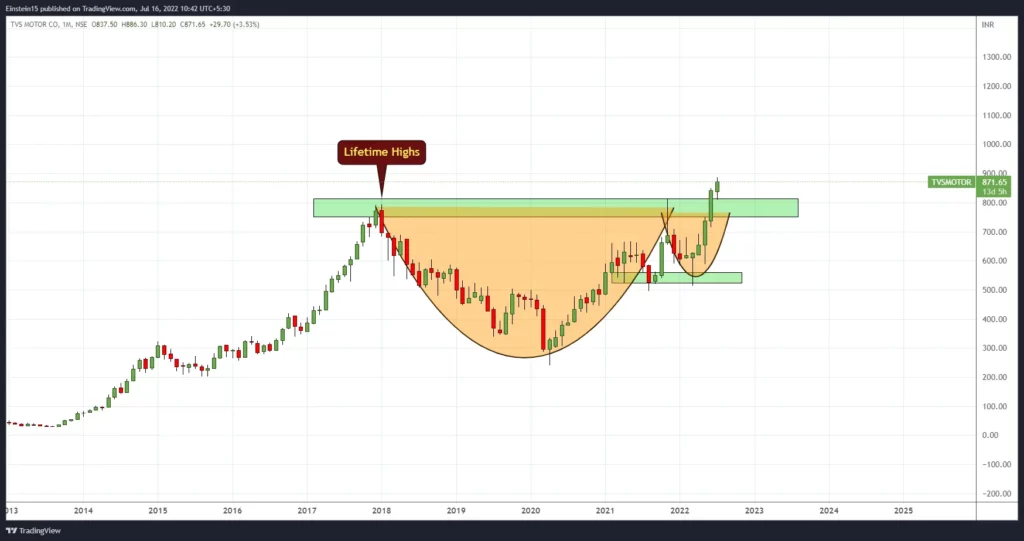
7. TVS MOTOR–>
Balance Sheet
Consolidated Figures in Rs. Crores / View StandaloneCORPORATE ACTIONS
| Mar 2011 | Mar 2012 | Mar 2013 | Mar 2014 | Mar 2015 | Mar 2016 | Mar 2017 | Mar 2018 | Mar 2019 | Mar 2020 | Mar 2021 | Mar 2022 | Sep 2022 | |
|---|---|---|---|---|---|---|---|---|---|---|---|---|---|
| Share Capital + | 48 | 48 | 48 | 48 | 48 | 48 | 48 | 48 | 48 | 48 | 48 | 48 | 48 |
| Reserves | 634 | 675 | 851 | 1,113 | 1,277 | 1,771 | 2,169 | 2,630 | 3,123 | 3,235 | 3,779 | 4,352 | 5,022 |
| Borrowings + | 1,041 | 1,304 | 1,068 | 728 | 1,119 | 1,091 | 1,311 | 6,928 | 9,298 | 11,591 | 12,179 | 15,827 | 18,675 |
| Other Liabilities + | 1,102 | 1,290 | 1,415 | 1,743 | 2,126 | 2,236 | 2,601 | 3,586 | 4,228 | 4,399 | 5,859 | 6,638 | 7,384 |
| Total Liabilities | 2,825 | 3,317 | 3,381 | 3,632 | 4,570 | 5,146 | 6,128 | 13,190 | 16,696 | 19,272 | 21,865 | 26,865 | 31,129 |
| Fixed Assets + | 1,294 | 1,472 | 1,593 | 1,517 | 1,637 | 2,038 | 2,362 | 3,094 | 3,367 | 3,811 | 4,221 | 5,975 | 5,447 |
| CWIP | 58 | 186 | 36 | 48 | 93 | 47 | 64 | 313 | 745 | 1,006 | 1,041 | 552 | 245 |
| Investments | 221 | 318 | 348 | 439 | 539 | 943 | 1,155 | 421 | 440 | 371 | 468 | 605 | 766 |
| Other Assets + | 1,252 | 1,340 | 1,404 | 1,628 | 2,301 | 2,118 | 2,547 | 9,362 | 12,145 | 14,085 | 16,135 | 19,734 | 24,670 |
| Total Assets | 2,825 | 3,317 | 3,381 | 3,632 | 4,570 | 5,146 | 6,128 | 13,190 | 16,696 | 19,272 | 21,865 | 26,865 | 31,129 |
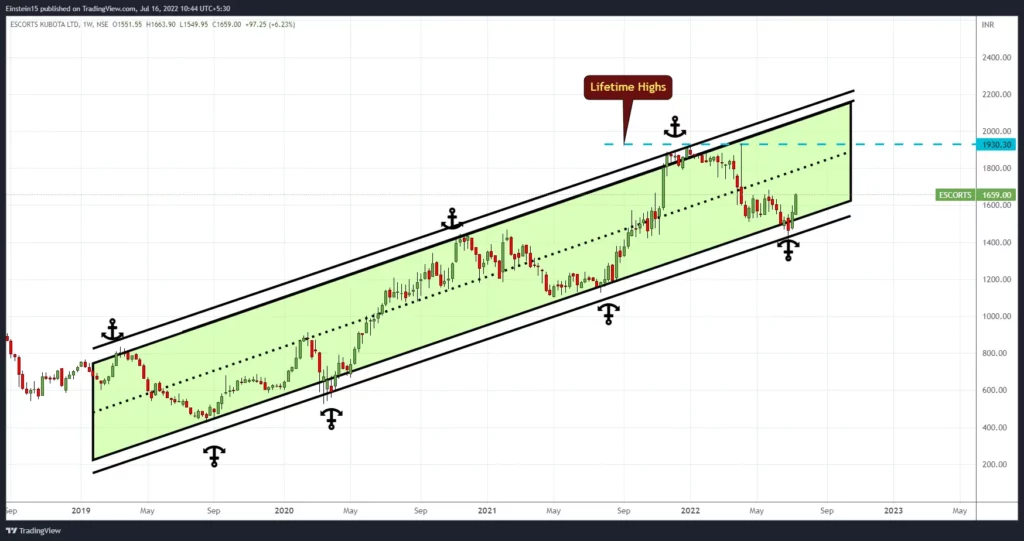
8. Escort’s Share price
Balance Sheet
Consolidated Figures in Rs. Crores / View StandaloneCORPORATE ACTIONS
| Mar 2016 | Mar 2017 | Mar 2018 | Mar 2019 | Mar 2020 | Mar 2021 | Mar 2022 | Sep 2022 | |
|---|---|---|---|---|---|---|---|---|
| Share Capital + | 0 | 19 | 19 | 19 | 19 | 19 | 19 | 19 |
| Reserves | -0 | 1,169 | 1,254 | 1,457 | 1,715 | 2,293 | 3,052 | 3,426 |
| Borrowings + | 0 | 851 | 776 | 611 | 414 | 1,972 | 871 | 912 |
| Other Liabilities + | 0 | 1,097 | 1,263 | 1,263 | 932 | 4,349 | 4,939 | 5,377 |
| Total Liabilities | 0 | 3,135 | 3,312 | 3,349 | 3,080 | 8,634 | 8,881 | 9,734 |
| Fixed Assets + | 0 | 1,306 | 1,358 | 1,429 | 1,515 | 3,426 | 3,324 | 3,408 |
| CWIP | 0 | 34 | 90 | 69 | 58 | 152 | 128 | 127 |
| Investments | 0 | 202 | 134 | 132 | 186 | 369 | 542 | 351 |
| Other Assets + | 0 | 1,593 | 1,730 | 1,719 | 1,321 | 4,687 | 4,887 | 5,848 |
| Total Assets | 0 | 3,135 | 3,312 | 3,349 | 3,080 | 8,634 | 8,881 | 9,734 |
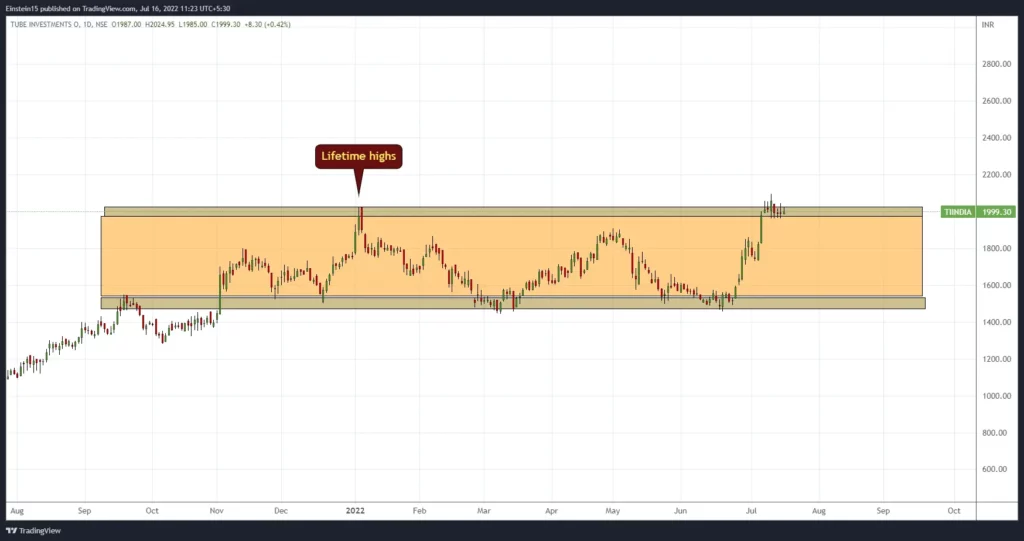
9. TUBE INVESTMENTs–>
Balance Sheet
Consolidated Figures in Rs. Crores / View StandaloneCORPORATE ACTIONS
| Mar 2016 | Mar 2017 | Mar 2018 | Mar 2019 | Mar 2020 | Mar 2021 | Mar 2022 | Sep 2022 | |
|---|---|---|---|---|---|---|---|---|
| Share Capital + | 0 | 19 | 19 | 19 | 19 | 19 | 19 | 19 |
| Reserves | -0 | 1,169 | 1,254 | 1,457 | 1,715 | 2,293 | 3,052 | 3,426 |
| Borrowings + | 0 | 851 | 776 | 611 | 414 | 1,972 | 871 | 912 |
| Other Liabilities + | 0 | 1,097 | 1,263 | 1,263 | 932 | 4,349 | 4,939 | 5,377 |
| Total Liabilities | 0 | 3,135 | 3,312 | 3,349 | 3,080 | 8,634 | 8,881 | 9,734 |
| Fixed Assets + | 0 | 1,306 | 1,358 | 1,429 | 1,515 | 3,426 | 3,324 | 3,408 |
| CWIP | 0 | 34 | 90 | 69 | 58 | 152 | 128 | 127 |
| Investments | 0 | 202 | 134 | 132 | 186 | 369 | 542 | 351 |
| Other Assets + | 0 | 1,593 | 1,730 | 1,719 | 1,321 | 4,687 | 4,887 | 5,848 |
| Total Assets | 0 | 3,135 | 3,312 | 3,349 | 3,080 | 8,634 | 8,881 | 9,734 |
If you wanna learn how to invest in the stock market, click here for the courses.