
Name of the Student: Kabier ( Kabeer) Bajaj
Student ID: LS109CE22
Academic Year: 2022-2023
Name of the course: Stock Market Crash course
Mentor: Vijay Verma
Result: Passed
Course Status: Completed.
Learning sharks-Share Market Institute

Incorporated in 2003, Sula Vineyards Limited is India’s largest wine producer and seller as of March 31, 2022. The company also distributes wines under a bouquet of popular brands including “RASA,” “Dindori”, “The source,” “Satori”, “Madera” & “Dia” with its flagship brand “Sula” being the “category creator” of wine in India.
The company’s business is broadly classified under two categories (i) the production of wine, the import of wines and spirits, and the distribution of wines and spirits (the “Wine Business”); and (ii) the sale of services from ownership and operation of wine tourism venues, including vineyard resorts and tasting rooms (the “Wine Tourism Business“)
Currently, the company produces 56 different labels of wine at four owned and two leased production facilities located in the Indian states of Maharashtra and Karnataka.
Sula Vineyards shares make tepid market debut; share lists at 1.2% and is now trading -7.59% in Nse/BSE. The CMP of this share is 329.
Let’s look at the fundamentals of this stock.
Standalone Figures in Rs. Crores / View Consolidated
| Mar 2018 | Mar 2019 | Mar 2020 | Mar 2021 | Mar 2022 | |
|---|---|---|---|---|---|
| Sales + | 418 | 501 | 387 | 306 | 390 |
| Expenses + | 361 | 423 | 333 | 249 | 283 |
| Operating Profit | 58 | 78 | 54 | 57 | 107 |
| OPM % | 14% | 16% | 14% | 19% | 27% |
| Other Income + | 3 | 3 | 0 | 0 | 3 |
| Interest | 17 | 24 | 31 | 32 | 21 |
| Depreciation | 15 | 19 | 34 | 25 | 22 |
| Profit before tax | 29 | 38 | -12 | -0 | 66 |
| Tax % | 35% | 49% | 32% | -130% | 26% |
| Net Profit | 19 | 20 | -8 | -1 | 49 |
| EPS in Rs | 12.59 | 13.07 | -5.42 | -0.42 | 32.34 |
| Dividend Payout % | 0% | 0% | 0% | 0% | 0% |
Standalone Figures in Rs. Crores / View ConsolidatedCORPORATE ACTIONS
| Mar 2018 | Mar 2019 | Mar 2020 | Mar 2021 | Mar 2022 | |
|---|---|---|---|---|---|
| Share Capital + | 15 | 15 | 15 | 15 | 16 |
| Reserves | 310 | 328 | 311 | 312 | 399 |
| Borrowings + | 220 | 275 | 357 | 310 | 226 |
| Other Liabilities + | 130 | 143 | 160 | 110 | 116 |
| Total Liabilities | 674 | 761 | 843 | 747 | 757 |
| Fixed Assets + | 276 | 317 | 349 | 318 | 342 |
| CWIP | 1 | 2 | 0 | 0 | 1 |
| Investments | 21 | 26 | 26 | 21 | 27 |
| Other Assets + | 376 | 417 | 468 | 409 | 387 |
| Total Assets | 674 | 761 | 843 | 747 | 757 |
The company seems to be an excellent addition to your current portfolio. Considering the current market scenario, Sula vineyards may face resistance and take time to break. However, for the next 6 months, this price can touch up to 500 apiece.
#stockmarket #sharemarket #sulavineyards #ipo
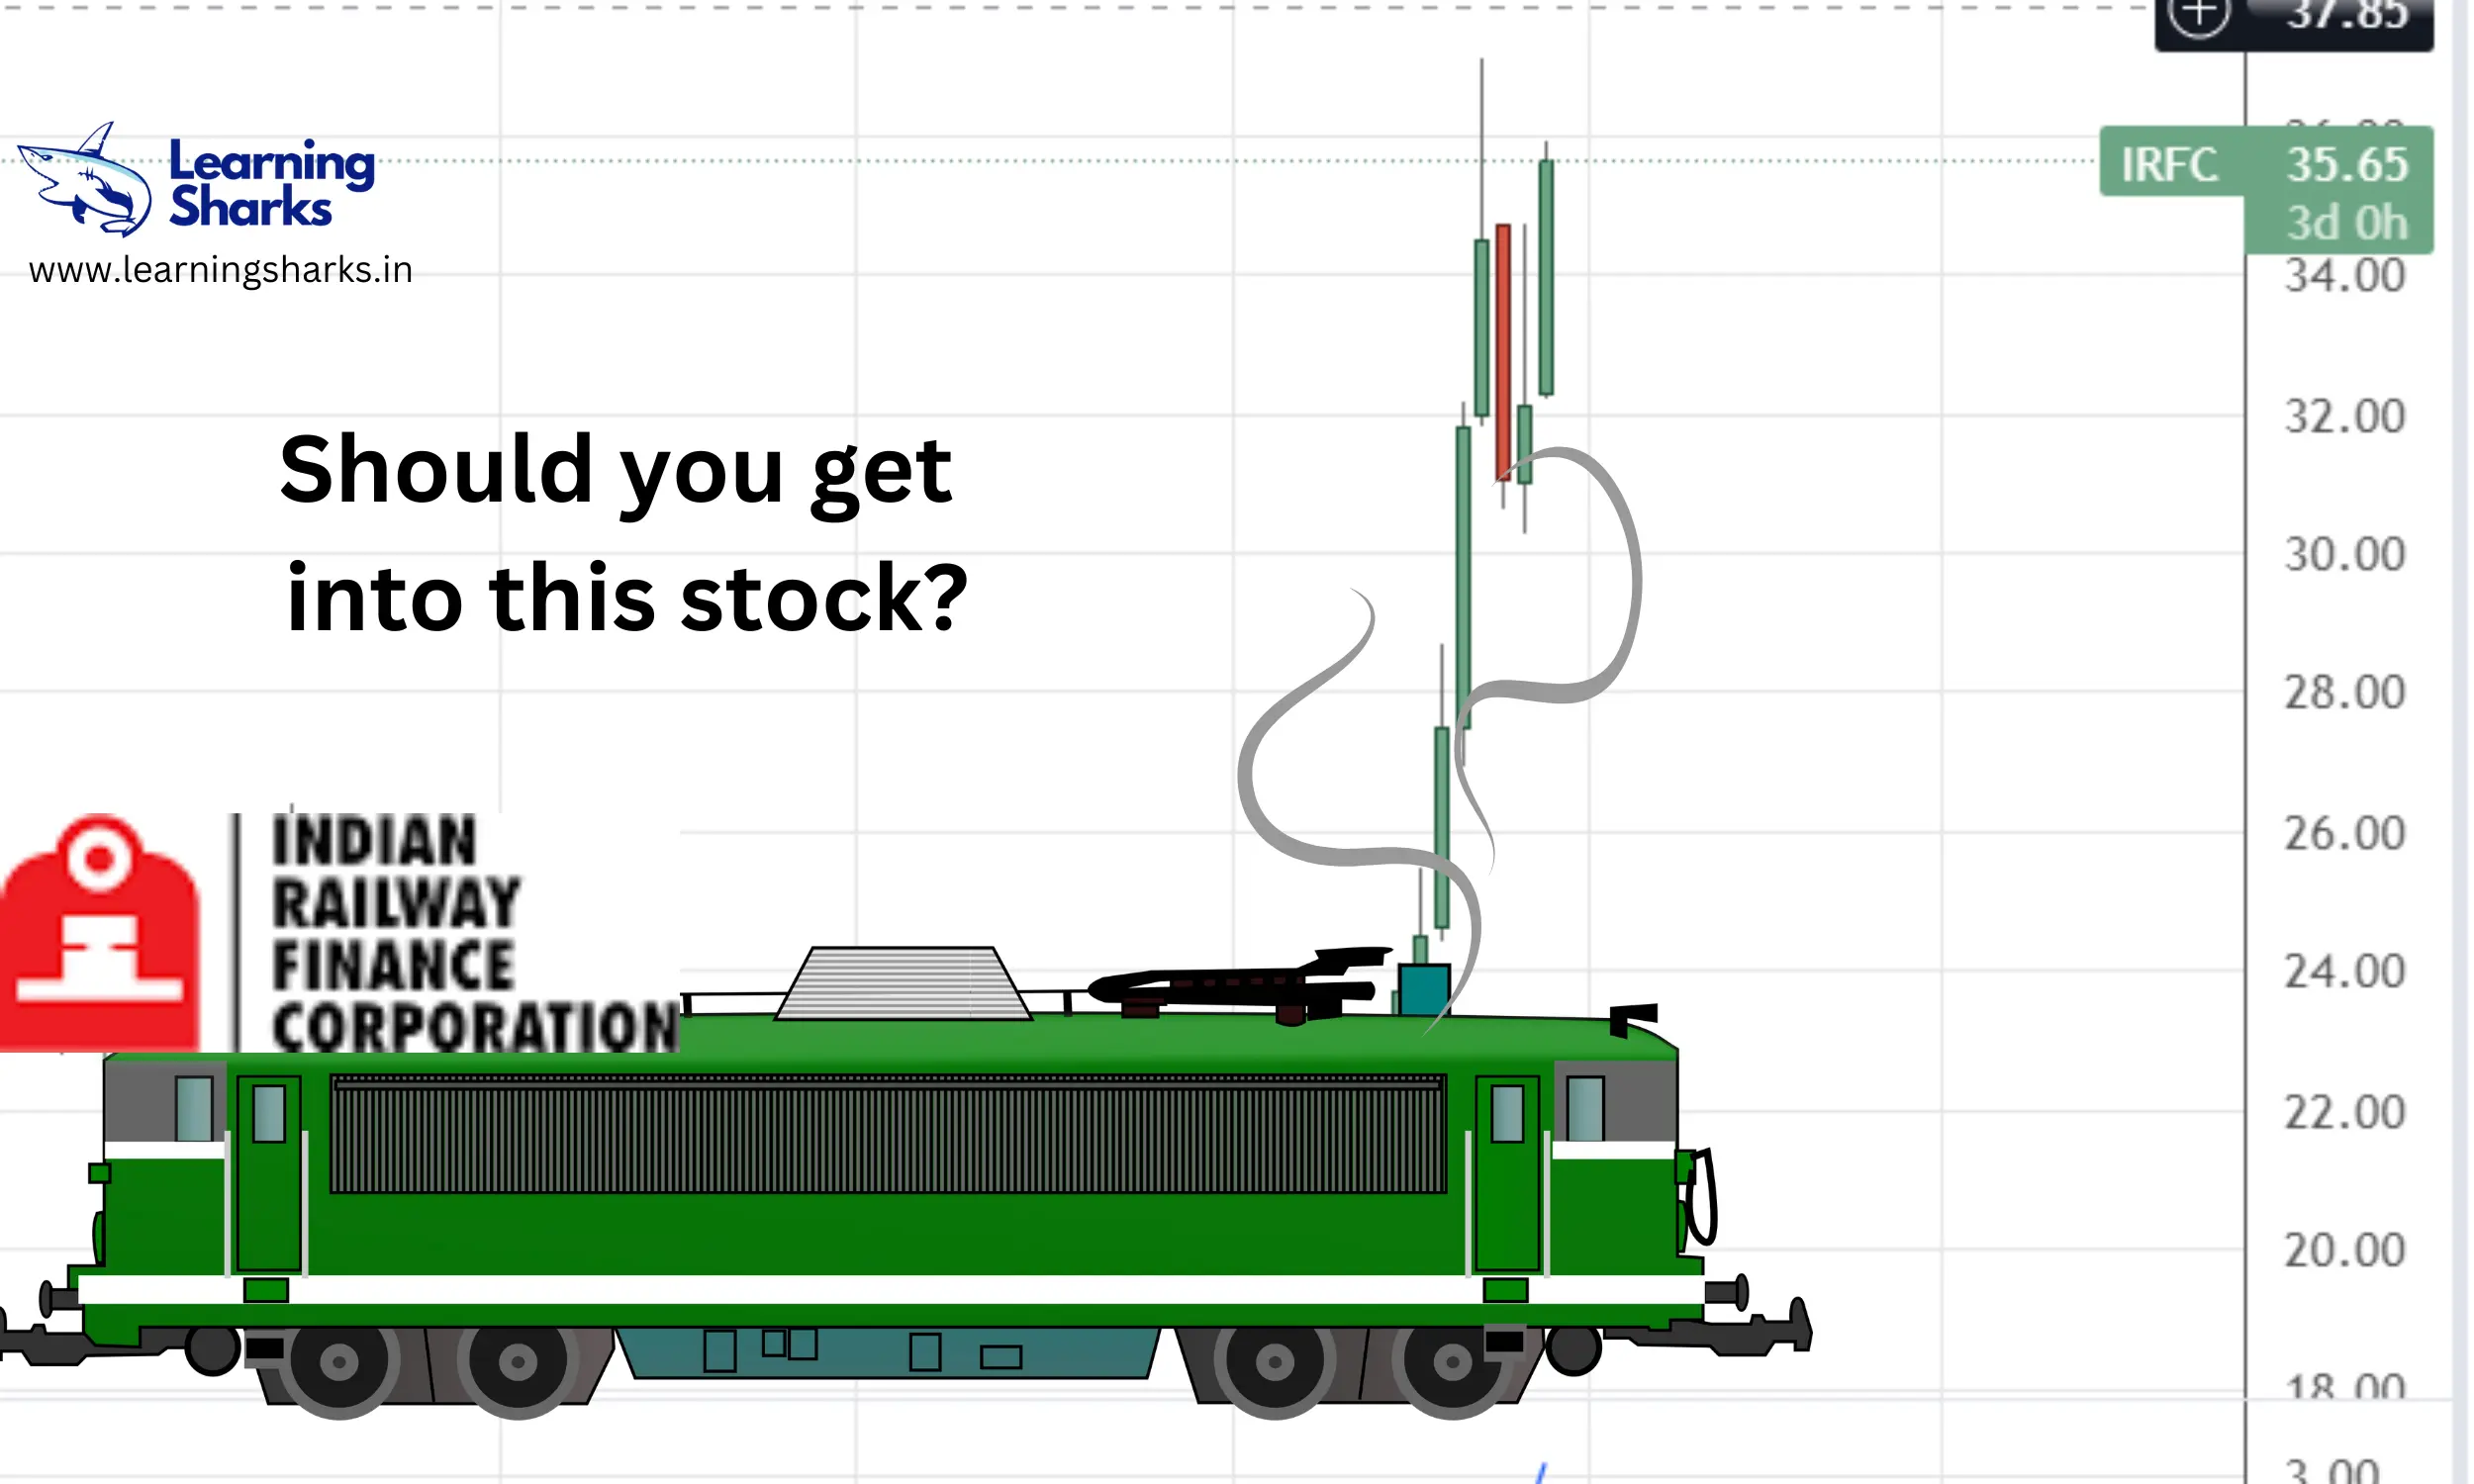
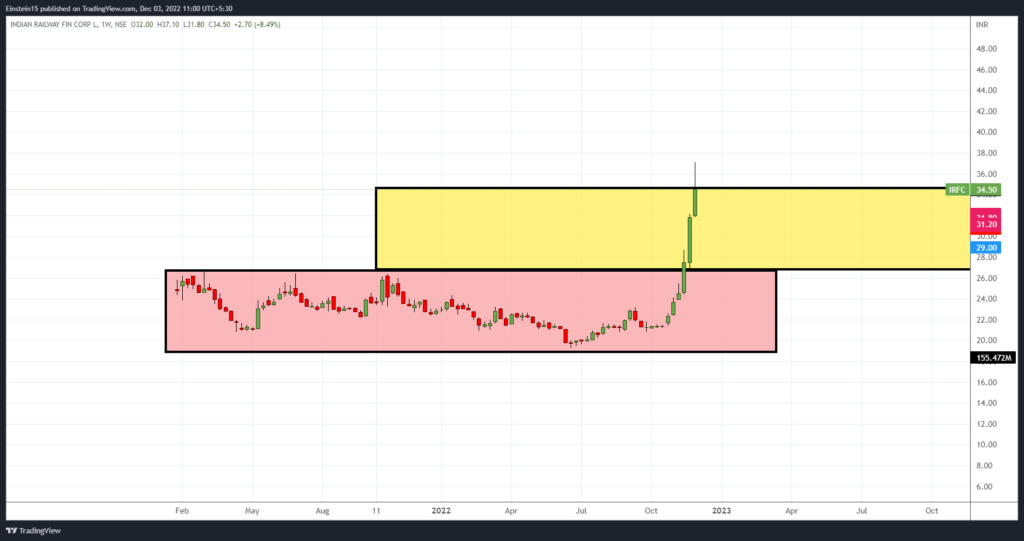
Share price of IRFC NSE Target: On Tuesday, December 20, despite a generally bearish market, the share price of Indian Railway Finance Corporation (IRFC) soared 9%. The PSU stock has experienced recent volatility as profit-taking has dropped the price more than 20% from its 52-week high of Rs. 37.10, which it reached on November 30.
The benchmark indices declined in opening trade as a result of subpar global cues, but the stock opened in the green at Rs 32.95 per share on NSE, up slightly from the previous close of Rs 32.85. In today’s session, the Indian Railways stock experienced strong momentum and strong volume as strong buying propelled it to the day’s high of Rs 35.95, soaring 9%.
According to NSE data as of 3:18 PM, 16,16,33,418 shares of IRFC were traded during today’s trade.
Let’s look at the fundamentals of the stock.
Figures in Rs. Crores
| Mar 2012 | Mar 2013 | Mar 2014 | Mar 2015 | Mar 2016 | Mar 2017 | Mar 2018 | Mar 2019 | Mar 2020 | Mar 2021 | Mar 2022 | TTM | |
|---|---|---|---|---|---|---|---|---|---|---|---|---|
| Sales + | 4,642 | 5,550 | 6,197 | 6,939 | 7,507 | 9,047 | 9,267 | 11,134 | 13,421 | 15,771 | 20,299 | 22,465 |
| Expenses + | 9 | 22 | 19 | 34 | 38 | 26 | 38 | 48 | 66 | 113 | 123 | 148 |
| Operating Profit | 4,633 | 5,528 | 6,178 | 6,905 | 7,468 | 9,021 | 9,229 | 11,085 | 13,355 | 15,657 | 20,177 | 22,317 |
| OPM % | 100% | 100% | 100% | 100% | 99% | 100% | 100% | 100% | 100% | 99% | 99% | 99% |
| Other Income + | 1 | 2 | 1 | 1 | 1 | 0 | 1 | -0 | 0 | 0 | 2 | 3 |
| Interest | 3,620 | 4,075 | 4,607 | 4,992 | 5,519 | 6,888 | 6,638 | 8,183 | 10,163 | 11,237 | 14,075 | 15,842 |
| Depreciation | 0 | 0 | 0 | 0 | 0 | 0 | 0 | 0 | 0 | 4 | 14 | 15 |
| Profit before tax | 1,013 | 1,454 | 1,572 | 1,914 | 1,950 | 2,133 | 2,592 | 2,902 | 3,192 | 4,416 | 6,090 | 6,463 |
| Tax % | 53% | 64% | 55% | 60% | 56% | 56% | 21% | 22% | 0% | 0% | 0% | |
| Net Profit | 481 | 522 | 701 | 758 | 849 | 934 | 2,055 | 2,255 | 3,192 | 4,416 | 6,090 | 6,462 |
| EPS in Rs | 2.69 | 3.38 | 4.66 | 4.94 | ||||||||
| Dividend Payout % | 21% | 21% | 6% | 20% | 40% | 40% | 18% | 18% | 0% | 31% | 30% |
Figures in Rs. CroresCORPORATE ACTIONS
| Mar 2012 | Mar 2013 | Mar 2014 | Mar 2015 | Mar 2016 | Mar 2017 | Mar 2018 | Mar 2019 | Mar 2020 | Mar 2021 | Mar 2022 | Sep 2022 | |
|---|---|---|---|---|---|---|---|---|---|---|---|---|
| Share Capital + | 2,102 | 2,352 | 3,352 | 3,584 | 4,526 | 6,526 | 6,526 | 9,380 | 11,880 | 13,069 | 13,069 | 13,069 |
| Reserves | 3,049 | 3,442 | 3,978 | 4,555 | 4,999 | 5,483 | 7,402 | 15,648 | 18,419 | 22,845 | 27,928 | 30,481 |
| Borrowings + | 50,251 | 58,753 | 69,917 | 71,270 | 87,503 | 106,395 | 134,006 | 173,933 | 234,377 | 323,145 | 388,440 | 386,733 |
| Other Liabilities + | 4,674 | 6,208 | 6,683 | 8,238 | 11,372 | 11,245 | 13,534 | 7,642 | 10,828 | 21,423 | 20,544 | 34,915 |
| Total Liabilities | 60,076 | 70,755 | 83,930 | 87,647 | 108,400 | 129,650 | 161,468 | 206,604 | 275,504 | 380,482 | 449,980 | 465,198 |
| Fixed Assets + | 13 | 13 | 13 | 12 | 12 | 12 | 11 | 11 | 11 | 45 | 38 | 31 |
| CWIP | 0 | 0 | 0 | 0 | 0 | 0 | 0 | 0 | 0 | 0 | 0 | 0 |
| Investments | 15 | 13 | 11 | 9 | 8 | 8 | 14 | 13 | 12 | 12 | 10 | 10 |
| Other Assets + | 60,048 | 70,729 | 83,906 | 87,626 | 108,381 | 129,630 | 161,443 | 206,579 | 275,482 | 380,424 | 449,932 | 465,157 |
| Total Assets | 60,076 | 70,755 | 83,930 | 87,647 | 108,400 | 129,650 | 161,468 | 206,604 | 275,504 | 380,482 | 449,980 | 465,198 |
Numbers in percentages
| Mar 2021 | Jun 2021 | Sep 2021 | Dec 2021 | Mar 2022 | Jun 2022 | Sep 2022 | |
|---|---|---|---|---|---|---|---|
| Promoters + | 86.36 | 86.36 | 86.36 | 86.36 | 86.36 | 86.36 | 86.36 |
| FIIs + | 1.44 | 0.86 | 1.06 | 1.09 | 1.12 | 1.02 | 1.05 |
| DIIs + | 4.23 | 3.74 | 3.18 | 3.20 | 3.18 | 3.25 | 3.39 |
| Public + | 7.97 | 9.03 | 9.40 | 9.34 | 9.33 | 9.36 | 9.19 |
Overall, the share is nice however it will not be a multi-bagger. This is merely an educational opinion. and not investment advice.
#IFRC #SHAREPRICE

Orient Cement Ltd. primarily manufactures and sells cement, and as of right now, its production facilities are situated in Devapur, Telangana, Chittapur, Karnataka, and Jalgaon, Maharashtra. The business manufactures Pozzolana Portland Cement (PPC) and Regular Portland Cement, two different types of cement. Both Birla A1 Premium Cement and Birla A1 StrongCrete are sold under the Birla A1 brand.

The company looks at a great level price to buy. The CMP of this stock is Rs 133.85. We recommend a target of at least Rs 150 within the next 1 month.
Let’s have a look at the fundaments of the orient cement.
Figures in Rs. Crores
| Mar 2012 | Mar 2013 | Mar 2014 | Mar 2015 | Mar 2016 | Mar 2017 | Mar 2018 | Mar 2019 | Mar 2020 | Mar 2021 | Mar 2022 | TTM | |
|---|---|---|---|---|---|---|---|---|---|---|---|---|
| Sales + | 0 | 1,500 | 1,437 | 1,545 | 1,462 | 1,875 | 2,222 | 2,522 | 2,422 | 2,324 | 2,725 | 2,751 |
| Expenses + | 2 | 1,181 | 1,222 | 1,239 | 1,277 | 1,696 | 1,916 | 2,210 | 2,039 | 1,773 | 2,134 | 2,345 |
| Operating Profit | -2 | 319 | 215 | 307 | 186 | 179 | 306 | 312 | 383 | 551 | 591 | 406 |
| OPM % | 21% | 15% | 20% | 13% | 10% | 14% | 12% | 16% | 24% | 22% | 15% | |
| Other Income + | 0 | 4 | 9 | 6 | 8 | 11 | 19 | 14 | 18 | 18 | 10 | 11 |
| Interest | 0 | 19 | 14 | 14 | 54 | 135 | 129 | 118 | 122 | 94 | 51 | 39 |
| Depreciation | 0 | 56 | 56 | 47 | 78 | 122 | 126 | 133 | 141 | 142 | 145 | 147 |
| Profit before tax | -2 | 249 | 153 | 251 | 61 | -66 | 70 | 75 | 137 | 334 | 404 | 230 |
| Tax % | 33% | 35% | 34% | 22% | -2% | 52% | 37% | 36% | 37% | 36% | 35% | |
| Net Profit | -1 | 162 | 101 | 195 | 62 | -32 | 44 | 48 | 87 | 214 | 263 | 145 |
| EPS in Rs | -21.40 | 7.89 | 4.93 | 9.51 | 3.04 | -1.57 | 2.16 | 2.32 | 4.23 | 10.45 | 12.85 | 7.07 |
| Dividend Payout % | 0% | 25% | 30% | 18% | 33% | -32% | 35% | 32% | 18% | 19% | 19% |
Figures in Rs. CroresCORPORATE ACTIONS
| Mar 2012 | Mar 2013 | Mar 2014 | Mar 2015 | Mar 2016 | Mar 2017 | Mar 2018 | Mar 2019 | Mar 2020 | Mar 2021 | Mar 2022 | Sep 2022 | |
|---|---|---|---|---|---|---|---|---|---|---|---|---|
| Share Capital + | 0 | 20 | 20 | 20 | 20 | 20 | 20 | 20 | 20 | 20 | 20 | 20 |
| Reserves | -1 | 736 | 808 | 955 | 1,020 | 967 | 1,002 | 1,033 | 1,098 | 1,285 | 1,505 | 1,497 |
| Borrowings + | 0 | 149 | 329 | 1,106 | 1,285 | 1,336 | 1,314 | 1,290 | 1,226 | 798 | 316 | 429 |
| Other Liabilities + | 2 | 353 | 404 | 484 | 571 | 560 | 601 | 584 | 555 | 708 | 809 | 793 |
| Total Liabilities | 1 | 1,258 | 1,561 | 2,566 | 2,896 | 2,883 | 2,937 | 2,927 | 2,900 | 2,812 | 2,650 | 2,740 |
| Fixed Assets + | 0 | 854 | 826 | 798 | 2,207 | 2,296 | 2,251 | 2,355 | 2,272 | 2,207 | 2,115 | 2,068 |
| CWIP | 0 | 40 | 328 | 1,319 | 239 | 98 | 158 | 48 | 67 | 41 | 40 | 61 |
| Investments | 0 | 0 | 0 | 0 | 0 | 0 | 0 | 0 | 0 | 115 | 14 | 4 |
| Other Assets + | 1 | 365 | 408 | 448 | 450 | 489 | 528 | 525 | 562 | 448 | 481 | 607 |
| Total Assets | 1 | 1,258 | 1,561 | 2,566 | 2,896 | 2,883 | 2,937 | 2,927 | 2,900 | 2,812 | 2,650 | 2,740 |
Numbers in percentages DEALS / TRADES
| Dec 2019 | Mar 2020 | Jun 2020 | Sep 2020 | Dec 2020 | Mar 2021 | Jun 2021 | Sep 2021 | Dec 2021 | Mar 2022 | Jun 2022 | Sep 2022 | |
|---|---|---|---|---|---|---|---|---|---|---|---|---|
| Promoters + | 37.37 | 37.37 | 37.37 | 37.37 | 37.37 | 37.37 | 37.37 | 37.37 | 37.37 | 37.37 | 37.90 | 37.90 |
| FIIs + | 7.69 | 7.49 | 3.11 | 3.00 | 1.48 | 2.09 | 4.43 | 5.97 | 6.64 | 6.54 | 5.83 | 6.43 |
| DIIs + | 28.81 | 28.15 | 26.84 | 26.39 | 25.14 | 24.08 | 20.64 | 15.92 | 15.41 | 14.83 | 13.32 | 11.30 |
| Public + | 26.13 | 27.00 | 32.68 | 33.25 | 36.02 | 36.46 | 37.56 | 40.74 | 40.59 | 41.26 | 42.95 | 44.38 |
The company looks amazing overall to invest in the long term ., You can start with a capital of 10,00 and slowly take it up to 50,000. If you wanna learn more about the stock market courses. Contact us.
Checked by: Vijay Verma
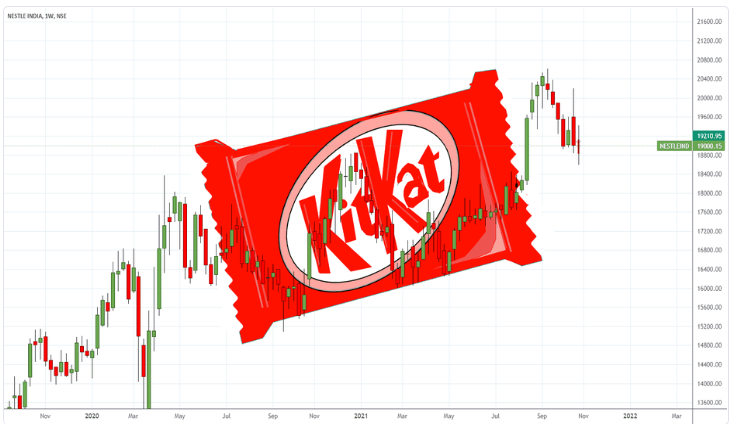
NESTLE started doing business in India in 1912, importing and selling finished goods there. The business gradually increased its presence in India. Are you holding this stock?
The company has maintained its share capital and its continuous supply of FMCG made this stock a multi-bagger. If anybody had invested in this stock in 2010, this stock would have given 600% growth along with Dividends and bonuses.
Nestle CMP is Rs20338 as of Dec 13 which is almost its all-time high. Ideally is it not advised to make a new entry at this point of time? While looking at the NIFTY 50 CMP 18608 again at its all-time high suggesting the stocks would see resistance at this level.
Let’s look at the technical analysis of the stock.
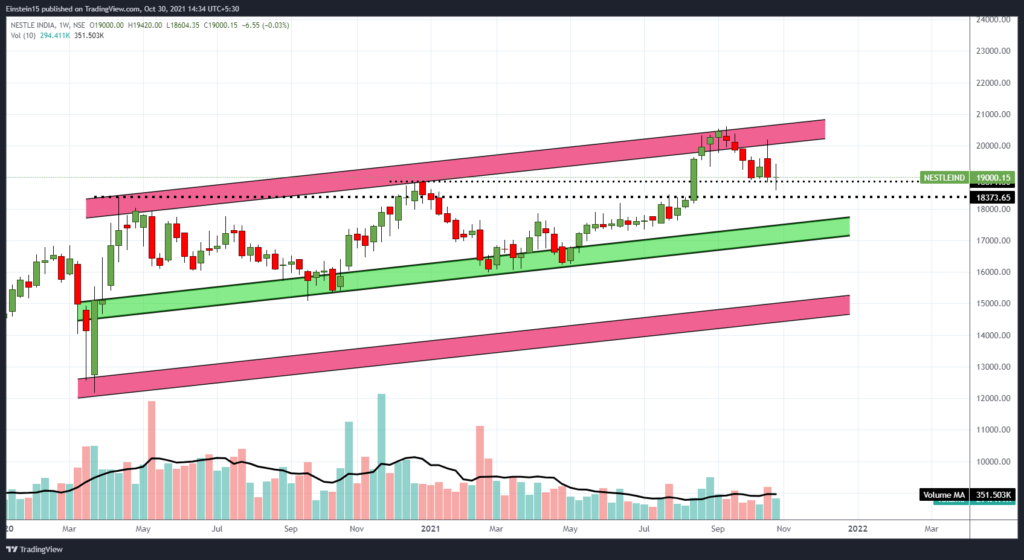
Looking at the technical analysis of the stock, the stock seems to be touching the upper band of the channel. Another entry can be taken somewhere around the support.
let’s look at the fundaments of this stock
Quarterly Results Figures in Rs. Crores
Figures in Rs. Crores
| Dec 2010 | Dec 2011 | Dec 2012 | Dec 2013 | Dec 2014 | Dec 2015 | Dec 2016 | Dec 2017 | Dec 2018 | Dec 2019 | Dec 2020 | Dec 2021 | TTM | |
|---|---|---|---|---|---|---|---|---|---|---|---|---|---|
| Sales + | 6,255 | 7,515 | 8,335 | 9,101 | 9,855 | 8,175 | 9,141 | 10,010 | 11,292 | 12,369 | 13,350 | 14,709 | 16,348 |
| Expenses + | 5,016 | 5,990 | 6,509 | 7,153 | 7,816 | 6,620 | 7,292 | 7,913 | 8,675 | 9,443 | 10,149 | 11,118 | 12,727 |
| Operating Profit | 1,239 | 1,525 | 1,825 | 1,948 | 2,039 | 1,555 | 1,850 | 2,097 | 2,618 | 2,926 | 3,202 | 3,592 | 3,620 |
| OPM % | 20% | 20% | 22% | 21% | 21% | 19% | 20% | 21% | 23% | 24% | 24% | 24% | 22% |
| Other Income + | 35 | 21 | 31 | 97 | 87 | -391 | 140 | 177 | 259 | 247 | 146 | -116 | -138 |
| Interest | 1 | 5 | 27 | 37 | 14 | 3 | 91 | 92 | 112 | 129 | 164 | 201 | 153 |
| Depreciation | 128 | 153 | 277 | 330 | 338 | 347 | 354 | 342 | 336 | 370 | 370 | 390 | 410 |
| Profit before tax | 1,145 | 1,388 | 1,553 | 1,678 | 1,774 | 814 | 1,545 | 1,839 | 2,429 | 2,673 | 2,813 | 2,884 | 2,920 |
| Tax % | 29% | 31% | 31% | 33% | 33% | 31% | 35% | 33% | 34% | 26% | 26% | 26% | |
| Net Profit | 819 | 962 | 1,068 | 1,117 | 1,185 | 563 | 1,001 | 1,225 | 1,607 | 1,968 | 2,082 | 2,145 | 2,165 |
| EPS in Rs | 84.91 | 99.73 | 110.76 | 115.87 | 122.87 | 58.42 | 103.86 | 127.07 | 166.67 | 204.16 | 215.98 | 222.46 | 224.55 |
| Dividend Payout % | 57% | 49% | 44% | 42% | 51% | 83% | 61% | 68% | 69% | 168% | 93% | 90% |
Figures in Rs. CroresCORPORATE ACTIONS
| Dec 2010 | Dec 2011 | Dec 2012 | Dec 2013 | Dec 2014 | Dec 2015 | Dec 2016 | Dec 2017 | Dec 2018 | Dec 2019 | Dec 2020 | Dec 2021 | Jun 2022 | |
|---|---|---|---|---|---|---|---|---|---|---|---|---|---|
| Share Capital + | 96 | 96 | 96 | 96 | 96 | 96 | 96 | 96 | 96 | 96 | 96 | 96 | 96 |
| Reserves | 759 | 1,178 | 1,702 | 2,272 | 2,741 | 2,721 | 3,186 | 3,324 | 3,577 | 1,822 | 1,923 | 1,988 | 2,232 |
| Borrowings + | 0 | 971 | 1,050 | 1,189 | 20 | 18 | 33 | 35 | 35 | 189 | 147 | 266 | 280 |
| Other Liabilities + | 1,703 | 2,157 | 2,315 | 2,756 | 2,963 | 3,251 | 3,495 | 3,907 | 4,379 | 5,065 | 5,733 | 5,860 | 6,007 |
| Total Liabilities | 2,558 | 4,402 | 5,164 | 6,314 | 5,820 | 6,086 | 6,810 | 7,363 | 8,088 | 7,173 | 7,900 | 8,210 | 8,616 |
| Fixed Assets + | 1,013 | 1,576 | 3,204 | 3,369 | 3,177 | 2,898 | 2,730 | 2,616 | 2,401 | 2,341 | 2,179 | 2,994 | 3,054 |
| CWIP | 349 | 1,372 | 344 | 295 | 245 | 231 | 188 | 94 | 105 | 143 | 639 | 246 | 197 |
| Investments | 151 | 134 | 365 | 851 | 812 | 1,325 | 1,756 | 1,979 | 2,658 | 1,751 | 1,464 | 774 | 809 |
| Other Assets + | 1,046 | 1,320 | 1,251 | 1,799 | 1,586 | 1,633 | 2,136 | 2,673 | 2,924 | 2,937 | 3,618 | 4,196 | 4,556 |
| Total Assets | 2,558 | 4,402 | 5,164 | 6,314 | 5,820 | 6,086 | 6,810 | 7,363 | 8,088 | 7,173 | 7,900 | 8,210 | 8,616 |
Figures in Rs. Crores
| Dec 2010 | Dec 2011 | Dec 2012 | Dec 2013 | Dec 2014 | Dec 2015 | Dec 2016 | Dec 2017 | Dec 2018 | Dec 2019 | Dec 2020 | Dec 2021 | |
|---|---|---|---|---|---|---|---|---|---|---|---|---|
| Cash from Operating Activity + | 1,037 | 1,158 | 1,693 | 1,796 | 1,644 | 1,098 | 1,466 | 1,818 | 2,052 | 2,295 | 2,454 | 2,271 |
| Cash from Investing Activity + | -446 | -1,528 | -941 | -441 | -432 | -70 | -126 | -131 | -52 | 83 | -321 | -1,957 |
| Cash from Financing Activity + | -544 | 323 | -513 | -580 | -1,635 | -498 | -666 | -997 | -1,317 | -3,602 | -1,956 | -2,019 |
| Net Cash Flow | 47 | -47 | 239 | 775 | -423 | 529 | 674 | 691 | 683 | -1,223 | 177 | -1,704 |
Figures in Rs. Crores
| Dec 2010 | Dec 2011 | Dec 2012 | Dec 2013 | Dec 2014 | Dec 2015 | Dec 2016 | Dec 2017 | Dec 2018 | Dec 2019 | Dec 2020 | Dec 2021 | |
|---|---|---|---|---|---|---|---|---|---|---|---|---|
| Debtor Days | 4 | 6 | 4 | 3 | 4 | 4 | 4 | 3 | 4 | 4 | 5 | 4 |
| Inventory Days | 82 | 89 | 86 | 79 | 82 | 103 | 107 | 91 | 92 | 107 | 107 | 111 |
| Days Payable | 106 | 92 | 63 | 68 | 71 | 94 | 91 | 99 | 118 | 124 | 115 | 122 |
| Cash Conversion Cycle | -20 | 3 | 28 | 14 | 15 | 12 | 20 | -5 | -22 | -14 | -3 | -7 |
| Working Capital Days | -51 | -14 | -11 | -17 | -13 | -21 | -10 | -15 | -21 | -19 | -21 | -15 |
| ROCE % | 161% | 90% | 62% | 53% | 56% | 46% | 54% | 57% | 71% | 96% | 139% | 147% |
Numbers in percentagesDEALS / TRADES
8 recently
| Dec 2019 | Mar 2020 | Jun 2020 | Sep 2020 | Dec 2020 | Mar 2021 | Jun 2021 | Sep 2021 | Dec 2021 | Mar 2022 | Jun 2022 | Sep 2022 | |
|---|---|---|---|---|---|---|---|---|---|---|---|---|
| Promoters + | 62.76 | 62.76 | 62.76 | 62.76 | 62.76 | 62.76 | 62.76 | 62.76 | 62.76 | 62.76 | 62.76 | 62.76 |
| FIIs + | 12.07 | 11.81 | 12.10 | 11.51 | 12.84 | 12.29 | 12.43 | 12.31 | 12.35 | 12.01 | 11.65 | 12.05 |
| DIIs + | 8.92 | 9.12 | 8.71 | 8.91 | 7.75 | 7.95 | 7.92 | 7.99 | 7.89 | 8.60 | 9.14 | 8.86 |
| Government + | 0.07 | 0.07 | 0.07 | 0.00 | 0.00 | 0.00 | 0.00 | 0.00 | 0.00 | 0.00 | 0.00 | 0.00 |
| Public + | 16.18 | 16.24 | 16.36 | 16.82 | 16.65 | 16.99 | 16.88 | 16.93 | 16.99 | 16.62 | 16.45 | 16.33 |
Overall the company seems good to hold. However, It might take a healthy correction. If you wanna learn about the course check out our courses page.
#stockmarket #sharemarket #nestle
Update – 15-04-23
Current Market price is 19465
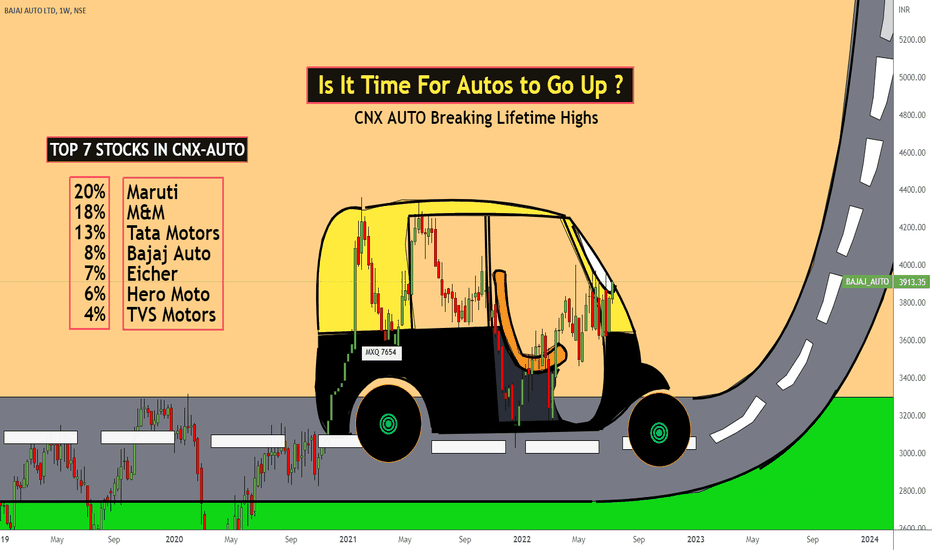
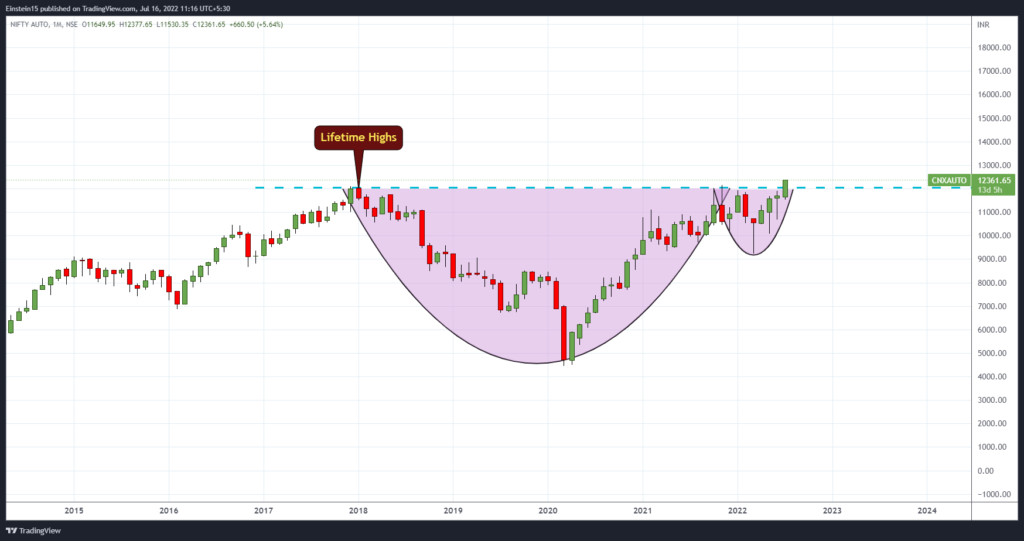
If you are waiting for the EV market to boom, then you are just another nature lover. Cars running on petrol have been among us are favorites for ages. Then came the CNG which was another eco-friendly alternative. EV is the next best thing coming on the market. We already have many auto stocks running in the race to be the top EV provider to fuel this ambition.
Here are some of the top stocks in the automotive sector along with their fundamentals. One can find themselves around these companies already striving for the same ambition.
In our list, Here are some of the top stocks, you can invest in and trade in the stock market.
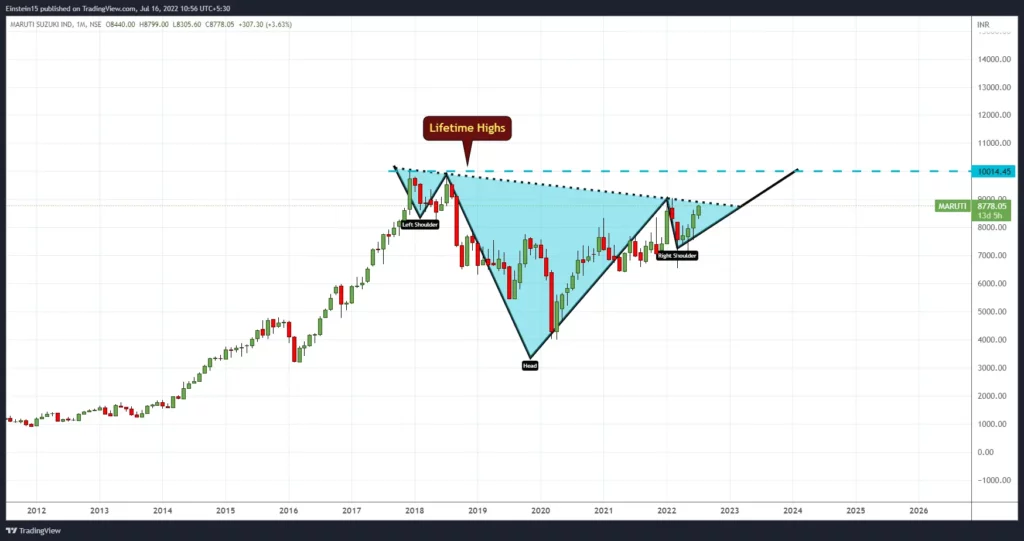
2. Maruti Share price
Consolidated Figures in Rs. Crores / View StandaloneCORPORATE ACTIONS
| Mar 2011 | Mar 2012 | Mar 2013 | Mar 2014 | Mar 2015 | Mar 2016 | Mar 2017 | Mar 2018 | Mar 2019 | Mar 2020 | Mar 2021 | Mar 2022 | Sep 2022 | |
|---|---|---|---|---|---|---|---|---|---|---|---|---|---|
| Share Capital + | 144 | 144 | 151 | 151 | 151 | 151 | 151 | 151 | 151 | 151 | 151 | 151 | 151 |
| Reserves | 14,164 | 15,530 | 18,877 | 21,345 | 24,167 | 30,465 | 36,924 | 42,408 | 46,941 | 49,262 | 52,350 | 55,182 | 57,030 |
| Borrowings + | 454 | 1,421 | 1,569 | 2,004 | 666 | 231 | 484 | 121 | 160 | 184 | 541 | 426 | 625 |
| Other Liabilities + | 4,344 | 6,004 | 6,920 | 7,975 | 9,492 | 11,879 | 14,402 | 17,568 | 16,717 | 14,031 | 18,335 | 18,896 | 21,214 |
| Total Liabilities | 19,106 | 23,099 | 27,517 | 31,476 | 34,477 | 42,726 | 51,960 | 60,248 | 63,969 | 63,628 | 71,376 | 74,656 | 79,020 |
| Fixed Assets + | 5,672 | 7,746 | 10,022 | 11,034 | 12,490 | 12,530 | 13,311 | 13,389 | 15,437 | 15,744 | 14,989 | 13,747 | 17,361 |
| CWIP | 879 | 943 | 1,966 | 2,640 | 1,890 | 1,007 | 1,252 | 2,132 | 1,607 | 1,415 | 1,497 | 2,936 | 2,246 |
| Investments | 5,439 | 6,545 | 7,421 | 10,527 | 13,298 | 20,676 | 29,151 | 36,123 | 37,504 | 37,488 | 42,945 | 42,035 | 42,907 |
| Other Assets + | 7,116 | 7,866 | 8,107 | 7,275 | 6,800 | 8,513 | 8,247 | 8,604 | 9,421 | 8,980 | 11,946 | 15,937 | 16,506 |
| Total Assets | 19,106 | 23,099 | 27,517 | 31,476 | 34,477 | 42,726 | 51,960 | 60,248 | 63,969 | 63,628 | 71,376 | 74,656 | 79,020 |
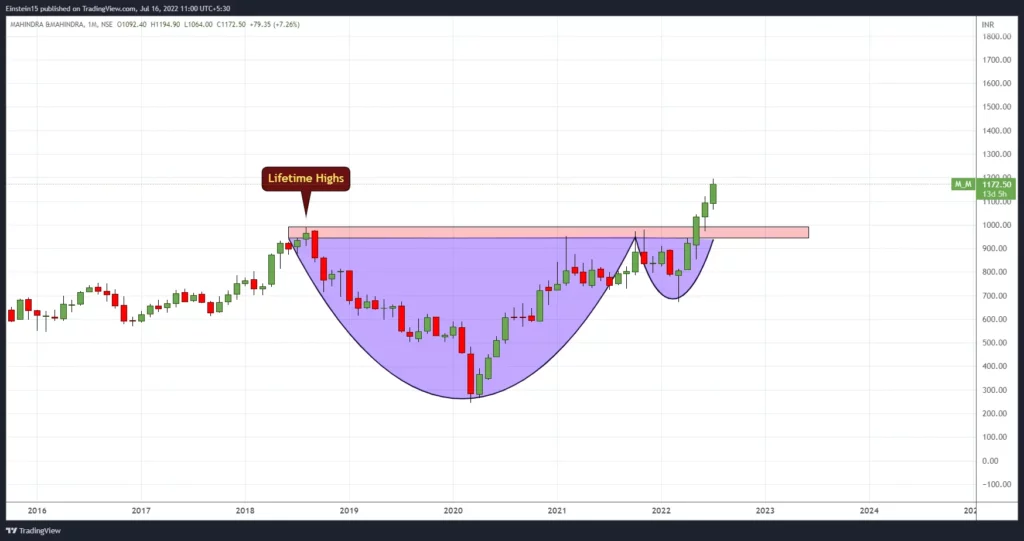
3. M&M Share price
Consolidated Figures in Rs. Crores / View StandaloneCORPORATE ACTIONS
| Mar 2011 | Mar 2012 | Mar 2013 | Mar 2014 | Mar 2015 | Mar 2016 | Mar 2017 | Mar 2018 | Mar 2019 | Mar 2020 | Mar 2021 | Mar 2022 | Sep 2022 | |
|---|---|---|---|---|---|---|---|---|---|---|---|---|---|
| Share Capital + | 294 | 295 | 295 | 295 | 296 | 270 | 271 | 543 | 544 | 554 | 555 | 556 | 556 |
| Reserves | 13,990 | 16,409 | 19,666 | 23,012 | 25,561 | 26,222 | 29,467 | 36,232 | 39,439 | 39,415 | 41,027 | 46,567 | 49,956 |
| Borrowings + | 17,047 | 23,121 | 28,711 | 35,167 | 37,911 | 41,553 | 48,762 | 55,898 | 70,848 | 82,092 | 80,625 | 77,605 | 83,273 |
| Other Liabilities + | 19,005 | 23,623 | 27,460 | 29,415 | 30,608 | 31,806 | 35,296 | 43,696 | 51,057 | 43,655 | 42,762 | 47,661 | 58,329 |
| Total Liabilities | 50,337 | 63,448 | 76,131 | 87,889 | 94,376 | 99,852 | 113,835 | 136,369 | 161,889 | 165,716 | 164,968 | 172,388 | 192,115 |
| Fixed Assets + | 14,708 | 17,198 | 18,307 | 18,381 | 19,047 | 20,585 | 20,989 | 26,182 | 28,983 | 29,689 | 21,380 | 26,018 | 27,965 |
| CWIP | 1,408 | 1,488 | 1,631 | 2,191 | 3,032 | 2,371 | 4,279 | 4,269 | 4,760 | 6,856 | 7,873 | 6,703 | 1,720 |
| Investments | 4,714 | 5,347 | 6,440 | 8,082 | 10,027 | 11,603 | 14,662 | 16,018 | 18,268 | 19,210 | 28,778 | 30,060 | 32,272 |
| Other Assets + | 29,506 | 39,414 | 49,752 | 59,234 | 62,270 | 65,293 | 73,905 | 89,900 | 109,878 | 109,960 | 106,938 | 109,607 | 130,157 |
| Total Assets | 50,337 | 63,448 | 76,131 | 87,889 | 94,376 | 99,852 | 113,835 | 136,369 | 161,889 | 165,716 | 164,968 | 172,388 | 192,115 |
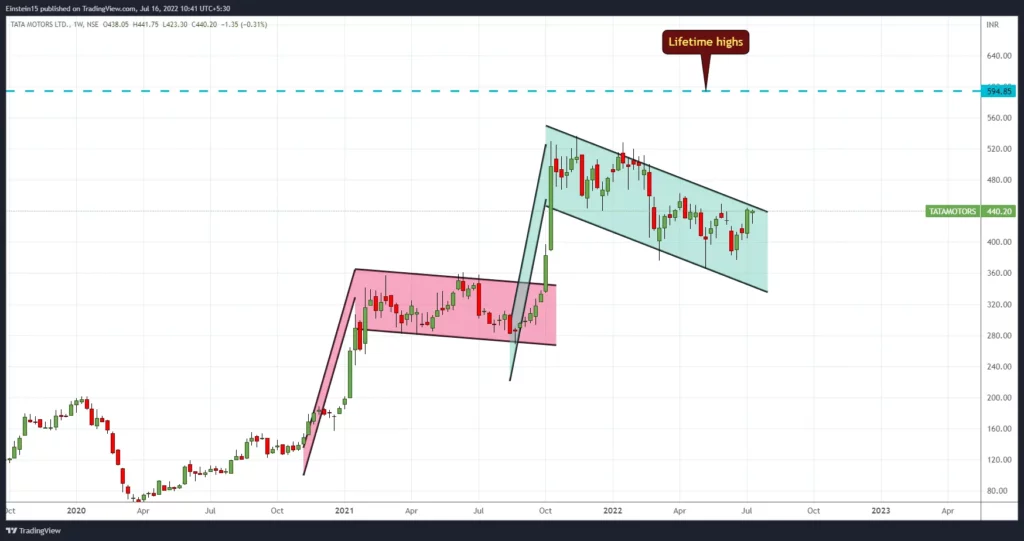
4. Tata Motors Share Price
Consolidated Figures in Rs. Crores / View StandaloneCORPORATE ACTIONS
| Mar 2011 | Mar 2012 | Mar 2013 | Mar 2014 | Mar 2015 | Mar 2016 | Mar 2017 | Mar 2018 | Mar 2019 | Mar 2020 | Mar 2021 | Mar 2022 | Sep 2022 | |
|---|---|---|---|---|---|---|---|---|---|---|---|---|---|
| Share Capital + | 635 | 635 | 638 | 644 | 644 | 679 | 679 | 679 | 679 | 720 | 766 | 766 | 766 |
| Reserves | 18,534 | 32,064 | 36,999 | 64,960 | 55,618 | 78,273 | 57,383 | 94,749 | 59,500 | 61,491 | 54,481 | 43,795 | 25,409 |
| Borrowings + | 32,811 | 47,149 | 53,716 | 60,642 | 73,610 | 69,360 | 78,604 | 88,950 | 106,175 | 124,788 | 142,131 | 146,449 | 144,354 |
| Other Liabilities + | 48,403 | 62,919 | 76,977 | 92,180 | 107,442 | 114,872 | 135,914 | 142,813 | 139,349 | 133,181 | 144,193 | 138,051 | 145,111 |
| Total Liabilities | 100,382 | 142,766 | 168,330 | 218,426 | 237,315 | 263,184 | 272,580 | 327,192 | 305,703 | 320,179 | 341,570 | 329,061 | 315,640 |
| Fixed Assets + | 35,349 | 44,360 | 55,512 | 69,092 | 88,479 | 107,232 | 95,944 | 121,414 | 111,234 | 127,107 | 138,708 | 138,855 | 133,965 |
| CWIP | 11,457 | 15,946 | 18,454 | 33,263 | 28,640 | 25,919 | 33,699 | 40,034 | 31,884 | 35,622 | 20,964 | 10,251 | 1,797 |
| Investments | 2,544 | 8,918 | 8,765 | 10,687 | 15,337 | 23,767 | 20,338 | 20,813 | 15,771 | 16,308 | 24,620 | 29,380 | 22,126 |
| Other Assets + | 51,032 | 73,542 | 85,600 | 105,385 | 104,858 | 106,266 | 122,600 | 144,932 | 146,814 | 141,141 | 157,278 | 150,575 | 157,752 |
| Total Assets | 100,382 | 142,766 | 168,330 | 218,426 | 237,315 | 263,184 | 272,580 | 327,192 | 305,703 | 320,179 | 341,570 | 329,061 | 315,640 |
5. Eicher Motor
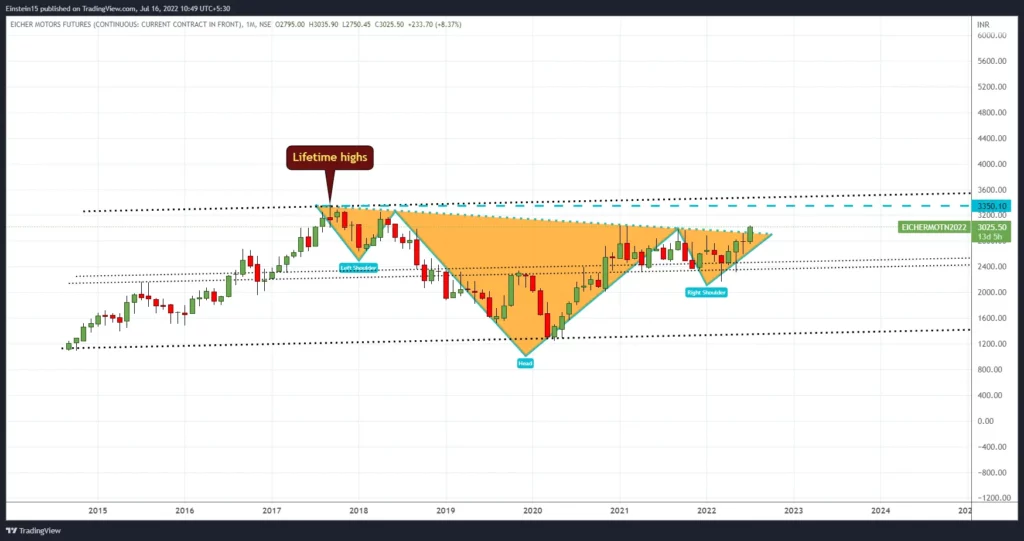
Consolidated Figures in Rs. Crores / View StandaloneCORPORATE ACTIONS
| Dec 2010 | Dec 2011 | Dec 2012 | Dec 2013 | Dec 2014 | Mar 2016 | Mar 2017 | Mar 2018 | Mar 2019 | Mar 2020 | Mar 2021 | Mar 2022 | Sep 2022 | |
|---|---|---|---|---|---|---|---|---|---|---|---|---|---|
| Share Capital + | 27 | 27 | 27 | 27 | 27 | 27 | 27 | 27 | 27 | 27 | 27 | 27 | 27 |
| Reserves | 1,205 | 1,466 | 1,728 | 2,028 | 2,489 | 3,626 | 5,318 | 7,003 | 8,891 | 9,954 | 11,411 | 12,581 | 13,250 |
| Borrowings + | 96 | 43 | 23 | 84 | 58 | 23 | 112 | 151 | 187 | 249 | 219 | 108 | 168 |
| Other Liabilities + | 1,636 | 2,257 | 2,694 | 3,197 | 3,829 | 1,263 | 1,552 | 2,341 | 2,281 | 2,220 | 2,901 | 3,485 | 3,787 |
| Total Liabilities | 2,963 | 3,793 | 4,471 | 5,337 | 6,403 | 4,939 | 7,009 | 9,522 | 11,387 | 12,450 | 14,559 | 16,201 | 17,232 |
| Fixed Assets + | 384 | 504 | 992 | 1,656 | 2,309 | 790 | 873 | 1,502 | 1,875 | 2,378 | 2,433 | 2,424 | 2,902 |
| CWIP | 70 | 352 | 504 | 464 | 419 | 94 | 374 | 333 | 450 | 312 | 314 | 505 | 81 |
| Investments | 459 | 513 | 638 | 825 | 1,078 | 3,388 | 4,987 | 5,581 | 4,923 | 5,749 | 3,902 | 7,721 | 8,954 |
| Other Assets + | 2,050 | 2,424 | 2,337 | 2,391 | 2,597 | 667 | 775 | 2,106 | 4,140 | 4,011 | 7,909 | 5,551 | 5,296 |
| Total Assets | 2,963 | 3,793 | 4,471 | 5,337 | 6,403 | 4,939 | 7,009 | 9,522 | 11,387 | 12,450 | 14,559 | 16,201 | 17,232 |
6. Hero motor cop
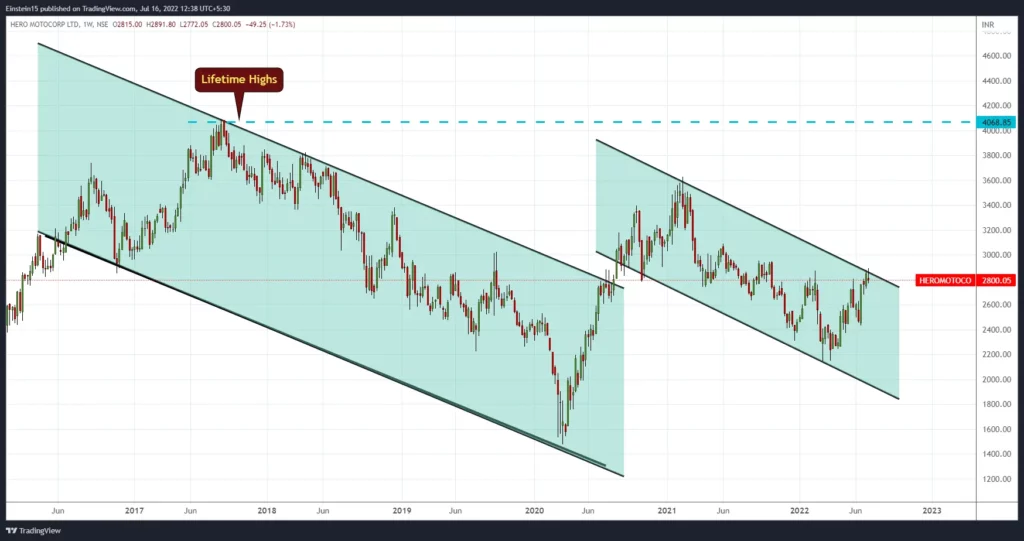
Consolidated Figures in Rs. Crores / View StandaloneCORPORATE ACTIONS
| Mar 2014 | Mar 2015 | Mar 2016 | Mar 2017 | Mar 2018 | Mar 2019 | Mar 2020 | Mar 2021 | Mar 2022 | Sep 2022 | |
|---|---|---|---|---|---|---|---|---|---|---|
| Share Capital + | 40 | 40 | 40 | 40 | 40 | 40 | 40 | 40 | 40 | 40 |
| Reserves | 5,583 | 6,500 | 8,794 | 10,276 | 11,932 | 13,080 | 14,366 | 15,376 | 15,807 | 16,375 |
| Borrowings + | 284 | 100 | 232 | 261 | 228 | 312 | 453 | 584 | 605 | 727 |
| Other Liabilities + | 4,215 | 4,014 | 3,829 | 4,736 | 5,197 | 5,072 | 4,815 | 7,096 | 6,027 | 7,069 |
| Total Liabilities | 10,122 | 10,654 | 12,896 | 15,312 | 17,397 | 18,504 | 19,674 | 23,096 | 22,478 | 24,211 |
| Fixed Assets + | 2,247 | 2,952 | 3,784 | 4,599 | 4,961 | 4,952 | 6,473 | 6,380 | 6,194 | 6,409 |
| CWIP | 855 | 719 | 653 | 581 | 355 | 573 | 391 | 495 | 517 | 171 |
| Investments | 4,106 | 3,118 | 4,501 | 6,066 | 7,669 | 6,114 | 8,359 | 10,582 | 10,528 | 10,033 |
| Other Assets + | 2,914 | 3,864 | 3,958 | 4,066 | 4,411 | 6,865 | 4,451 | 5,639 | 5,240 | 7,598 |
| Total Assets | 10,122 | 10,654 | 12,896 | 15,312 | 17,397 | 18,504 | 19,674 | 23,096 | 22,478 | 24,211 |
7. TVS MOTOR–>
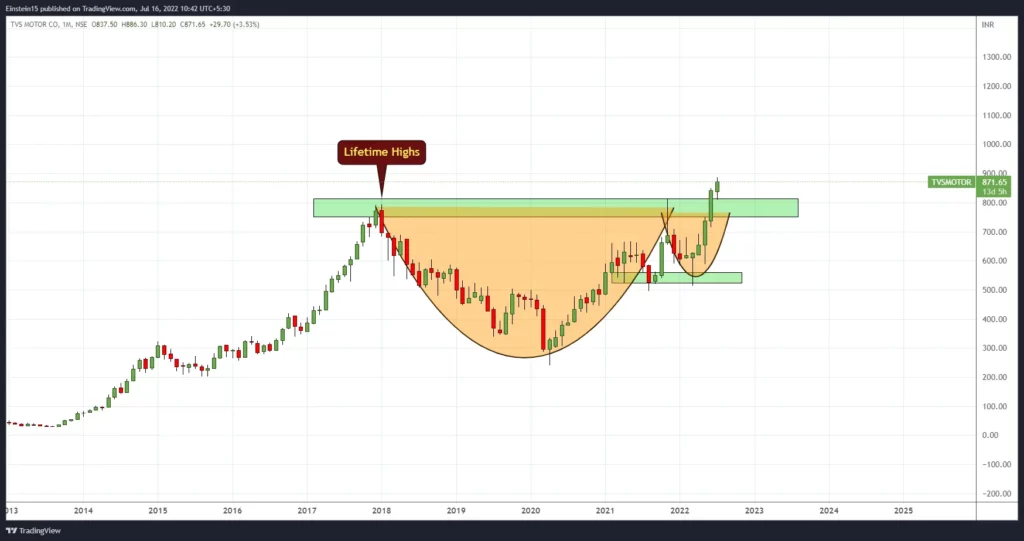
Consolidated Figures in Rs. Crores / View StandaloneCORPORATE ACTIONS
| Mar 2011 | Mar 2012 | Mar 2013 | Mar 2014 | Mar 2015 | Mar 2016 | Mar 2017 | Mar 2018 | Mar 2019 | Mar 2020 | Mar 2021 | Mar 2022 | Sep 2022 | |
|---|---|---|---|---|---|---|---|---|---|---|---|---|---|
| Share Capital + | 48 | 48 | 48 | 48 | 48 | 48 | 48 | 48 | 48 | 48 | 48 | 48 | 48 |
| Reserves | 634 | 675 | 851 | 1,113 | 1,277 | 1,771 | 2,169 | 2,630 | 3,123 | 3,235 | 3,779 | 4,352 | 5,022 |
| Borrowings + | 1,041 | 1,304 | 1,068 | 728 | 1,119 | 1,091 | 1,311 | 6,928 | 9,298 | 11,591 | 12,179 | 15,827 | 18,675 |
| Other Liabilities + | 1,102 | 1,290 | 1,415 | 1,743 | 2,126 | 2,236 | 2,601 | 3,586 | 4,228 | 4,399 | 5,859 | 6,638 | 7,384 |
| Total Liabilities | 2,825 | 3,317 | 3,381 | 3,632 | 4,570 | 5,146 | 6,128 | 13,190 | 16,696 | 19,272 | 21,865 | 26,865 | 31,129 |
| Fixed Assets + | 1,294 | 1,472 | 1,593 | 1,517 | 1,637 | 2,038 | 2,362 | 3,094 | 3,367 | 3,811 | 4,221 | 5,975 | 5,447 |
| CWIP | 58 | 186 | 36 | 48 | 93 | 47 | 64 | 313 | 745 | 1,006 | 1,041 | 552 | 245 |
| Investments | 221 | 318 | 348 | 439 | 539 | 943 | 1,155 | 421 | 440 | 371 | 468 | 605 | 766 |
| Other Assets + | 1,252 | 1,340 | 1,404 | 1,628 | 2,301 | 2,118 | 2,547 | 9,362 | 12,145 | 14,085 | 16,135 | 19,734 | 24,670 |
| Total Assets | 2,825 | 3,317 | 3,381 | 3,632 | 4,570 | 5,146 | 6,128 | 13,190 | 16,696 | 19,272 | 21,865 | 26,865 | 31,129 |
8. Escort’s Share price
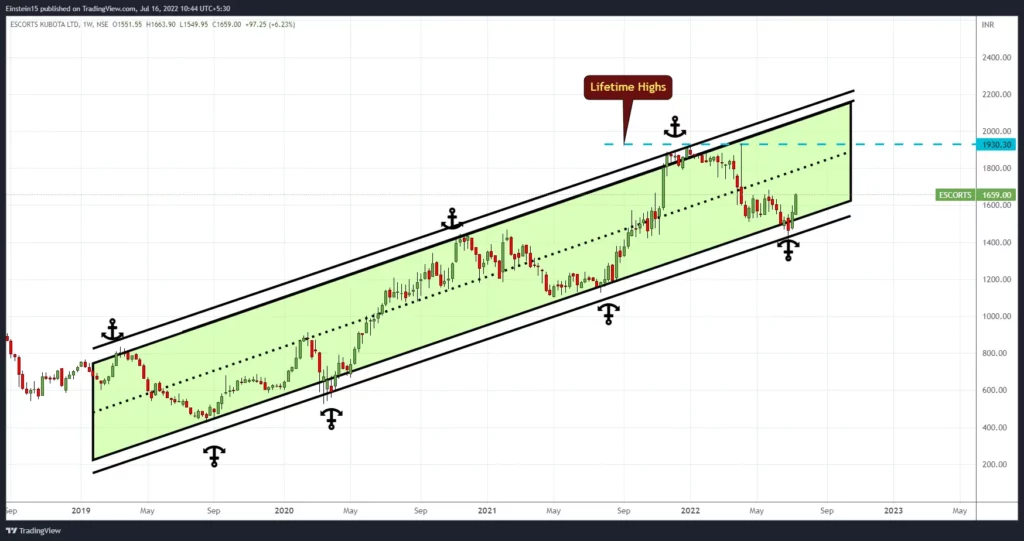
Consolidated Figures in Rs. Crores / View StandaloneCORPORATE ACTIONS
| Mar 2016 | Mar 2017 | Mar 2018 | Mar 2019 | Mar 2020 | Mar 2021 | Mar 2022 | Sep 2022 | |
|---|---|---|---|---|---|---|---|---|
| Share Capital + | 0 | 19 | 19 | 19 | 19 | 19 | 19 | 19 |
| Reserves | -0 | 1,169 | 1,254 | 1,457 | 1,715 | 2,293 | 3,052 | 3,426 |
| Borrowings + | 0 | 851 | 776 | 611 | 414 | 1,972 | 871 | 912 |
| Other Liabilities + | 0 | 1,097 | 1,263 | 1,263 | 932 | 4,349 | 4,939 | 5,377 |
| Total Liabilities | 0 | 3,135 | 3,312 | 3,349 | 3,080 | 8,634 | 8,881 | 9,734 |
| Fixed Assets + | 0 | 1,306 | 1,358 | 1,429 | 1,515 | 3,426 | 3,324 | 3,408 |
| CWIP | 0 | 34 | 90 | 69 | 58 | 152 | 128 | 127 |
| Investments | 0 | 202 | 134 | 132 | 186 | 369 | 542 | 351 |
| Other Assets + | 0 | 1,593 | 1,730 | 1,719 | 1,321 | 4,687 | 4,887 | 5,848 |
| Total Assets | 0 | 3,135 | 3,312 | 3,349 | 3,080 | 8,634 | 8,881 | 9,734 |
9. TUBE INVESTMENTs–>
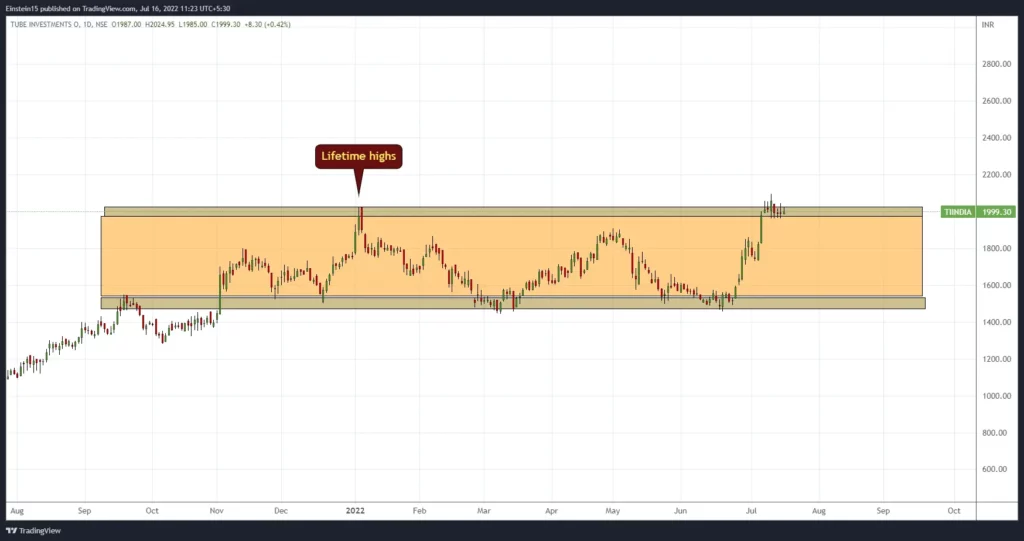
Consolidated Figures in Rs. Crores / View StandaloneCORPORATE ACTIONS
| Mar 2016 | Mar 2017 | Mar 2018 | Mar 2019 | Mar 2020 | Mar 2021 | Mar 2022 | Sep 2022 | |
|---|---|---|---|---|---|---|---|---|
| Share Capital + | 0 | 19 | 19 | 19 | 19 | 19 | 19 | 19 |
| Reserves | -0 | 1,169 | 1,254 | 1,457 | 1,715 | 2,293 | 3,052 | 3,426 |
| Borrowings + | 0 | 851 | 776 | 611 | 414 | 1,972 | 871 | 912 |
| Other Liabilities + | 0 | 1,097 | 1,263 | 1,263 | 932 | 4,349 | 4,939 | 5,377 |
| Total Liabilities | 0 | 3,135 | 3,312 | 3,349 | 3,080 | 8,634 | 8,881 | 9,734 |
| Fixed Assets + | 0 | 1,306 | 1,358 | 1,429 | 1,515 | 3,426 | 3,324 | 3,408 |
| CWIP | 0 | 34 | 90 | 69 | 58 | 152 | 128 | 127 |
| Investments | 0 | 202 | 134 | 132 | 186 | 369 | 542 | 351 |
| Other Assets + | 0 | 1,593 | 1,730 | 1,719 | 1,321 | 4,687 | 4,887 | 5,848 |
| Total Assets | 0 | 3,135 | 3,312 | 3,349 | 3,080 | 8,634 | 8,881 | 9,734 |
If you wanna learn how to invest in the stock market, click here for the courses.
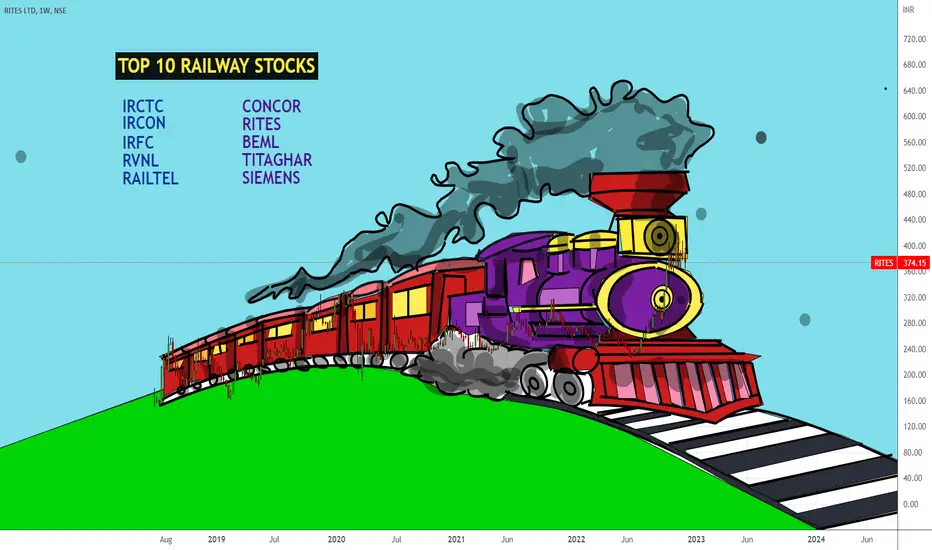
With PM-GATI-SHKTI YOJANA and the travel season, RAILWAYS appear to be doing well! A departure from their multi-year ranges. f you are an investor in the stock market tourism excites you. This article is for you.
Here is the list of top Railway stocks with fundamentals
The first one in the list
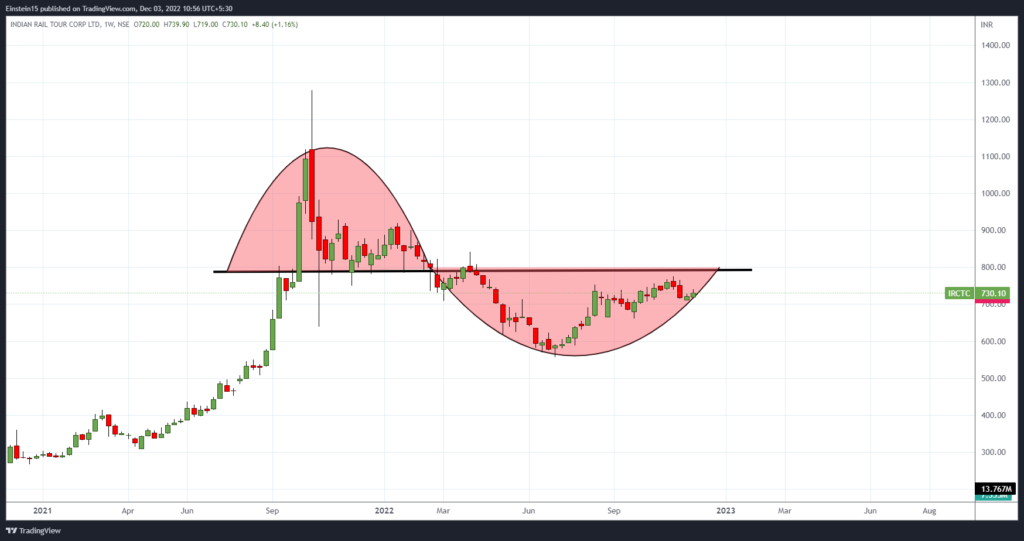
Let’s have a look at the Balance sheet of IRCTC
Figures in Rs. CroresCORPORATE ACTIONS
| Mar 2015 | Mar 2016 | Mar 2017 | Mar 2018 | Mar 2019 | Mar 2020 | Mar 2021 | Mar 2022 | Sep 2022 | |
|---|---|---|---|---|---|---|---|---|---|
| Share Capital + | 20 | 20 | 40 | 40 | 160 | 160 | 160 | 160 | 160 |
| Reserves | 424 | 522 | 747 | 915 | 911 | 1,154 | 1,296 | 1,724 | 2,078 |
| Borrowings + | 0 | 0 | 0 | 0 | 0 | 0 | 79 | 107 | 178 |
| Other Liabilities + | 718 | 895 | 1,040 | 1,365 | 1,523 | 1,928 | 1,618 | 1,847 | 2,126 |
| Total Liabilities | 1,162 | 1,437 | 1,826 | 2,319 | 2,594 | 3,241 | 3,153 | 3,837 | 4,542 |
| Fixed Assets + | 155 | 159 | 170 | 190 | 182 | 285 | 311 | 335 | 383 |
| CWIP | 16 | 14 | 17 | 8 | 40 | 16 | 24 | 26 | 31 |
| Investments | 0 | 0 | 0 | 0 | 0 | 0 | 0 | 0 | 0 |
| Other Assets + | 990 | 1,264 | 1,639 | 2,122 | 2,372 | 2,941 | 2,818 | 3,476 | 4,128 |
| Total Assets | 1,162 | 1,437 | 1,826 | 2,319 | 2,594 | 3,241 | 3,153 | 3,837 | 4,542 |
2. Titagar Wagon–> SHARE
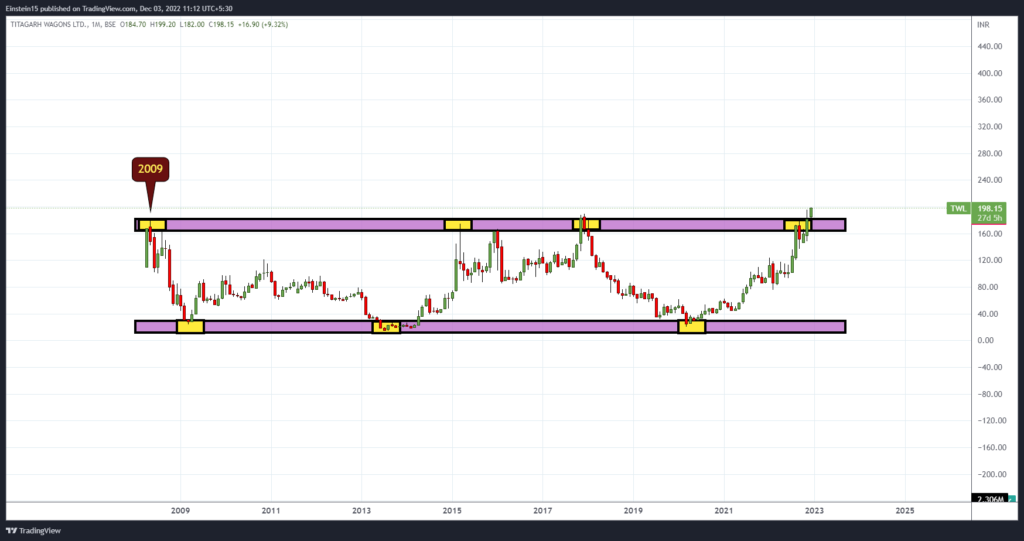
Lets look at the balance sheet of Titagarh Wagons
Consolidated Figures in Rs. Crores / View StandaloneCORPORATE ACTIONS
| Mar 2011 | Mar 2012 | Mar 2013 | Mar 2014 | Mar 2015 | Mar 2016 | Mar 2017 | Mar 2018 | Mar 2019 | Mar 2020 | Mar 2021 | Mar 2022 | Sep 2022 | |
|---|---|---|---|---|---|---|---|---|---|---|---|---|---|
| Share Capital + | 19 | 20 | 20 | 20 | 20 | 23 | 23 | 23 | 23 | 23 | 24 | 24 | 24 |
| Reserves | 546 | 644 | 656 | 642 | 669 | 930 | 944 | 832 | 793 | 743 | 812 | 818 | 859 |
| Borrowings + | 134 | 148 | 128 | 128 | 125 | 233 | 372 | 624 | 896 | 730 | 847 | 920 | 341 |
| Other Liabilities + | 246 | 235 | 278 | 289 | 246 | 1,493 | 1,356 | 1,210 | 975 | 775 | 780 | 903 | 810 |
| Total Liabilities | 945 | 1,047 | 1,082 | 1,080 | 1,060 | 2,678 | 2,695 | 2,689 | 2,687 | 2,272 | 2,462 | 2,664 | 2,033 |
| Fixed Assets + | 236 | 254 | 272 | 323 | 416 | 977 | 933 | 958 | 935 | 872 | 871 | 966 | 688 |
| CWIP | 16 | 16 | 26 | 11 | 27 | 13 | 15 | 27 | 36 | 0 | 41 | 61 | 5 |
| Investments | 3 | 33 | 33 | 33 | 1 | 21 | 82 | 83 | 87 | 29 | 31 | 30 | 30 |
| Other Assets + | 690 | 743 | 751 | 712 | 616 | 1,666 | 1,665 | 1,621 | 1,630 | 1,371 | 1,518 | 1,607 | 1,310 |
| Total Assets | 945 | 1,047 | 1,082 | 1,080 | 1,060 | 2,678 | 2,695 | 2,689 | 2,687 | 2,272 | 2,462 | 2,664 | 2,033 |
3. Concor SHARE
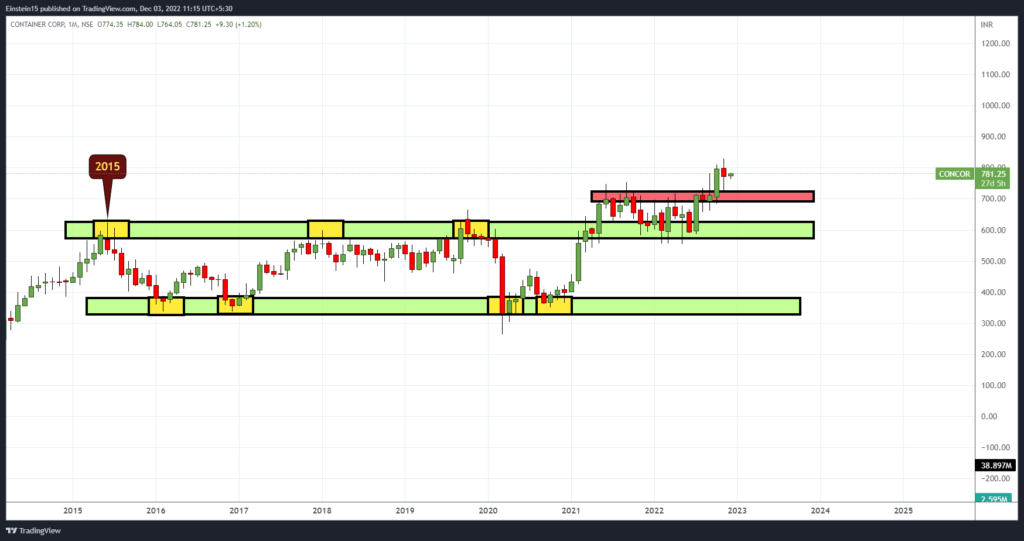
Let’s look at the fundamental of Concor
Figures in Rs. CroresCORPORATE ACTIONS
| Mar 2011 | Mar 2012 | Mar 2013 | Mar 2014 | Mar 2015 | Mar 2016 | Mar 2017 | Mar 2018 | Mar 2019 | Mar 2020 | Mar 2021 | Mar 2022 | Sep 2022 | |
|---|---|---|---|---|---|---|---|---|---|---|---|---|---|
| Share Capital + | 5.61 | 7.24 | 7.24 | 7.24 | 7.24 | 7.24 | 7.24 | 7.86 | 7.86 | 8.74 | 8.74 | 8.74 | 8.74 |
| Reserves | 2.08 | 4.00 | 5.04 | 5.38 | 6.07 | 7.82 | 11.75 | 11.46 | 15.29 | 14.74 | 18.02 | 19.62 | 19.99 |
| Borrowings + | 2.59 | 7.98 | 15.70 | 17.31 | 21.27 | 19.99 | 15.43 | 13.62 | 9.83 | 9.57 | 12.97 | 16.43 | 17.54 |
| Other Liabilities + | 4.59 | 10.78 | 13.15 | 14.75 | 19.63 | 17.44 | 21.11 | 73.48 | 49.79 | 24.96 | 10.15 | 11.66 | 7.62 |
| Total Liabilities | 14.87 | 30.00 | 41.13 | 44.68 | 54.21 | 52.49 | 55.53 | 106.42 | 82.77 | 58.01 | 49.88 | 56.45 | 53.89 |
| Fixed Assets + | 3.53 | 4.79 | 5.48 | 20.84 | 18.32 | 15.18 | 13.64 | 13.51 | 11.85 | 10.52 | 13.83 | 13.97 | 13.27 |
| CWIP | 2.79 | 3.37 | 13.84 | 0.00 | 0.00 | 0.00 | 0.00 | 0.00 | 0.29 | 1.00 | 0.00 | 0.55 | 0.65 |
| Investments | 0.00 | 0.00 | 0.00 | 0.00 | 0.00 | 0.00 | 0.00 | 0.00 | 0.00 | 0.00 | 0.00 | 0.00 | 0.00 |
| Other Assets + | 8.55 | 21.84 | 21.81 | 23.84 | 35.89 | 37.31 | 41.89 | 92.91 | 70.63 | 46.49 | 36.05 | 41.93 | 39.97 |
| Total Assets | 14.87 | 30.00 | 41.13 | 44.68 | 54.21 | 52.49 | 55.53 | 106.42 | 82.77 | 58.01 | 49.88 | 56.45 | 53.89 |
4. IRCON SHARE
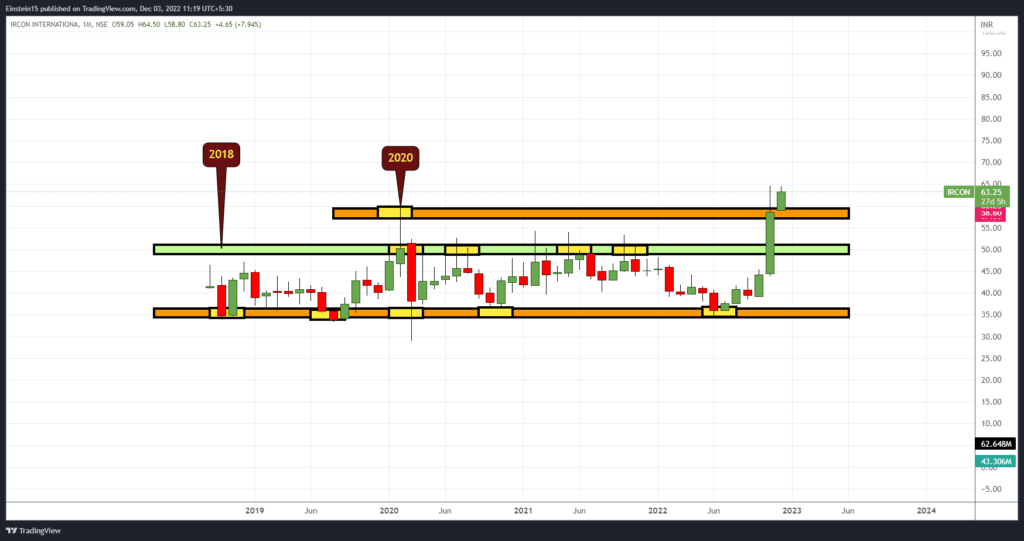
Let’s look at the balance sheet of IRCON Share
Consolidated Figures in Rs. Crores / View StandaloneCORPORATE ACTIONS
| Mar 2011 | Mar 2012 | Mar 2013 | Mar 2014 | Mar 2015 | Mar 2016 | Mar 2017 | Mar 2018 | Mar 2019 | Mar 2020 | Mar 2021 | Mar 2022 | Sep 2022 | |
|---|---|---|---|---|---|---|---|---|---|---|---|---|---|
| Share Capital + | 10 | 10 | 20 | 20 | 20 | 20 | 99 | 94 | 94 | 94 | 94 | 188 | 188 |
| Reserves | 1,369 | 1,725 | 2,462 | 2,996 | 3,285 | 3,619 | 3,718 | 3,667 | 3,870 | 4,077 | 4,309 | 4,478 | 4,746 |
| Borrowings + | 0 | 0 | 0 | 0 | 239 | 0 | 0 | 3,200 | 3,077 | 0 | 331 | 1,399 | 1,430 |
| Other Liabilities + | 3,597 | 3,571 | 3,757 | 3,197 | 3,893 | 4,500 | 5,415 | 5,810 | 6,278 | 6,009 | 6,520 | 8,382 | 8,783 |
| Total Liabilities | 4,976 | 5,306 | 6,239 | 6,213 | 7,437 | 8,139 | 9,231 | 12,771 | 13,318 | 10,181 | 11,254 | 14,446 | 15,147 |
| Fixed Assets + | 242 | 193 | 178 | 216 | 736 | 506 | 524 | 568 | 1,890 | 1,982 | 1,922 | 1,845 | 1,853 |
| CWIP | 29 | 59 | 70 | 48 | 30 | 75 | 549 | 964 | 55 | 30 | 13 | 36 | 6 |
| Investments | 180 | 203 | 245 | 434 | 496 | 487 | 781 | 784 | 809 | 803 | 850 | 971 | 1,101 |
| Other Assets + | 4,525 | 4,850 | 5,746 | 5,515 | 6,174 | 7,070 | 7,378 | 10,455 | 10,565 | 7,366 | 8,468 | 11,594 | 12,187 |
| Total Assets | 4,976 | 5,306 | 6,239 | 6,213 | 7,437 | 8,139 | 9,231 | 12,771 | 13,318 | 10,181 | 11,254 | 14,446 | 15,147 |
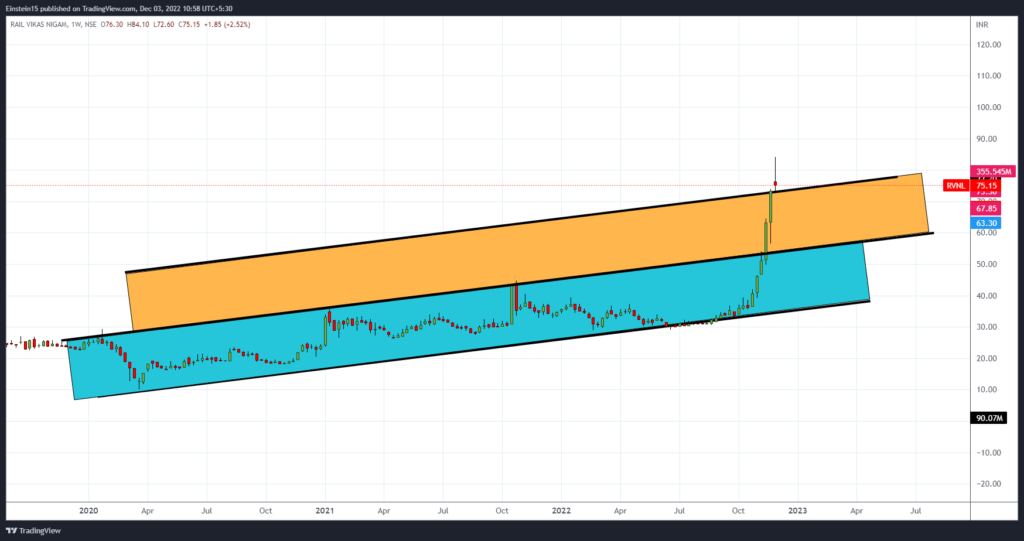
5. RVNL
Consolidated Figures in Rs. Crores / View StandaloneCORPORATE ACTIONS
| Mar 2015 | Mar 2016 | Mar 2017 | Mar 2018 | Mar 2019 | Mar 2020 | Mar 2021 | Mar 2022 | Sep 2022 | |
|---|---|---|---|---|---|---|---|---|---|
| Share Capital + | 2,085 | 2,085 | 2,085 | 2,085 | 2,085 | 2,085 | 2,085 | 2,085 | 2,085 |
| Reserves | 975 | 1,337 | 1,472 | 1,839 | 2,311 | 3,034 | 3,551 | 4,312 | 4,938 |
| Borrowings + | 2,514 | 2,624 | 2,437 | 2,259 | 3,024 | 4,257 | 5,931 | 6,643 | 6,361 |
| Other Liabilities + | 10,561 | 16,169 | 2,866 | 2,101 | 4,669 | 3,019 | 2,654 | 6,840 | 3,114 |
| Total Liabilities | 16,135 | 22,216 | 8,860 | 8,284 | 12,089 | 12,395 | 14,221 | 19,881 | 16,498 |
| Fixed Assets + | 6 | 6 | 8 | 249 | 279 | 305 | 292 | 379 | 364 |
| CWIP | 2 | 6 | 13 | 21 | 11 | 25 | 53 | 1 | 1 |
| Investments | 896 | 1,024 | 1,089 | 1,231 | 1,586 | 1,588 | 1,730 | 1,882 | 1,987 |
| Other Assets + | 15,232 | 21,180 | 7,751 | 6,783 | 10,212 | 10,476 | 12,145 | 17,618 | 14,147 |
| Total Assets | 16,135 | 22,216 | 8,860 | 8,284 | 12,089 | 12,395 | 14,221 | 19,881 | 16,498 |
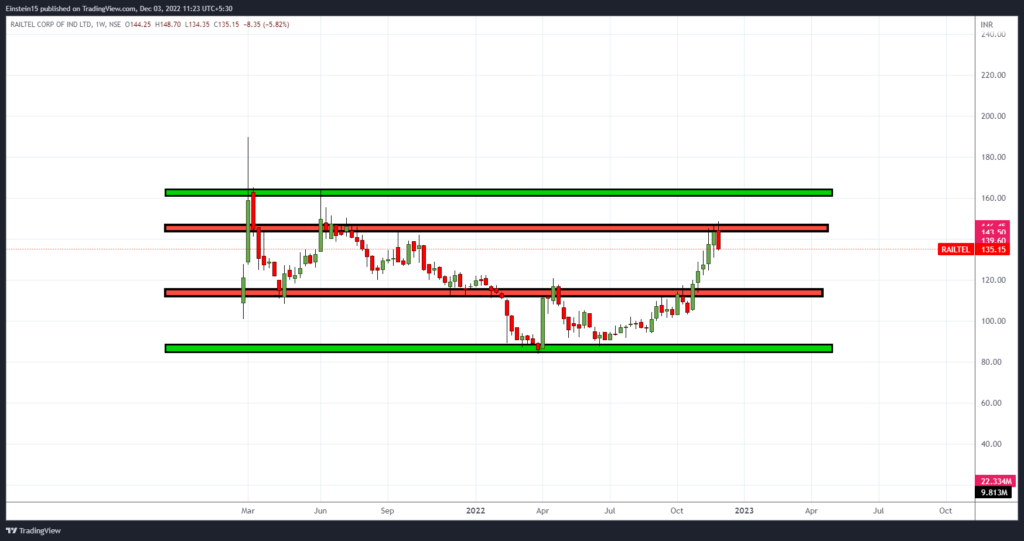
6. RAILTEL Share
Consolidated Figures in Rs. Crores / View StandaloneCORPORATE ACTIONS
| Mar 2016 | Mar 2017 | Mar 2018 | Mar 2019 | Mar 2020 | Mar 2021 | Mar 2022 | Sep 2022 | |
|---|---|---|---|---|---|---|---|---|
| Share Capital + | 321 | 321 | 321 | 321 | 321 | 321 | 321 | 321 |
| Reserves | 764 | 838 | 932 | 968 | 1,048 | 1,092 | 1,206 | 1,266 |
| Borrowings + | 0 | 0 | 0 | 5 | 43 | 0 | 0 | 30 |
| Other Liabilities + | 1,135 | 1,162 | 1,066 | 933 | 986 | 1,297 | 1,331 | 1,405 |
| Total Liabilities | 2,220 | 2,321 | 2,319 | 2,228 | 2,398 | 2,710 | 2,858 | 3,021 |
| Fixed Assets + | 711 | 694 | 688 | 790 | 789 | 760 | 775 | 765 |
| CWIP | 262 | 359 | 364 | 300 | 253 | 215 | 163 | 174 |
| Investments | 0 | 0 | 0 | 7 | 0 | 0 | 30 | 0 |
| Other Assets + | 1,247 | 1,268 | 1,267 | 1,131 | 1,356 | 1,735 | 1,890 | 2,082 |
| Total Assets | 2,220 | 2,321 | 2,319 | 2,228 | 2,398 | 2,710 | 2,858 | 3,021 |
7. SIEMENS Share
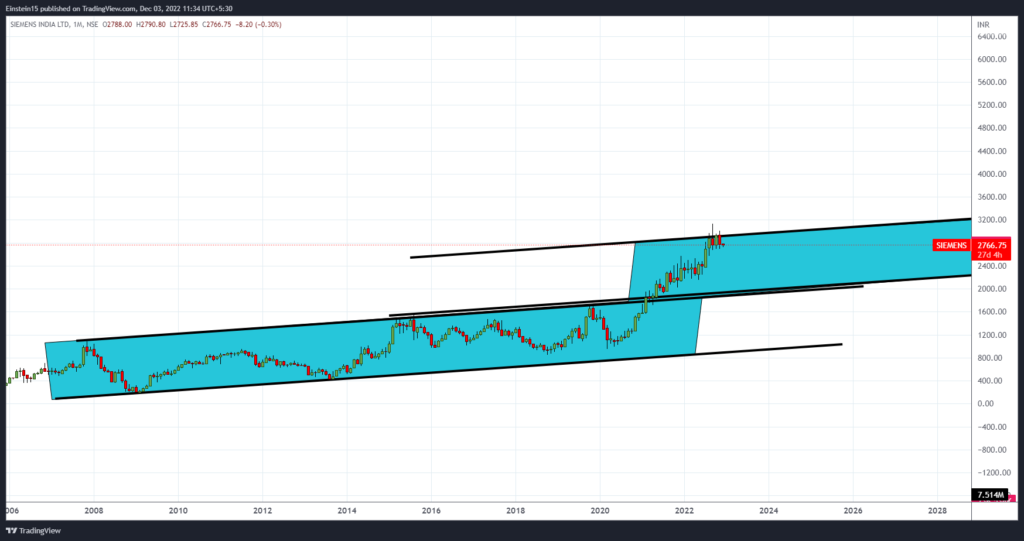
Consolidated Figures in Rs. Crores / View StandaloneCORPORATE ACTIONS
| Sep 2009 | Sep 2010 | Sep 2011 | Sep 2014 | Sep 2015 | Sep 2016 | Sep 2017 | Sep 2018 | Sep 2019 | Sep 2020 | Sep 2021 | Sep 2022 | |
|---|---|---|---|---|---|---|---|---|---|---|---|---|
| Share Capital + | 67 | 67 | 68 | 71 | 71 | 71 | 71 | 71 | 71 | 71 | 71 | 71 |
| Reserves | 2,714 | 3,212 | 3,748 | 4,304 | 5,046 | 6,732 | 7,619 | 8,228 | 8,978 | 9,421 | 10,278 | 11,539 |
| Borrowings + | 1 | 0 | 0 | 0 | 25 | 25 | 0 | 0 | 0 | 0 | 4 | 182 |
| Other Liabilities + | 5,489 | 6,038 | 6,341 | 5,915 | 5,433 | 5,157 | 5,448 | 6,037 | 6,309 | 6,368 | 7,604 | 8,317 |
| Total Liabilities | 8,271 | 9,318 | 10,158 | 10,290 | 10,576 | 11,986 | 13,138 | 14,336 | 15,358 | 15,860 | 17,958 | 20,109 |
| Fixed Assets + | 927 | 985 | 1,169 | 1,356 | 1,394 | 1,227 | 1,365 | 1,381 | 1,219 | 1,196 | 3,205 | 3,108 |
| CWIP | 162 | 255 | 249 | 41 | 32 | 79 | 143 | 62 | 58 | 88 | 35 | 51 |
| Investments | 0 | 0 | 0 | 8 | 114 | 110 | 0 | 0 | 0 | 0 | 0 | 1 |
| Other Assets + | 7,182 | 8,078 | 8,739 | 8,886 | 9,037 | 10,570 | 11,630 | 12,893 | 14,081 | 14,576 | 14,718 | 16,949 |
| Total Assets | 8,271 | 9,318 | 10,158 | 10,290 | 10,576 | 11,986 | 13,138 | 14,336 | 15,358 | 15,860 | 17,958 | 20,109 |
8. TEXMACO Rail
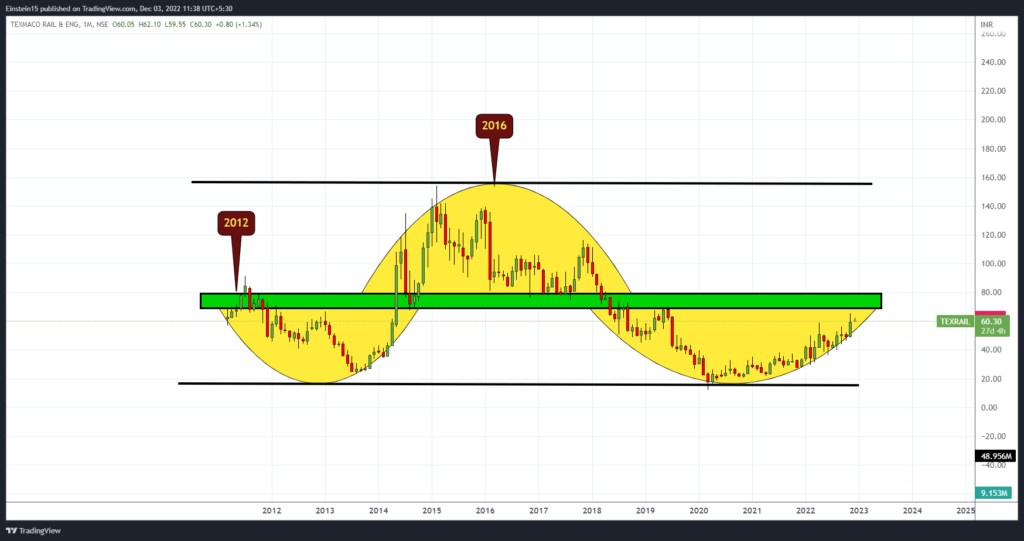
Standalone Figures in Rs. Crores / View ConsolidatedCORPORATE ACTIONS
| Mar 2011 | Mar 2012 | Mar 2013 | Mar 2014 | Mar 2015 | Mar 2016 | Mar 2017 | Mar 2018 | Mar 2019 | Mar 2020 | Mar 2021 | Mar 2022 | Sep 2022 | |
|---|---|---|---|---|---|---|---|---|---|---|---|---|---|
| Share Capital + | 18 | 18 | 18 | 18 | 21 | 22 | 22 | 22 | 22 | 22 | 25 | 32 | 32 |
| Reserves | 418 | 490 | 563 | 574 | 872 | 987 | 1,023 | 1,050 | 1,118 | 1,005 | 1,115 | 1,294 | 1,287 |
| Borrowings + | 97 | 71 | 102 | 102 | 107 | 335 | 324 | 522 | 587 | 760 | 779 | 710 | 887 |
| Other Liabilities + | 345 | 489 | 385 | 324 | 348 | 521 | 454 | 657 | 979 | 1,098 | 723 | 626 | 832 |
| Total Liabilities | 878 | 1,068 | 1,067 | 1,018 | 1,348 | 1,865 | 1,823 | 2,251 | 2,706 | 2,887 | 2,642 | 2,662 | 3,038 |
| Fixed Assets + | 105 | 103 | 113 | 160 | 206 | 228 | 246 | 344 | 365 | 409 | 378 | 361 | 359 |
| CWIP | 2 | 37 | 55 | 48 | 5 | 4 | 2 | 5 | 10 | 4 | 4 | 2 | 4 |
| Investments | 262 | 313 | 319 | 317 | 610 | 544 | 502 | 253 | 143 | 100 | 128 | 71 | 93 |
| Other Assets + | 510 | 615 | 580 | 492 | 527 | 1,088 | 1,073 | 1,647 | 2,189 | 2,375 | 2,132 | 2,227 | 2,582 |
| Total Assets | 878 | 1,068 | 1,067 | 1,018 | 1,348 | 1,865 | 1,823 | 2,251 | 2,706 | 2,887 | 2,642 | 2,662 | 3,038 |
9. IRFC SHARE
Figures in Rs. CroresCORPORATE ACTIONS
| Mar 2012 | Mar 2013 | Mar 2014 | Mar 2015 | Mar 2016 | Mar 2017 | Mar 2018 | Mar 2019 | Mar 2020 | Mar 2021 | Mar 2022 | Sep 2022 | |
|---|---|---|---|---|---|---|---|---|---|---|---|---|
| Share Capital + | 2,102 | 2,352 | 3,352 | 3,584 | 4,526 | 6,526 | 6,526 | 9,380 | 11,880 | 13,069 | 13,069 | 13,069 |
| Reserves | 3,049 | 3,442 | 3,978 | 4,555 | 4,999 | 5,483 | 7,402 | 15,648 | 18,419 | 22,845 | 27,928 | 30,481 |
| Borrowings + | 50,251 | 58,753 | 69,917 | 71,270 | 87,503 | 106,395 | 134,006 | 173,933 | 234,377 | 323,145 | 388,440 | 386,733 |
| Other Liabilities + | 4,674 | 6,208 | 6,683 | 8,238 | 11,372 | 11,245 | 13,534 | 7,642 | 10,828 | 21,423 | 20,544 | 34,915 |
| Total Liabilities | 60,076 | 70,755 | 83,930 | 87,647 | 108,400 | 129,650 | 161,468 | 206,604 | 275,504 | 380,482 | 449,980 | 465,198 |
| Fixed Assets + | 13 | 13 | 13 | 12 | 12 | 12 | 11 | 11 | 11 | 45 | 38 | 31 |
| CWIP | 0 | 0 | 0 | 0 | 0 | 0 | 0 | 0 | 0 | 0 | 0 | 0 |
| Investments | 15 | 13 | 11 | 9 | 8 | 8 | 14 | 13 | 12 | 12 | 10 | 10 |
| Other Assets + | 60,048 | 70,729 | 83,906 | 87,626 | 108,381 | 129,630 | 161,443 | 206,579 | 275,482 | 380,424 | 449,932 | 465,157 |
| Total Assets | 60,076 | 70,755 | 83,930 | 87,647 | 108,400 | 129,650 | 161,468 | 206,604 | 275,504 | 380,482 | 449,980 | 465,198 |
10. RITES Share price
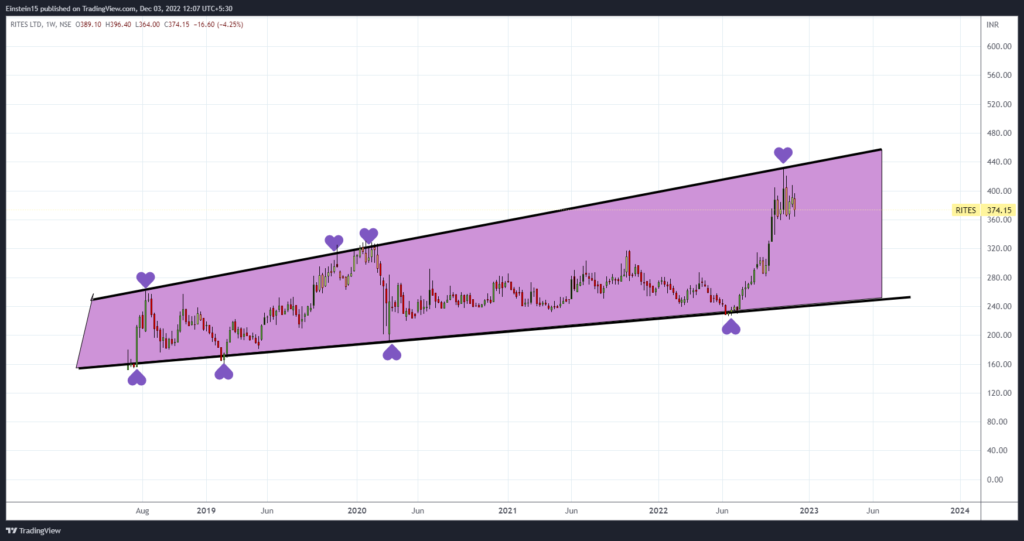
Consolidated Figures in Rs. Crores / View StandaloneCORPORATE ACTIONS
| Mar 2014 | Mar 2015 | Mar 2016 | Mar 2017 | Mar 2018 | Mar 2019 | Mar 2020 | Mar 2021 | Mar 2022 | Sep 2022 | |
|---|---|---|---|---|---|---|---|---|---|---|
| Share Capital + | 100 | 100 | 100 | 200 | 200 | 200 | 250 | 240 | 240 | 240 |
| Reserves | 1,325 | 1,576 | 1,707 | 1,838 | 2,014 | 2,222 | 2,383 | 2,152 | 2,248 | 2,342 |
| Borrowings + | 0 | 0 | 173 | 83 | 55 | 48 | 47 | 37 | 28 | 7 |
| Other Liabilities + | 2,211 | 1,929 | 2,531 | 2,678 | 2,901 | 2,956 | 3,262 | 3,408 | 3,326 | 3,151 |
| Total Liabilities | 3,636 | 3,605 | 4,511 | 4,799 | 5,170 | 5,426 | 5,943 | 5,837 | 5,842 | 5,740 |
| Fixed Assets + | 198 | 212 | 476 | 406 | 402 | 478 | 590 | 584 | 560 | 553 |
| CWIP | 20 | 26 | 34 | 5 | 2 | 4 | 4 | 15 | 58 | 76 |
| Investments | 228 | 226 | 220 | 328 | 133 | 141 | 261 | 289 | 205 | 219 |
| Other Assets + | 3,190 | 3,141 | 3,781 | 4,060 | 4,633 | 4,803 | 5,088 | 4,948 | 5,020 | 4,891 |
| Total Assets | 3,636 | 3,605 | 4,511 | 4,799 | 5,170 | 5,426 | 5,943 | 5,837 | 5,842 | 5,740 |
That was the list of top Railway stocks in India listed on the NSE AND BSE. If you wanna learn how to find stocks like these, take our fee demo class.
New Delhi: Fusion Micro Finance met the expectations of traders. Affinity Micro Finance Ltd. 324.80-43.20 (-11.74%) TOP INSIGHT Today’s stock price touched a new 52-week low. to view more close Tuesday’s Dalal Street debut of NSE -11.74% was subdued.

The young microfinance player’s stock was listed at a discount of 2% to its issue price of Rs 368 per share, at Rs 359.50 on the National Stock Exchange (NSE) and at Rs 360.50 on the BSE.
The loss for investors increased to more than 7% as the scrip fell another 5% to Rs 341.10, aggravating the pain in the counter.
According to analysts, only high-risk investors should hold the stock in the short- to medium-term, while everyone else should book their losses and sell.
“The company’s margins are still on the decline, and the category of borrowers it caters to poses a risk. Concerns for the business could also arise from an increase in NPAs “Added he. “Applicants for listing gains may continue to hold a stop loss of Rs. 340.”
Fusion Micro Finance’s initial public offering (IPO) was open for subscription from November 2 to 4, during which the company sold its shares for between Rs 350 and Rs 368 each in order to raise Rs 1,104 crore through an initial stake sale.
The issue was subscribed 2.95 times overall, with an 8.6 times subscription for the quota for qualified institutional bidders and a 1.38 times subscription for the HNI portion. Only 51% of the retail investor portion was subscribed.
He continued, “Investors who applied for the shares only to profit from the listing can book at the listing price, while others can hold for a mid-to-long-term.
Fusion Micro Finance, a 1994 corporation, specializes in offering financial services to women business owners who come from economically and socially disadvantaged areas of society.
It has a network of 966 branches, 9,262 permanent employees, and 2.90 million active borrowers spread across 377 districts, 19 states, and union territories.
Investors should invest in other pre-listed financial players or lenders, according to Ravi Singhal, CEO of GCL Securities. Investors should exit at listing, he suggested.
Prior to Fusion Micro Finance’s listing today, CRISIL’s Ratings upgraded its long-term rating on its bank facilities and non-convertible debentures to “CRISIL A/Stable” from “CRISIL A-/Stable.”
To know more about the fundamentals of the stock, click here … To learn more about the stock market courses 2021 , click here
Zim Laboratories Ltd. is a small-cap company that operates in the pharmaceutical sector with a market valuation of $509.10 Cr. The company also provides finished formulations (FF) and pre-formulation intermediates (PFI) for a number of important therapeutic categories in addition to developing, producing, and delivering unusual generic pharmaceuticals in oral solid doses. A 2:1 bonus share issuance was announced along with the company’s Q2 earnings.
Whether bonus shares are issued from share premium accounts or free reserves made from profits, the bonus shares will be issued from the securities premium accounts available as of March 31, 2022.
Bonus Ratio: 2:1, or 2 (two) equity shares worth Rs. 10 each for every 1 (one) equity share worth Rs. 10 each that has been fully paid up. Paid-up Pre-Bonus Issue 16,24,19,380 rupees worth of equity shares are divided into 1,62,41,938 shares, each worth 10 rupees. Paid-up Post-Bonus Issue 4,87,25,814 equity shares worth Rs. 10 each make up the share capital of Rs. 48,72,58,140.
Required Free Reserves and/or Share Premium for the Bonus Issue: Rs. 32,48,38,760 would be capitalized from the Securities Premium Account for the issuance of Bonus Shares.
In Q2FY23, the company reported total expenses of 92.54 crores, up from 73.68 crores in Q2FY22, a YoY increase of 25.59%. In Q2FY23, the company reported a profit before tax (PBT) of $8.15 million, up from Q2FY22’s PBT of $2.92 million, a YoY gain of 179.10 percent. In comparison to the net profit of 2 Cr reported in Q2FY22, the company reported a net profit of 5.65 Cr in Q2FY23, an increase of 182.50% YoY. In Q2FY23, the EPS increased to $3.49 per share from $1.24 in Q2FY22 and $3.47 in Q1FY23.
Click here to see more fundamentals on the screener app. To learn more about the courses, click here
Separately, the company reported net sales of 99.26 crores in Q2FY23 compared to 75.72 crores in Q2FY22, an increase of 31.08% year over year. In the three months that ended in September 2022, the company reported a net income of $100.70 Cr, up from the 76.61 Cr reported in the same period the previous year. This represents a YoY growth of 31.44%.
On a consolidated basis, the company reported net sales of 99.40 crores in the second quarter of FY23, up from 77.47 crores in the same quarter of FY22, or a YoY increase of 28.30%. In comparison to the 78.34 Cr reported in Q2FY22, the company reported a total income of $100.82 Cr, representing a YoY growth of 286.90%. In Q2FY23, the company reported total expenses of 92.86 crores, up from the 74.14 crores reported in Q2FY22, a YoY gain of 25.24%. In Q2FY23, the company reported a PBT of $7.95 million, up from the $4.20 million reported in Q2FY22, a YoY increase of 89.28%.
Zim Laboratories Ltd.’s shares ended trading on Friday at 313.50 per share, up 0.064% from the previous close of 313.30. Over the last five years, the stock has generated a multi-bagger return of 146.40%, and over the last three years, a multi-bagger return of 282.49%. Over the past year, the stock has produced a multi-bagger return of 150.90%, and YTD in 2022, it has done so with a multi-bagger return of 163.56%.
How to check Divis lab share price – Pharmaceuticals company. Learn why the price of Divis lab is falling. Should you buy, hold or sell this stock?
Before we get started, if you are interested in checking out the fundamentals of the stock, you can check it on the screener app. To learn more about our stock market courses, click here.
Now the main reason for the slum of the Divis lab is Q2 PAT which decreased 18% YOY to rs 493 cr from Rs 606.46 crore.
Profit before taxes fell 19.01% to Rs 615.22 crore in Q2 FY23, from Rs 759.62 crore in Q2 FY22.
During the quarter under review, total expenses increased by 5.81% year on year to Rs 1,319.40 crore. In Q2 FY23, the cost of materials consumed decreased by 6.79% year on year to Rs 817.01 crore, while employee benefit costs increased by 3.63% year on year to Rs 232.12.
In Q2 FY23, the company’s net profit fell 19.71% to Rs 486.85 crore on a 7.34% drop in revenue from operations to Rs 1,823.38 crore compared to Q2 FY22.
Overall, Divis lab share price is trading close to its intrinsic value of 2772. However, quite far from its book value of 457.
Currently, the price of the share as of Nov 7, 2022, CMP is 3415. Let’s look at the fundamentals of the stock. Looking at ts shareholding atter.
Numbers in percentage deals / TRADES
16 recently
| Dec 2019 | Mar 2020 | Jun 2020 | Sep 2020 | Dec 2020 | Mar 2021 | Jun 2021 | Sep 2021 | Dec 2021 | Mar 2022 | Jun 2022 | Sep 2022 | |
|---|---|---|---|---|---|---|---|---|---|---|---|---|
| Promoters + | 52.00 | 51.97 | 51.97 | 51.96 | 51.95 | 51.95 | 51.95 | 51.95 | 51.95 | 51.94 | 51.94 | 51.94 |
| FIIs + | 19.70 | 19.08 | 18.17 | 18.28 | 20.37 | 19.87 | 20.60 | 20.70 | 19.30 | 18.45 | 16.52 | 15.40 |
| DIIs + | 15.47 | 15.59 | 16.80 | 18.80 | 16.86 | 16.74 | 16.56 | 16.36 | 17.73 | 18.32 | 19.98 | 20.75 |
| Government + | 0.00 | 0.00 | 0.00 | 0.00 | 0.00 | 0.00 | 0.00 | 0.00 | 0.00 | 0.00 | 0.00 | 0.03 |
| Public + | 12.83 | 13.35 | 13.07 | 10.96 | 10.83 | 11.45 | 10.89 | 11.00 | 11.02 | 11.28 | 11.56 | 11.88 |
Let’s look at the major reason for the fall of this share.
Consolidated Figures in Rs. Crores / View Standalone
| Sep 2019 | Dec 2019 | Mar 2020 | Jun 2020 | Sep 2020 | Dec 2020 | Mar 2021 | Jun 2021 | Sep 2021 | Dec 2021 | Mar 2022 | Jun 2022 | Sep 2022 | |
|---|---|---|---|---|---|---|---|---|---|---|---|---|---|
| Sales + | 1,446 | 1,396 | 1,390 | 1,730 | 1,749 | 1,701 | 1,788 | 1,961 | 1,988 | 2,493 | 2,518 | 2,255 | 1,855 |
| Expenses + | 955 | 902 | 945 | 1,030 | 1,008 | 1,010 | 1,072 | 1,109 | 1,169 | 1,396 | 1,414 | 1,408 | 1,234 |
| Operating Profit | 491 | 494 | 444 | 700 | 741 | 691 | 716 | 852 | 818 | 1,097 | 1,104 | 847 | 621 |
| OPM % | 34% | 35% | 32% | 40% | 42% | 41% | 40% | 43% | 41% | 44% | 44% | 38% | 33% |
| Other Income + | 47 | 42 | 77 | 17 | 14 | 19 | 24 | 36 | 19 | 17 | 52 | 88 | 80 |
| Interest | 4 | 2 | 0 | 0 | 0 | 0 | 0 | 0 | 0 | 0 | 0 | 0 | 0 |
| Depreciation | 46 | 47 | 50 | 56 | 61 | 68 | 70 | 73 | 77 | 80 | 81 | 84 | 86 |
| Profit before tax | 488 | 487 | 471 | 661 | 693 | 642 | 669 | 814 | 760 | 1,034 | 1,076 | 851 | 615 |
| Tax % | 27% | 26% | 18% | 26% | 25% | 27% | 25% | 32% | 20% | 13% | 17% | 18% | 20% |
| Net Profit | 357 | 359 | 388 | 492 | 520 | 471 | 502 | 557 | 606 | 902 | 895 | 702 | 494 |
| EPS in Rs | 13.44 | 13.53 | 14.62 | 18.54 | 19.57 | 17.73 | 18.91 | 20.99 | 22.84 | 33.99 | 33.70 | 26.44 | 18.59 |
If you have a position in this share, you can hold this share. The company is overall profitable.