Learning sharks-Share Market Institute


Rajouri Garden  8595071711 7982037049  Noida 8920210950 , and  Paschim Vihar  7827445731  

Fee revision notice effective 1st April 2025; No change for students enrolled before 15th May 2025

Download “Key features of Budget 2024-2025here

Stock Market jobs 2023 l Technical analyst, Research analyst, Option strategist, and more

Stock Market jobs 2023 l Technical analyst, Research analyst, Option strategist, equity dealer, senior relation ship manager

If you are looking for stock market jobs and want to make a career in the stock market as freshers, Use this link here to apply

What is a Technical analyst job?

For the business they work for, a technical analyst, also known as a market technician, is in charge of analysing the stock market and investment opportunities. They are responsible for researching potential investment opportunities, forecasting potential investment returns, and analysing the stock market. For technical analyst job Use this link here

What does a Technical Analyst do?

Businesses that use the stock market and other types of investment opportunities as a means of capital growth are frequently those that employ technical analysts. Technical analysts apply their knowledge to assist business executives in choosing the best investments for the company’s money in order to maximize growth or protection. The majority of a technical analyst’s time is typically spent analysing market indicators to aid in the creation of reports and presentations for their employers.

What is a Market research analyst?

Market research analysts are primarily responsible for gathering and compiling consumer and competitor data for businesses. Analysts analyse this data to offer their employers or clients insightful information. To assist a buyer in making an investment decision in the stock market, a research analyst may look into the performance history of a company or its stock.

Additionally, they might conduct research to support businesses through operations like IPOs and expansion (Initial Public Offerings). Equity and stock frequently exhibit characteristics of goods or commodities, the performance of which is influenced by supply and demand factors. Using their knowledge of these market forces, market research analysts create carefully curated investment portfolios and financial strategies to successfully navigate a market at any given time.

For a Market research analyst job, Use this link here

What is an Equity dealer?

Dealers’ main responsibilities include purchasing, holding, and selling equity on a stock exchange. To make a profit, they try to buy stock before demand spikes and sell it to interested buyers at higher prices. A dealer conducts transactions for their own benefit and financial gain. On the other hand, a broker merely arranges these transactions in order to earn a commission. A dealer operates as a business and typically has a larger scale of operations, which is the difference between dealers and traders.

For instance, a trader might buy 100 shares of a stock, sell them all for a small profit, and then decide whether to reinvest the money or take it out. In contrast, a dealer purchases a much larger quantity of the stock (such as 10,000 shares) and engages in transactions with numerous traders and buyers in order to make a much larger profit. This profit may be used primarily for new investments and the acquisition of equity.

For an equity dealer job, Use this link here

What is a trader?

Primary responsibilities: Stock market traders are people who frequently buy and sell stocks and other securities in order to make money. To maximise profits, they strategize, pinpoint entry and exit points for share values, and execute the required transactions. They operate differently than investors because they aim to profit financially from momentary changes in the market. In order to maximise their profits, investors typically employ long-term financial strategies and start with larger starting capital than traders. Trading has enormous earning potential but comes with a lot of risk.

What is an Investment consultant?

Investment consultants’ main responsibility is to advise clients on sound investment choices using their understanding of equity and market trends. Depending on their investment strategy, investors may anticipate either short-term or long-term financial gains. Investment advisors are aware of their client’s particular financial objectives and provide useful information on stock prices, stock performance, company reputation, and performance history. They assist investors in gaining a deeper comprehension of their financial situation and the effects of their choices. To evaluate clients’ investment plans, they might work alone or with banks or other financial institutions.

For an Investment consultant job, Use this link here

What is a Financial analyst?

Financial analysts’ main responsibilities include gathering, organizing, and interpreting financial data in order to produce forecasts, monitor metrics, and develop simulations or financial models. Analysts are frequently needed by businesses to assist in making important financial decisions. Before making significant investments, analysts offer their clients insights and inferences to help them gain a thorough understanding of market scenarios. Professionals in this field may work alone or as regular members of a company’s staff.

For a Financial analyst job, Use this link here

What is a fundamental analyst?

Fundamental analysts are experts who conduct an in-depth analysis of a business, a stock, or a market to identify the inherent value or risks related to financial decisions and transactions. To produce these insights, they may analyze a variety of variables and indicators, such as financial stability, growth potential, total capital, return on equity, and profit margins.

For fundamental analyst job, Use this link here

What is a risk analyst?

Risk analysts’ main responsibilities include assisting businesses and clients in determining the financial and practical consequences of important commercial decisions. They research market trends and clients’ financial records on behalf of businesses to assess the risks associated with doing business with them. Their knowledge is frequently needed in the stock market when businesses or investors want to drastically alter their holdings or portfolios. Before offering advice, risk analysts carefully consider the advantages and disadvantages of a business situation in order to paint an objective picture.

FOr risk analyst job, Use this link here

what is an Investment banker?

Primary responsibilities: Investment banking is a branch of banking operations that enables businesses or individual investors to raise capital and resources for operations. Experts in economics and finance, working in this field development plans and plans of action to assist clients in achieving their financial objectives. They might serve as a consultant and give guidance, or they might even serve as a middleman to help transactions proceed according to a methodical pre-planned strategy.

For an Investment banker job, Use this link here

Anlon Technology Solutions: Share price gives 150% return on debut- Fire Rescue Company

The stock increased by another 5% to Rs 263.65 during its first trading session on Tuesday, bringing the overall gains to 166% over the stated issue price of Rs 100.

It offers services such as airport rescue and fire fighting vehicles, high-rise building rescue, evacuation, and fire-fighting equipment, industrial fire engines, runway rubber removal, and paint removal machines, runway sweeping, and bay cleaning, among others.

Anlon Technology Solutions, the newest Dalal Street debutant, gave its investors a strong listing pop of 150% on Tuesday. Even in the SME market, it is one of the best listing pops in the near future.

Anlon Technology Solutions, which made its debut on the NSE’s SME platform, reached a settlement price of Rs 250 per share on Tuesday, increasing by 150% over its initial offering price of Rs 100 per share.

The stock increased by another 5% to Rs 263.65 during its first trading session on Tuesday, bringing the overall gains to 166% over the stated issue price of Rs 100.

Anlon Technology Solutions’ initial public offering (IPO) was open for subscription between December 29, 2022, and January 2, 2023. The company sold its shares for between Rs 95 and Rs 100 each in order to raise Rs 15 crore.

Let’s look at the fundamentals of the stock.

Profit & Loss

Figures in Rs. Crores

Mar 2020Mar 2021Mar 2022
Sales +13.6914.3519.34
Expenses +12.6713.0715.23
Operating Profit1.021.284.11
OPM %7.45%8.92%21.25%
Other Income +0.130.090.25
Interest0.070.140.75
Depreciation0.130.190.20
Profit before tax0.951.043.41
Tax %28.42%29.81%28.74%
Net Profit0.690.742.43
EPS in Rs690.00740.002,430.00
Dividend Payout %0.00%0.00%0.00%

Balance Sheet

Figures in Rs. CroresCORPORATE ACTIONS

Mar 2020Mar 2021Mar 2022
Share Capital +0.010.010.01
Reserves1.712.454.88
Borrowings +0.181.615.81
Other Liabilities +9.1511.4610.27
Total Liabilities11.0515.5320.97
Fixed Assets +1.731.593.87
CWIP0.000.000.00
Investments0.000.000.00
Other Assets +9.3213.9417.10
Total Assets11.0515.5320.97
The balance sheet of Anlon technology

The issue received a whopping 428.6 subscriptions, with the non-institutional bidder allocation receiving 883.58 subscriptions and the retail bidder quota receiving 447.06 subscriptions. It was reserved 54.53 times for institutions that met the criteria.

Each lot in the issue cost Rs 1.2 lakh and had a fixed lot size of 1,200 shares. Each lot at listing cost Rs 3 lakh, giving the investors who received the share allocation a profit of Rs 1.8 lakh.

Conclusion

Overall, the company seems to be doing good in terms of profitability. One can make this stock a part of their portfolio for the long term. However, it is advised to wait for the stock to find it support and resistance.

This is purely for educational purposes. If you are interested in the stock market courses, you can visit our courses page.

#anlontechnologyshareprice #latestshareprice #stockmarket #sharemarket

This finance holding company rose 5% today, should you invest in this? Click to read the Latest share news in 2023

stock market chart patterns

If you missed the previous buying call then check out this breakout. The finance holding company which rose 5% today is none other than one of the optimistic LT finance holdings limited companies

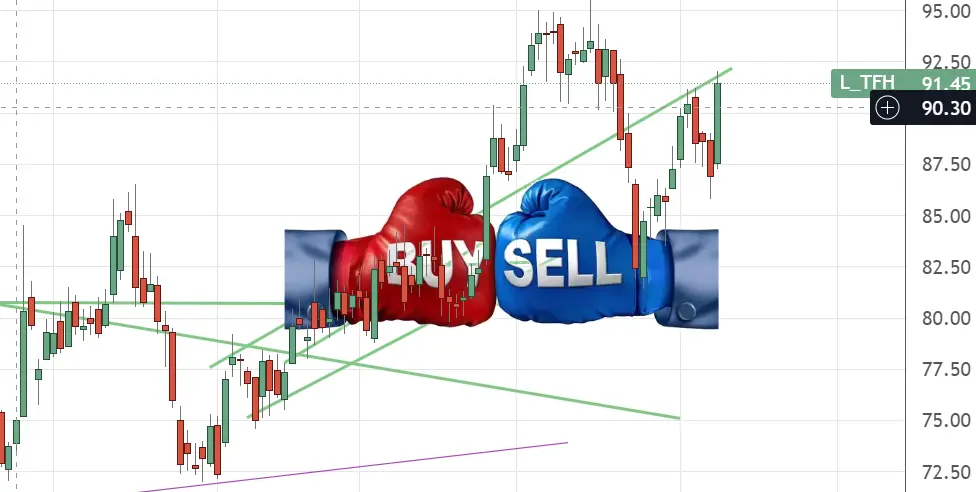
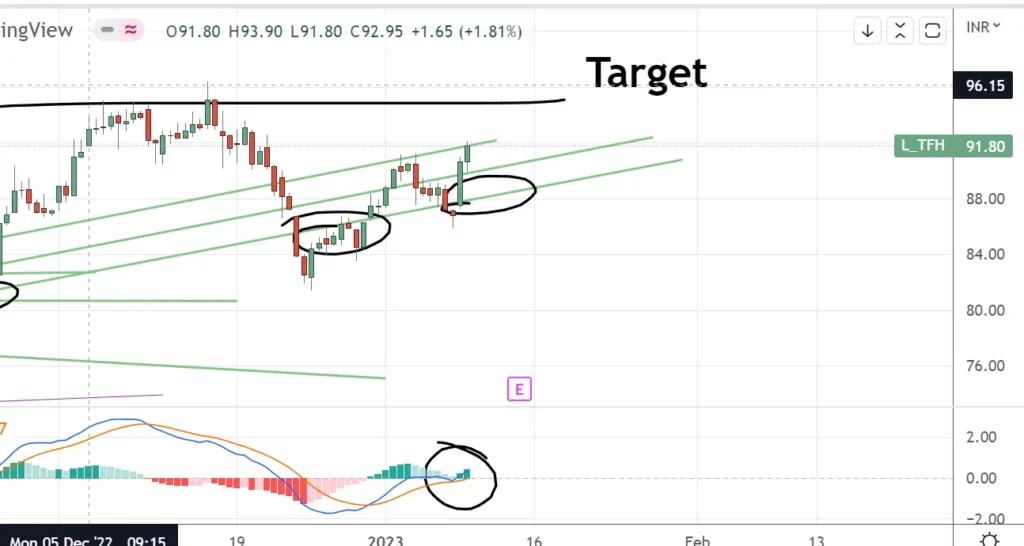
The CMP of the share is 91.80 INR+4.90 (5.64%)today. The stock has broken its resistance and is currently trading in the above resistance area. According to the technicals of the stock. L&T finance holdings is a buy with targets of up to 20%.

Let’s look at the technicals of this stock on the chart.

Overall, according to the Support resistance, and MACD. it’s a Buy. However, let’s look at the fundamentals of this stock too.

Profit & Loss

Consolidated Figures in Rs. Crores / View StandalonePRODUCT SEGMENTS

Mar 2011Mar 2012Mar 2013Mar 2014Mar 2015Mar 2016Mar 2017Mar 2018Mar 2019Mar 2020Mar 2021Mar 2022TTM
Sales +2,1143,0043,9905,2216,4567,4408,53210,21513,36514,10413,35311,93012,044
Expenses +4215391,0251,2301,6251,9792,7763,3083,3774,1605,4015,2335,152
Operating Profit1,6932,4642,9653,9914,8315,4615,7566,907
9,9447,9526,6976,892
OPM %80%82%74%76%75%73%67%68%75%70%60%56%57%
Other Income +-9-13419-51682649-4370836594703
Interest1,0211,7072,3303,0813,5774,1334,6355,4586,8827,5527,2305,7655,651
Depreciation5960658096836752508286103106
Profit before tax6046849898251,1751,2531,0791,4463,0522,6801,4721,4231,838
Tax %35%34%26%28%28%32%3%12%27%37%36%26%
Net Profit3914557305958558571,0481,2782,2321,7009491,0491,316
EPS in Rs2.163.462.824.043.974.835.119.066.903.934.335.40
Dividend Payout %0%0%18%22%16%16%13%16%9%11%0%12%
Profit and loss of L&t finance holding

Balance Sheet

Consolidated Figures in Rs. Crores / View StandaloneCORPORATE ACTIONS

Mar 2011Mar 2012Mar 2013Mar 2014Mar 2015Mar 2016Mar 2017Mar 2018Mar 2019Mar 2020Mar 2021Mar 2022Sep 2022
Share Capital +1,4171,7152,4672,7183,0842,9672,9691,9961,9992,0052,4692,4742,476
Reserves1,4743,0383,7534,1074,6565,3246,0209,41111,45012,68816,30417,47417,955
Borrowings +15,90121,07728,24735,85442,09151,61659,81175,24891,50793,93488,59285,23785,387
Other Liabilities +7841,1032,8523,1824,2755,1074,9241,1171,0949021,5821,6961,837
Total Liabilities19,57726,93336,57044,86152,74263,79972,51187,772106,050109,529108,947106,880107,655
Fixed Assets +4765201,1311,2281,1841,3131,2301,1511,1271,1001,138509530
CWIP183389140174222819396224220
Investments7327701,8432,7302,6493,5636,0125,3018,6415,9798,87211,91711,135
Other Assets +18,35025,61033,50740,76348,73658,90165,24281,30196,243102,38798,91294,43395,990
Total Assets19,57726,93336,57044,86152,74263,79972,51187,772106,050109,529108,947106,880107,655
A balance sheet of L&T finance holding

Shareholding Pattern

Numbers in percentages DEALS / TRADES

4 recently

Dec 2019Mar 2020Jun 2020Sep 2020Dec 2020Mar 2021Jun 2021Sep 2021Dec 2021Mar 2022Jun 2022Sep 2022
Promoters +63.8663.7263.7263.6763.6563.6263.5963.5363.5066.2666.2366.20
FIIs +12.4910.609.377.079.3610.608.798.257.866.916.616.75
DIIs +4.445.225.454.985.275.886.576.576.114.575.345.35
Public +19.2120.4621.4624.2821.7219.9121.0521.6622.5322.2621.8221.69
Shareholding pattern l&t finance holding pattern

CONCLUSION

Overall, the stock is under the buying zone. We recommend any new investors add this to their portfolio. However, this is an education opinion, not a professional call. If you wanna learn more about our stock market courses, then visit our courses section.

PFC share price – Breakout after 5 years with high volumes- Latest Post 2023

Pfc share analysis - Latest stock market post 2023

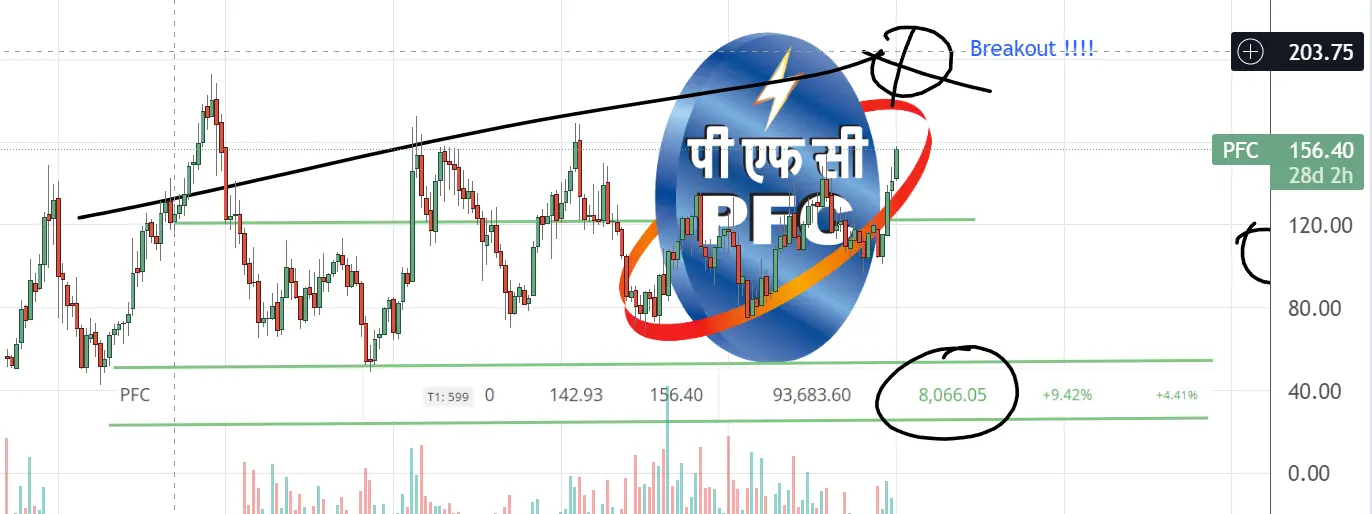
The stock has increased by 51% over the last six months, compared to the S&P BSE Sensex’s 8% gain. Power Finance Corporation (PFC) shares increased 5% intraday on the National Stock Exchange (NSE) on Tuesday amid high volumes, reaching a high of over five years at Rs 157.80. The share price of a publicly traded financial institution reached its highest level since May 2017.

Here’s our current position in PFC share corporation after the breakout from last week.

Let’s look at the Technical analysis of this stock and try to create some support and resistance 4 hours time frame.

PFC Share price 2023
PFC share price CMMP 156. Stock will eventually come down in a shorter time frame to retest the resistance price of 150.

PFC Share chart weekly

PFC Share price 2023 analysis

The stock has broken its resistance but will come back to restest it, so you can start accumulating this stock in smaller quantities. Now that we have looked at the Technical of the stocks. Let’s talk about the fundamentals of PFC corporation.

Profit & Loss

Consolidated Figures in Rs. Crores / View Standalone

Mar 2011Mar 2012Mar 2013Mar 2014Mar 2015Mar 2016Mar 2017Mar 2018Mar 2019Mar 2020Mar 2021Mar 2022TTM
Revenue10,17813,09217,31421,40724,98827,86127,58148,62454,10662,18971,65676,26275,897
Interest6,4268,59510,99513,05315,45616,65716,76830,28934,62740,84544,68444,70944,411
Expenses +1973513317481,1032,0425,5386,5831,6967,3327,1028,2157,881
Financing Profit3,5554,1465,9877,6078,4299,1625,27511,75217,78314,01219,87123,33823,605
Financing Margin %35%32%35%36%34%33%19%24%33%23%28%31%31%
Other Income +36512232525304294105467980
Depreciation566582041151524253542
Profit before tax3,5864,1465,9947,6248,4469,1675,26411,77917,86214,09319,89123,38223,643
Tax %26%26%26%28%29%33%58%25%29%33%21%20%
Net Profit2,6473,0594,4385,4626,0046,1842,2368,79712,6409,47715,71618,76818,999
EPS in Rs11.5311.5916.8120.6922.7423.428.4725.3437.5826.9844.5053.0853.55
Profit and loss of PFC corporation

Balance Sheet

Consolidated Figures in Rs. Crores / View StandaloneCORPORATE ACTIONS

Mar 2011Mar 2012Mar 2013Mar 2014Mar 2015Mar 2016Mar 2017Mar 2018Mar 2019Mar 2020Mar 2021Mar 2022Sep 2022
Share Capital +1,1481,3201,3201,3201,3201,3202,6402,6402,6402,6402,6402,6402,640
Reserves14,09319,47322,36026,20231,09134,70834,20537,19444,48146,76058,12769,03673,866
Borrowings +76,275110,126139,473159,215187,795200,660202,993441,151539,488596,561659,682660,476674,847
Other Liabilities +13,2104,7636,1787,5828,70510,53119,70041,54642,26048,56055,25758,84859,887
Total Liabilities104,725135,682169,330194,320228,912247,220259,537522,531628,869694,521775,707791,000811,240
Fixed Assets +75777572102198296161196238341719737
CWIP20012471051291992883365341
Investments272727275282,2303,1455,4934,6044,4043,4993,7745,103
Other Assets +104,622135,578169,229194,220228,280244,745255,990516,749623,871689,590771,530786,454805,359
Total Assets104,725135,682169,330194,320228,912247,220259,537522,531628,869694,521775,707791,000811,240
The balance sheet of PFC corporation

Shareholding Pattern

Numbers in percentages DEALS / TRADES

Dec 2019Mar 2020Jun 2020Sep 2020Dec 2020Mar 2021Jun 2021Sep 2021Dec 2021Mar 2022Jun 2022Sep 2022
Promoters +55.9955.9955.9955.9955.9955.9955.9955.9955.9955.9955.9955.99
FIIs +18.9018.9217.4516.8117.3717.3217.3517.8816.7116.7616.2116.82
DIIs +20.2620.4021.1220.6720.1819.5519.3713.6613.5813.5812.7417.22
Public +4.854.685.436.536.457.147.2812.4713.7213.6615.059.95
Shareholding pattern of PFC

Conclusion

Overall, the stock is a buying opportunity. One can expect 30-40% upside from this price in the coming 4-6 months. or even before. This is not a buying call, but purely for educational purposes. Learning sharks institute has taught over 100+ students, and if you are interested in learning how to find stocks like these. Read our courses here.

#sharemarket #pfcshare #stockmarket #technical analysis

Date: 03-01-2023

Writer: Vijay verma

Reliance to buy 51% stake in this Chocolate share – Read to know if you should Invest

Lotus Chocolate Company Ltd share price - Full technical and fundamental analysis 2023

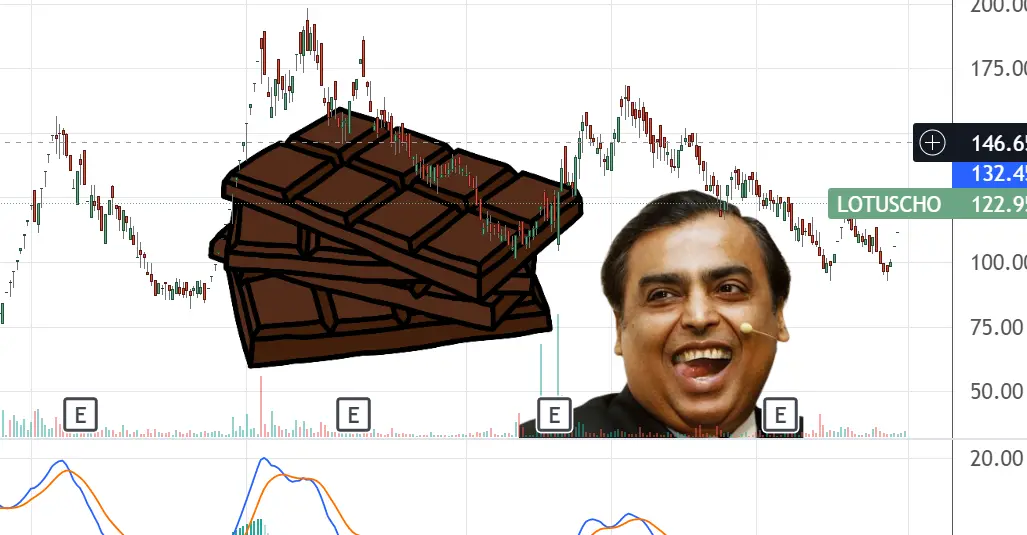
Who knew reliance’s Mukesh Ambani was such a big fan of chocolate? He recently plans to buy 51% of Lotus chocolate for 74 crores. Read full to know whether you should invest in this stock.

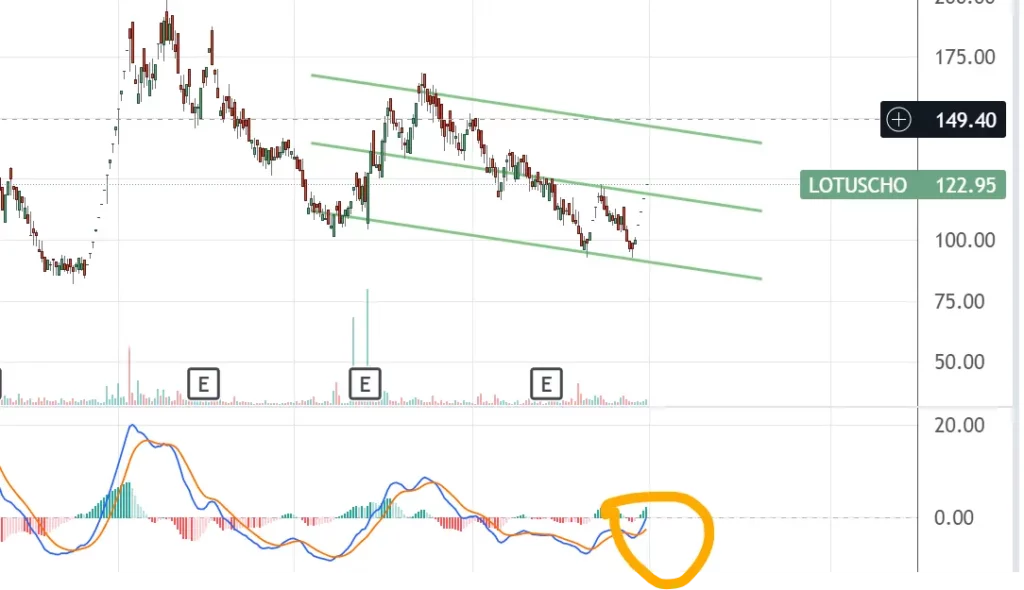
Lotus chocolate’s current share price is 122.95 apiece. Today the stock opened and rushed 5% during the trading hours on the BSE exchange. Let’s look at the technical analysis of this stock.

Lotus chocolate share price technical analysis

The company looks fine on the daily and Monthly chart time frame, however, on the Monthly time frame it seems overbought already. You should be a little concerned if you are planning to invest for the next few months. In the short time frame, the technical seems fine.

Let’s look at the Fundamentals of the Lotus chocolate share

Balance Sheet

Figures in Rs. CroresCORPORATE ACTIONS

Mar 2011Mar 2012Mar 2013Mar 2014Mar 2015Mar 2016Mar 2017Mar 2018Mar 2019Mar 2020Mar 2021Mar 2022Sep 2022
Share Capital +20.2320.2320.2320.2320.2320.2320.2320.2320.2320.2320.2320.2320.23
Reserves-18.57-20.66-22.19-24.88-24.29-23.03-23.50-22.45-21.13-20.20-18.43-12.42-12.84
Borrowings +20.4517.3816.9119.8718.3229.3623.2916.9415.6314.3016.2013.608.30
Other Liabilities +13.5012.1016.3414.8915.6515.0613.1514.9313.7514.1111.6913.445.65
Total Liabilities28.2221.6623.9022.7222.5234.2325.7822.2621.0921.0522.3027.4621.34
Fixed Assets +4.363.925.746.095.795.795.523.422.772.121.491.601.75
CWIP2.002.000.330.030.050.000.000.010.010.010.010.000.00
Investments0.200.180.180.000.000.000.000.000.000.000.000.000.00
Other Assets +21.6615.5617.6516.6016.6828.4420.2618.8318.3118.9220.8025.8619.59
Total Assets28.2221.6623.9022.7222.5234.2325.7822.2621.0921.0522.3027.4621.34
Balance sheet of Lotus chocolate share

While the company has reduced its borrowings, its reserves are Negative. While we look at the profit and loss

Profit & Loss

Figures in Rs. Crores

Mar 2011Mar 2012Mar 2013Mar 2014Mar 2015Mar 2016Mar 2017Mar 2018Mar 2019Mar 2020Mar 2021Mar 2022TTM
Sales +38.6955.5146.4456.3060.7865.4066.4756.9265.6969.8947.8786.9785.94
Expenses +42.2555.6147.0757.9759.8662.6565.0454.2263.7568.3245.4880.6382.04
Operating Profit-3.56-0.10-0.63-1.670.922.751.432.701.941.572.396.343.90
OPM %-9.20%-0.18%-1.36%-2.97%1.51%4.20%2.15%4.74%2.95%2.25%4.99%7.29%4.54%
Other Income +0.080.310.140.060.590.190.130.020.070.050.110.20-0.24
Interest0.881.800.530.420.070.911.220.660.150.200.200.310.38
Depreciation0.510.500.510.660.730.770.800.800.650.650.620.220.18
Profit before tax-4.87-2.09-1.53-2.690.711.26-0.461.261.210.771.686.013.10
Tax %0.00%0.00%0.00%0.00%0.00%0.00%0.00%26.19%-9.92%-14.29%-5.36%0.00%
Net Profit-4.87-2.08-1.54-2.690.711.26-0.460.931.330.881.776.013.10
EPS in Rs-3.79-1.62-1.20-2.090.550.98-0.360.721.040.691.384.682.41
Dividend Payout %0.00%0.00%0.00%0.00%0.00%0.00%0.00%0.00%0.00%0.00%0.00%0.00%
Profit and loss of lotus chocolate share

The company has turned slightly profitable, and most of the shares are with the promoters themselves. Overall it is a decent buy. One can accumulate this share at this rate and average if it goes south.

If you wanna stay updated with these stock recommendations for educational purposes, stay connected with our website. Have a look at the share market courses here our institute has to offer.

#sharemarket #reliance #lotuschocolateshareprice #mukeshambani #latestpost2023

Is it right to invest in Nestle? Buy, sell or Hold

share market articles

Checked by: Vijay Verma

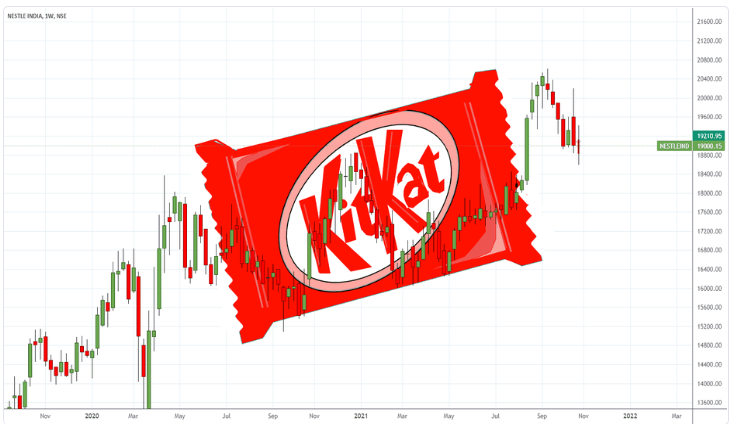
NESTLE started doing business in India in 1912, importing and selling finished goods there. The business gradually increased its presence in India. Are you holding this stock?

The company has maintained its share capital and its continuous supply of FMCG made this stock a multi-bagger. If anybody had invested in this stock in 2010, this stock would have given 600% growth along with Dividends and bonuses.

Nestle CMP is Rs20338 as of Dec 13 which is almost its all-time high. Ideally is it not advised to make a new entry at this point of time? While looking at the NIFTY 50 CMP 18608 again at its all-time high suggesting the stocks would see resistance at this level.

Let’s look at the technical analysis of the stock.

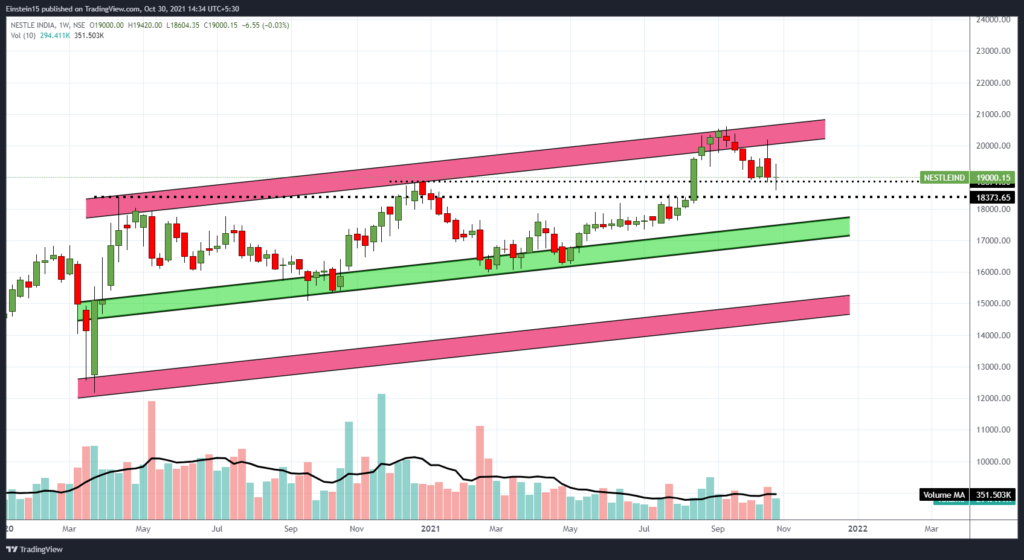
Nestle stock price chart – Technical analysis

Looking at the technical analysis of the stock, the stock seems to be touching the upper band of the channel. Another entry can be taken somewhere around the support.

let’s look at the fundaments of this stock

Quarterly Results Figures in Rs. Crores

Sep 2019Dec 2019Mar 2020Jun 2020Sep 2020Dec 2020Mar 2021Jun 2021Sep 2021Dec 2021Mar 2022Jun 2022Sep 2022
Sales +3,2163,1493,3253,0503,5423,4333,6113,4773,8833,7393,9814,0374,591
Expenses +2,4492,4552,5322,3032,6582,6562,6812,6292,9352,8743,0563,2173,580
Operating Profit7666947937488847779308489488669258191,011
OPM %24%22%24%25%25%23%26%24%24%23%23%20%22%
Other Income +564543383431302934-209211931
Interest32314141404254525244363737
Depreciation91949192919694959610610410298
Profit before tax700614704652786670812730834507806700906
Tax %15%23%25%25%25%28%26%26%26%24%26%26%26%
Net Profit595473525487587483602539617387595515668
EPS in Rs61.7449.0254.5050.4760.8950.1362.4655.8664.0340.1061.6853.4569.32
Raw PDF

Profit & Loss

Figures in Rs. Crores

Dec 2010Dec 2011Dec 2012Dec 2013Dec 2014Dec 2015Dec 2016Dec 2017Dec 2018Dec 2019Dec 2020Dec 2021TTM
Sales +6,2557,5158,3359,1019,8558,1759,14110,01011,29212,36913,35014,70916,348
Expenses +5,0165,9906,5097,1537,8166,6207,2927,9138,6759,44310,14911,11812,727
Operating Profit1,2391,5251,8251,9482,0391,5551,8502,0972,6182,9263,2023,5923,620
OPM %20%20%22%21%21%19%20%21%23%24%24%24%22%
Other Income +3521319787-391140177259247146-116-138
Interest1527371439192112129164201153
Depreciation128153277330338347354342336370370390410
Profit before tax1,1451,3881,5531,6781,7748141,5451,8392,4292,6732,8132,8842,920
Tax %29%31%31%33%33%31%35%33%34%26%26%26%
Net Profit8199621,0681,1171,1855631,0011,2251,6071,9682,0822,1452,165
EPS in Rs84.9199.73110.76115.87122.8758.42103.86127.07166.67204.16215.98222.46224.55
Dividend Payout %57%49%44%42%51%83%61%68%69%168%93%90%

Balance Sheet

Figures in Rs. CroresCORPORATE ACTIONS

Dec 2010Dec 2011Dec 2012Dec 2013Dec 2014Dec 2015Dec 2016Dec 2017Dec 2018Dec 2019Dec 2020Dec 2021Jun 2022
Share Capital +96969696969696969696969696
Reserves7591,1781,7022,2722,7412,7213,1863,3243,5771,8221,9231,9882,232
Borrowings +09711,0501,1892018333535189147266280
Other Liabilities +1,7032,1572,3152,7562,9633,2513,4953,9074,3795,0655,7335,8606,007
Total Liabilities2,5584,4025,1646,3145,8206,0866,8107,3638,0887,1737,9008,2108,616
Fixed Assets +1,0131,5763,2043,3693,1772,8982,7302,6162,4012,3412,1792,9943,054
CWIP3491,37234429524523118894105143639246197
Investments1511343658518121,3251,7561,9792,6581,7511,464774809
Other Assets +1,0461,3201,2511,7991,5861,6332,1362,6732,9242,9373,6184,1964,556
Total Assets2,5584,4025,1646,3145,8206,0866,8107,3638,0887,1737,9008,2108,616

Cash Flows

Figures in Rs. Crores

Dec 2010Dec 2011Dec 2012Dec 2013Dec 2014Dec 2015Dec 2016Dec 2017Dec 2018Dec 2019Dec 2020Dec 2021
Cash from Operating Activity +1,0371,1581,6931,7961,6441,0981,4661,8182,0522,2952,4542,271
Cash from Investing Activity +-446-1,528-941-441-432-70-126-131-5283-321-1,957
Cash from Financing Activity +-544323-513-580-1,635-498-666-997-1,317-3,602-1,956-2,019
Net Cash Flow47-47239775-423529674691683-1,223177-1,704

Ratios

Figures in Rs. Crores

Dec 2010Dec 2011Dec 2012Dec 2013Dec 2014Dec 2015Dec 2016Dec 2017Dec 2018Dec 2019Dec 2020Dec 2021
Debtor Days464344434454
Inventory Days82898679821031079192107107111
Days Payable10692636871949199118124115122
Cash Conversion Cycle-2032814151220-5-22-14-3-7
Working Capital Days-51-14-11-17-13-21-10-15-21-19-21-15
ROCE %161%90%62%53%56%46%54%57%71%96%139%147%

Shareholding Pattern

Numbers in percentagesDEALS / TRADES

8 recently

Dec 2019Mar 2020Jun 2020Sep 2020Dec 2020Mar 2021Jun 2021Sep 2021Dec 2021Mar 2022Jun 2022Sep 2022
Promoters +62.7662.7662.7662.7662.7662.7662.7662.7662.7662.7662.7662.76
FIIs +12.0711.8112.1011.5112.8412.2912.4312.3112.3512.0111.6512.05
DIIs +8.929.128.718.917.757.957.927.997.898.609.148.86
Government +0.070.070.070.000.000.000.000.000.000.000.000.00
Public +16.1816.2416.3616.8216.6516.9916.8816.9316.9916.6216.4516.33

Overall the company seems good to hold. However, It might take a healthy correction. If you wanna learn about the course check out our courses page.

#stockmarket #sharemarket #nestle

Update – 15-04-23

Current Market price is 19465

Technical Trading Program

Learning sharks stock market Institute best technical trading program

Topics Covered

  1. Top Technical Analysis Tools for Traders
  2. Brokers Offering Technical Analysis Tools
  3. Ally Invest
  4. Charles Schwab
  5. E*TRADE
  6. Fidelity Investments
  7. Interactive Brokers
  8. Lightspeed
  9. Thinkorswim (TD Ameritrade)
  10. Trade Station
  11. Trader
  12. Technical Analysis Sites
  13. eSignal
  14. MarketGear from iVest+
  15. MetaStock
  16. NinjaTrader
  17. Slope of Hope

Top Technical Analysis trading tools

Firstly, The capacity to analyze Technical trading program data patterns is essential to a trader’s performance, especially for those who trade frequently. Techniques used in technical analysis trading tools can help traders make objective decisions. Buy and sell indicators can be produced by a technical analysis system, which can also assist in finding fresh trading opportunities. 


Secondly, In the last 15 years, software advancements have made it faster and easier to acquire millions of data points, making technical analysis tools for trading accessible to all internet traders. The majority of the better websites that provide technical analysis trading tools also direct novice traders toward a basic comprehension of the key ideas.


Thirdly,  A price may be required for some of these materials, while others are free or are part of the broker’s platform. We’ll look at various standalone resources as well as technical analysis tools included in brokers’ products. These are listed alphabetically and are not meant to imply any sort of order.

Brokers Offering Technical Analysis Trading Tools

Moreover, The following list of brokers makes use of Trading Central, a third-party source. Trading Central, a Canadian startup, offers top-notch technical analysis tools that many brokers have included in their platforms for active traders.


Furthermore, Based on acknowledged methods of technical analysis, Trading Central’s tools automatically evaluate price activity to recognize and interpret well-known chart patterns and other crucial circumstances. These technical event alerts provide traders with information on the advantages and disadvantages of the equities they are considering.

Individual investors cannot use these tools outside of brokerage platforms, however many active trader websites incorporate their technology.

Technical Analysis Trading Tools

Ally Invest

The stock screener on the brokerage platform from Ally Invest is run by Trading Central. Read Investopedia’s evaluation of Ally Invest here.

Charles Schwab

Importantly, Screener Plus, a tool available on Charles Schwab’s StreetSmart Edge platform for active traders, employs real-time streaming data to let users filter stocks and ETFs based on a variety of fundamental and technical factors, including technical indications from Trading Central (Recognia). 


Besides, The factors that are most essential to the trader can be set, and the results of Screener Plus can be integrated with the watch lists that the trader has already created. Trading Central (Recognia) pattern detection tools are incorporated into the customizable charts offered by StreetSmart Edge. There are no sketching tools available while charting on mobile devices, however, there are quite a few technical analysis indicators.

E-TRADE

Surely, The Live Action scanner offers over 100 pre-defined screens that scan the market in real time on live prices and live analytical measures based on technical, fundamental, earnings, sentiment, and news events on Power E*TRADE, the company’s active trading platform.


Clearly, The Oscillator scans included with Live Action improve clients’ portfolios by identifying overbought or oversold stocks and examining new opportunities. This Power E*TRADE platform’s built-in screens are very numerous and exclusive.


Undoubtedly, You can use the Recognia scanner to scan stocks based on technical occurrences or patterns and set alerts for when new requirements are satisfied. Power E*TRADE’s paper trading features can be used to evaluate your technical trading strategy. Read the E*TRADE review on Investopedia.

Fidelity Investments

Comparatively, Fidelity’s downloaded trading interface, Active Trader Pro, has a more comprehensive feature set than what is offered on the website. Charting options and trade tools are fully customizable in Active Trader Pro. You can receive alerts from the software regarding open positions as well as technical signs for companies you are tracking.


At last, Trading Central’s technical patterns and events have been incorporated into Fidelity’s web-based charting. A 30-day intraday data window, extended hours data, and more than 60 completely customizable technical indicators are all available with advanced charting on the web.


Of Course, Technical analysis is emphasized in the content of the Fidelity Learning Center, which consists of articles, videos, webinars, infographics, and recorded webinars. A select number of clients can participate in Fidelity’s weekly online coaching sessions to have in-depth conversations about options and technical analysis. The Fidelity review on Investopedia is available.

Interactive Brokers

However, On all of Interactive Brokers’ platforms, extensive customization of charting is available. This includes over 100 indicators and real-time streaming data. The flagship trading platform of IB, Trader Workstation (TWS), includes sophisticated technical analysis tools with over 120 indicators.


TWS offers a demo version that enables users to explore the platform’s features and simulate various trading scenarios. Additionally, you can link your IBKR account to a third-party analytics platform. At the Investors Marketplace, a comprehensive list of merchants is searchable. Read the Interactive Brokers review on Investopedia.

Lightspeed

Lightspeed’s flagship platform, a downloadable tool called Lightspeed Trader, is designed for extremely frequent traders and contains a highly customized live market scanner called LightScan that may assist you screen for current trading opportunities.


To present symbols that are sorted and filtered according to your preferences, LightScan searches the full universe of stocks. There are more than 100 searchable criteria that can be combined. Charting options are adjustable on the flagship platform.


For those who want to take the platform for a spin, there is a demo version accessible. The evaluation of Lightspeed may be found on Investopedia.

Thinkorswim (TD Ameritrade)

Thinkorswim, an advanced options-focused platform from TD Ameritrade, enables users to personalize the interface by adding their preferred tools and a trade ticket. Since There are several technical analysis trading tools available for stock traders even if the platform was first created for options trading. There are tools for drawing, technical indicators, and data visualization.


As a result of  With Thinkorswim, traders can use a built-in programming language called think script and make their own technical analysis trading tools. The most potent version of thinkorswim is the desktop version, although there is also a web version and a mobile app available. All of them contain live, streaming data that is used to support more than 400 technical investigations.


Therefore, The thinkorswim trading systems will continue to be available when the two businesses combine, according to Charles Schwab, which is acquiring TD Ameritrade. The platform integrations were anticipated to take another 18–36 months after the transaction was finalized in the fourth quarter of 2020.

Trade Station

The TradeStation platform excels at statistical modeling of trading strategies and technical analysis. Technical analysis is ingrained in the brokerage because it was founded by Omega Research, a company that develops tools for technical analysis.


The TradeStation 10 platform, which may be downloaded, has outstanding tick data-based charting capabilities. The charting software includes automated technical analysis, which shows technical patterns as they emerge on the charts. The features of web charting largely resemble those of TradeStation 10, and they include a new toolbar with access to changing time frames, drawing tools, sessions, and styles.


One of the best charting programs offered by any broker, it stands out for its seamless integration with TradeStation’s order management platform. Users of TradeStation can develop and backtest trading strategies based on technical events. The TradeStation trading simulator offers a sizable historical database for backtesting techniques in addition to all the capabilities included in TradeStation 10. Read the TradeStation review on Investopedia.

Trader

With a trading engine, a brokerage-account management system, and some market data, Tradier is a unique creature. Customers can log in and trade from any of Tradier’s developer partners because account preferences and market information are stored in the cloud. They also have a desktop version that may be downloaded.


Front-end designers can build their own trading platforms, mobile apps, algorithmic trading systems, or other tailored features for their clients using an application programming interface (API). Although many of the above-mentioned brokers offer the opportunity to connect a third-party platform to an online brokerage account, Tradier is the first broker to make this functionality the core of its business strategy.


If a standalone technical analysis site can be attached to Tradier’s brokerage administration platform, allowing trades while using analytical tools, we’ll note it in the following section.

Technical Analysis Sites

E-Signal

One of the illustrious names in technical analysis is ESignal. Technical analysis trading tools studies, backtesting of trading techniques, customizable charting, and data from international exchanges are all included in the most recent edition of eSignal, version 12. It is a downloadable Windows-based software program.


Users can trade with a number of brokers, such as Tradier and Interactive Brokers, via API. The Classic edition, which uses data that is 15 minutes delayed, costs $56 a month. The monthly cost of its Signature version, which uses real-time data and has a number of cutting-edge features, is $183. Monthly fees for the Elite edition are $378.

MarketGear from iVest+

With Market Gear’s charting features, you can evaluate prior transactions, draw permanent trendlines, view your trades, study customizable indicators, and choose from a variety of time frames.


To locate trade opportunities based on technical data, the scanner helps you search through more than 100 customizable technical indicators. As many scans as you like can be written; simply set your favorites for easy access.


To connect to TD Ameritrade, E*TRADE, ChoiceTrade, and Ally Invest, Market Gear uses their APIs. Costs begin at $75 per month.

MetaStock

Another established competitor in the technical analysis sector is MetaStock, which was established in the late 1980s. There are various software versions available; MetaStock R/T, which uses real-time trading data from your preferred exchanges, is the most helpful for frequent traders.


More than 150 indicators, line studies, and indication interpretations are included, along with information on how to trade each indicator. The Indicator Builder allows experienced users to create their own indicators. You have the option of developing and backtesting trading methods on your own or using the techniques that are already part of the package. 


On a chart, MetaStock can spot more than 30 candle patterns and advise you on how to read and use them.$100/month is the cost of a Metastock R/T subscription; data feeds are extra. MetaStock links to online brokers using an API.

NinjaTrader

Before making a real-money investment in a live market, you can develop, test, and simulate a trading system for stocks, foreign exchange, and futures using the trading environment provided by NinjaTrader. For advanced charting, backtesting, and trade simulation, NinjaTrader is free to use, although some indicators created by third parties have a cost.


The standard package includes more than 100 technical indicators in addition to fundamentals, charts, trade journaling, and research tools.


You can integrate NinjaTrader with TD Ameritrade, Interactive Brokers, FXCM, and other platforms via API, or you can use NinjaTrader’s own brokerage service to execute trades.

Slope of Hope

To share charts and trading experiences with a select handful of his admirers, Slope of Hope was launched in 2005 by inventor and perma-bear Tim Knight, who had just sold his charting website, Prophet.net, to TD Ameritrade. Nowadays, it serves as a hub for technical analysis, trading suggestions, charts, and discussions among traders of all shades.


Many of the features, such as a potent technical charting package, are available for free and are comparable to those of much more expensive websites. One of SlopeCharts’ most useful features is SlopeRules, which enables you to design and test a trading system using mathematical formulae. Set up an alert to notify you when the circumstances are met, then drag and drop the rules you want to apply on a chart, test them, and then utilize them.


For you to learn how to refine your trading talents, an integrated virtual trading system is offered that starts with an account with $100,000. Options traders will come across some excellent analytical tools.


Access to more data, thorough options analysis, and access to unique trading ideas are all features of premium membership tiers ($14.95–79.95 a month, two months free with an annual subscription).


The slope has released native mobile applications for iOS and Android smartphones that give users access to all posts and a portion of the website’s capabilities.