The majority of investors are aware that trying to time the market by consistently buying cheap and selling high is an impractical goal. Even with this knowledge, though, if you have a sizeable sum of money to invest, you might be hesitant to do so given that the stock market is hovering close to all-time highs. Similar to this, few investors have the guts to “buy the drop” when the opportunity arises (remember March 2020?).
These two instances, as rational as they may sound, both touch on market timing topics. The S&P 500 has already reached 10 new record highs in 2021 and is coming off two extremely good years, despite the current decline in the U.S. stock market. So what should you do if the market is strong and you have money to invest?
Should I invest when the market is high?
It is a mistake on many levels to remain in cash just because the S&P 500 is reaching new highs. First, it’s imperative to base investment selections on long-term aspirations rather than passing market trends. Second, past results do not guarantee future success. Similar to how a halt during a violent selloff doesn’t necessarily imply there isn’t still more ground to fall, reaching new highs doesn’t always mean the market has peaked and a correction is on the horizon.
Furthermore, historical data refutes the notion that making a cash investment at a time when the market is booming will probably result in reduced future returns. In fact, investing on days when the S&P 500 ended at a new record high can actually yield better returns than investing on a day when the market didn’t establish a new record, according to J.P. Morgan.
Investing at new highs…
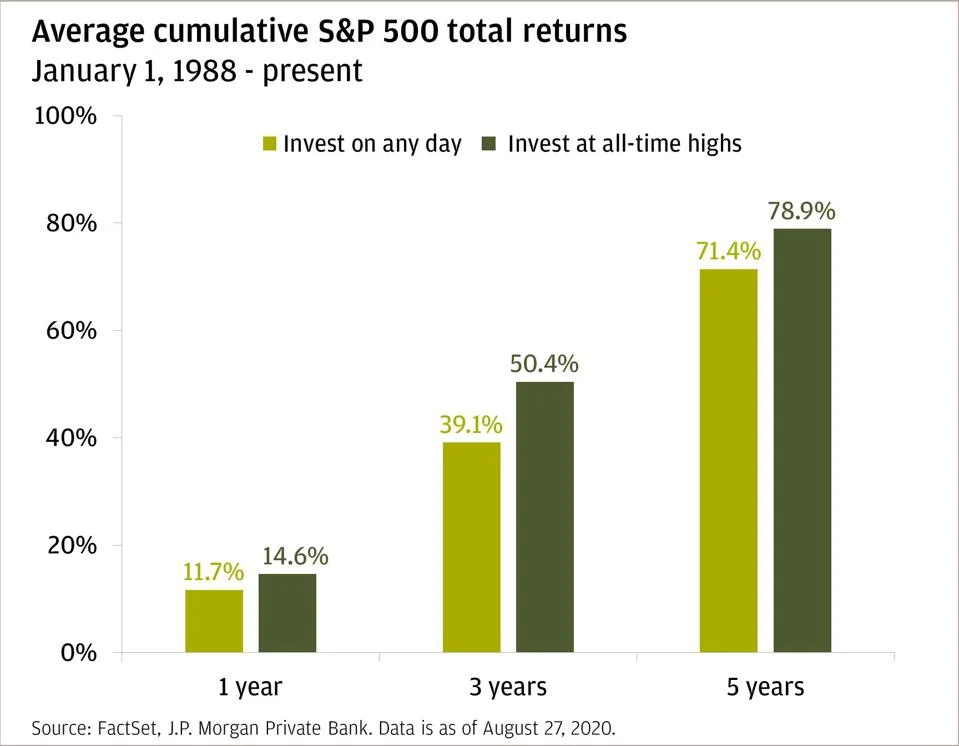
…versus buying the dip
The cumulative 5-year returns following stock market dips (buying the dip) are lower than the cumulative 5-year return after the market reaches new highs, which may surprise investors.
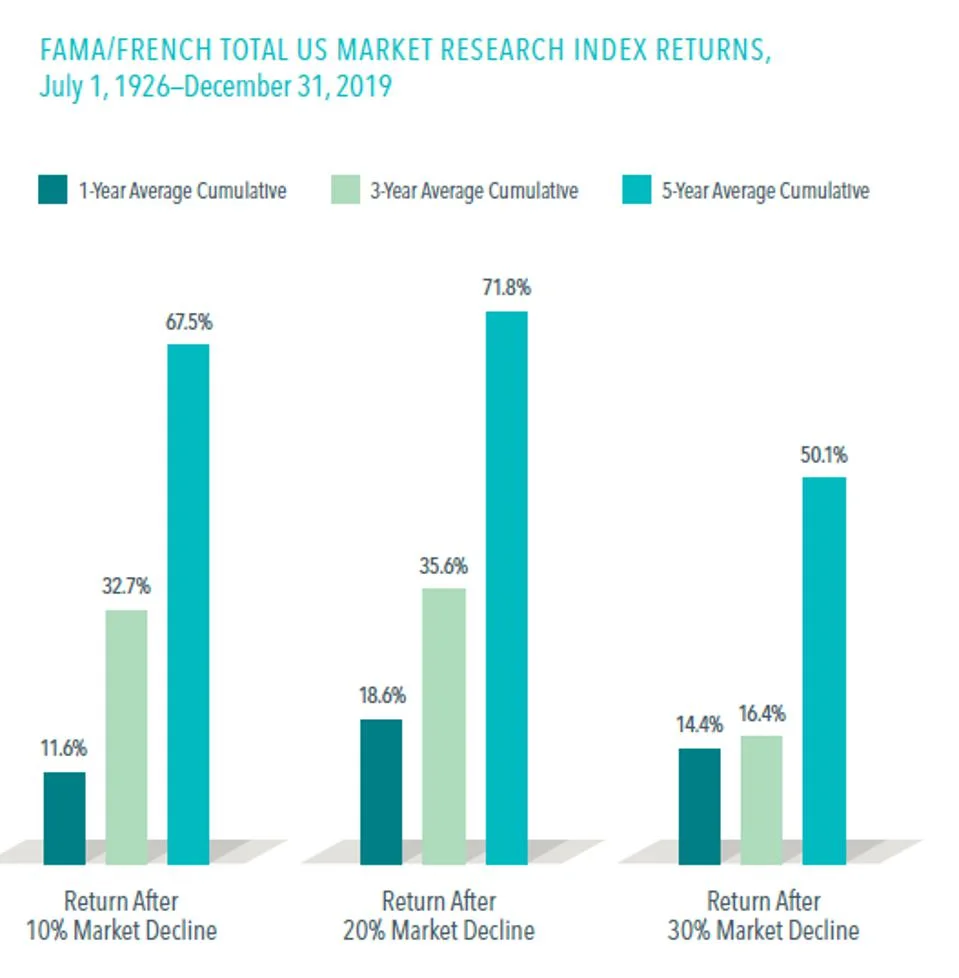
As the chart below is over a considerably longer time period and the Fama/French Total US Stock Market Index is an extended representation of the whole US equities market, this comparison is not fair. Yet, the S&P 500 is still a useful benchmark for comparison because it typically accounts for 80%–85% of the whole US stock market.
Market timing doesn’t work because there’s no telling what markets will do
Covid-19 selloff and subsequent rebound
On a total return basis, the S&P 500 increased by roughly 31.5% in 2019. It is more than three times the index’s average annualised return since 1926. 2020 will only bring down, right? Wrong. The S&P 500 was off to a solid start in early 2020 despite the Covid-19 pandemic. Stocks began to decline significantly after reaching their peak on February 19 and would eventually bottom out on March 23rd, down nearly –30% on the year, including dividends. But, by the end of 2020, the S&P 500 had achieved 33 new highs, ending the year with a total return of 18.4%.
The index generated cumulative returns of more than 55% during a two-year period. If you bought equities at their highest on February 19th, you would break even on August 10th (the S&P 500 reached a new all-time high on August 18th), and you would be up over 13% by year’s end.
The 2008 financial crisis
Markets normally don’t bounce back as swiftly as they did in 2020. Before the Great Financial Crisis, on October 11, 2007, the S&P 500 reached its peak. The S&P 500 wouldn’t reach a new high until April 2013, and if you bought the index at its peak, it would take nearly four and a half years to recover your losses. Your total return over the course of these five and a half years would be 14%.
Investing is about time in the market, not timing the market
There is no way to forecast how the market will behave in the near future unless you possess a crystal ball. Nonetheless, previous information can be useful in setting a range of expected future outcomes. We refer to it as mean reversion.
Three crucial considerations should be made while investing in the financial markets using this long-term perspective.
1. History shows as the number of years you stay invested increases, the risk of losing money decreases.
That is why it is referred to as long-term investing. The stock market has trended upward during the past 95 years, as seen by the samples above. But anything might happen over a period of several months to years. Whether you invest at a time when the market is high or low, you shouldn’t focus too much on your short-term profits.
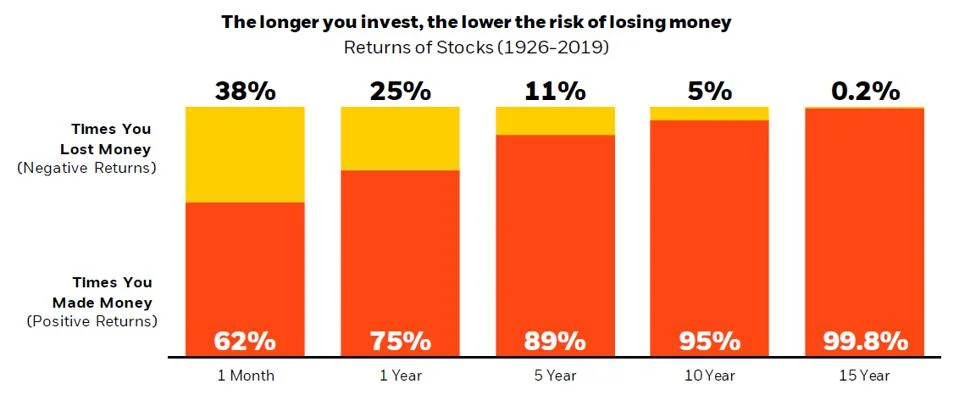
Sources: Morningstar and BlackRock. S&P 500 and the IA SBBI US Large Cap Index both reflect US stocks. Future outcomes cannot be predicted based on past performance. This is merely an example and not a recommendation to make an investment. Direct investment in an index is not possible.
2. In the last 20 years, 70% of the best days in the market happened within 14 days of the worst ones.
One does not exist without the other. Yet, trying to time it can be very expensive. Thus, if the market’s up or down and you’re hesitant to invest, think about the cost of losing out on the best opportunities. Recent market conditions should not play a significant role in determining whether or not it is a suitable time to invest.
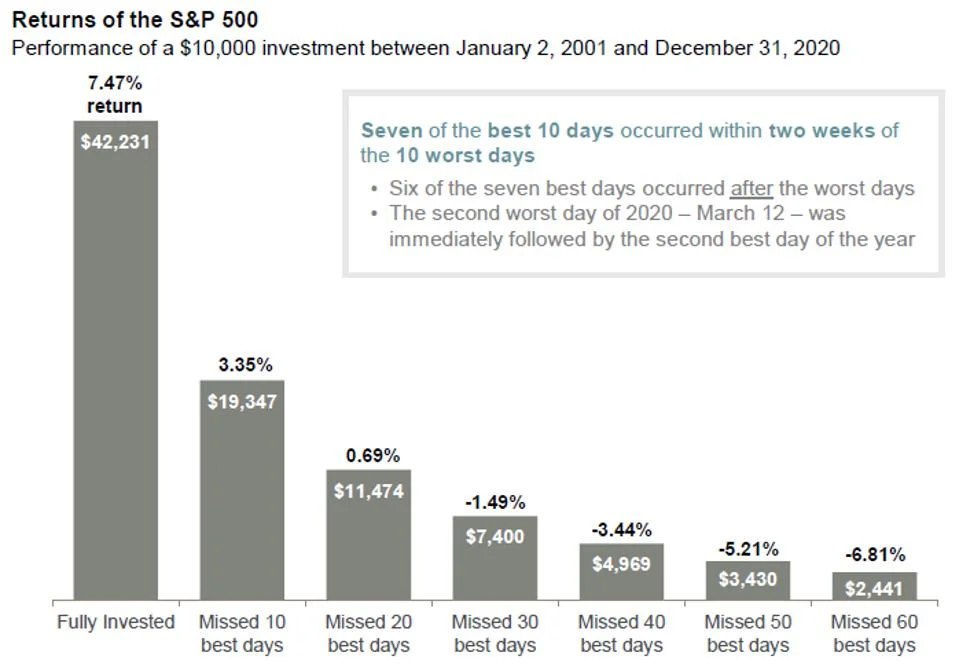
Comes from J.P. Morgan. The S&P 500 Total Return Index serves as the basis for returns. Future outcomes cannot be predicted based on past performance. This is merely an example and not a recommendation to make an investment. Direct investment in an index is not possible.
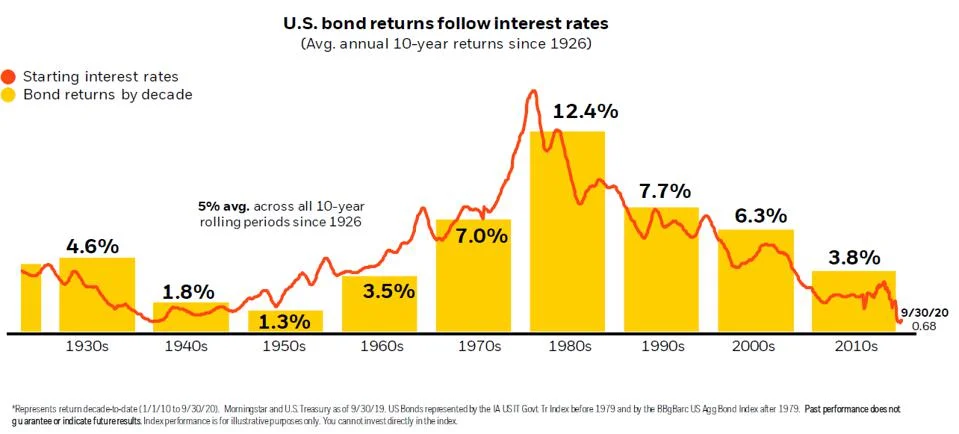
3. What’s the alternative? Bonds and cash aren’t investments for growth.
What are your choices for investing money if you’re hesitant to invest because you’re worried about stock valuations? Bond returns have suffered as a result of the long-term decline in interest rates. Because savings account interest rates are so low, it often costs money to only use cash. Remember that many stocks provide dividends as well. When stock prices decline, the income may be used to cover losses.
Think about the possibility that the market doesn’t fall as quickly or sharply as you anticipate. How long will you wait before making an investment? You run the danger of investing cash at even greater values after missing out on growth.
Ways to reduce the risk of investing at the ‘wrong’ time
Dollar-cost averaging
Dollar-cost averaging can be a useful strategy for lowering the risk—and anxiety—of investing at the wrong time, whether it’s during a recession or a period of high stock prices. Dollar-cost averaging works differently than trying to time the market since you invest at regular intervals regardless of whether the market is high (or low) that particular day.
It’s not always about what makes sense on paper when it comes to personal money. Although not without limits, controlling the emotional response is a legitimate concern (such as difficulty sleeping at night). In unpredictable markets or when you have a lot of money to invest, dollar-cost averaging can be a successful technique. Just be sure to establish and adhere to an investment plan in advance.
Think outside the S&P 500
Continually diversify your portfolio! The S&P 500 is highlighted in the instances above because investors are familiar with it. Yet that does not imply that you should only think about investing in that. Any risk-adjusted asset building and asset protection strategy must start with diversification. This also entails looking beyond the S&P 500. This is why.
Different market situations and time periods cause distinct behaviours among asset classes. Current valuations and the risk-reward framework will both change. For instance, according to J.P. Morgan, the S&P 500’s future price-to-earnings ratio on March 1, 2021, was 42% higher than its 20-year average, but the All Country Global Index (ex-US) was just 24% higher. In other words, while most stocks are currently pricey relative to history, foreign stocks are less costly.
The key to lowering volatility and asset correlation in your portfolio is investing across asset classes (such as stocks and bonds) as well as within them (such as mid and large cap equity). Because asset classes will typically be performing differently at the time of investment, it also helps investors lower the risk of investing a lump sum in the market all at once.
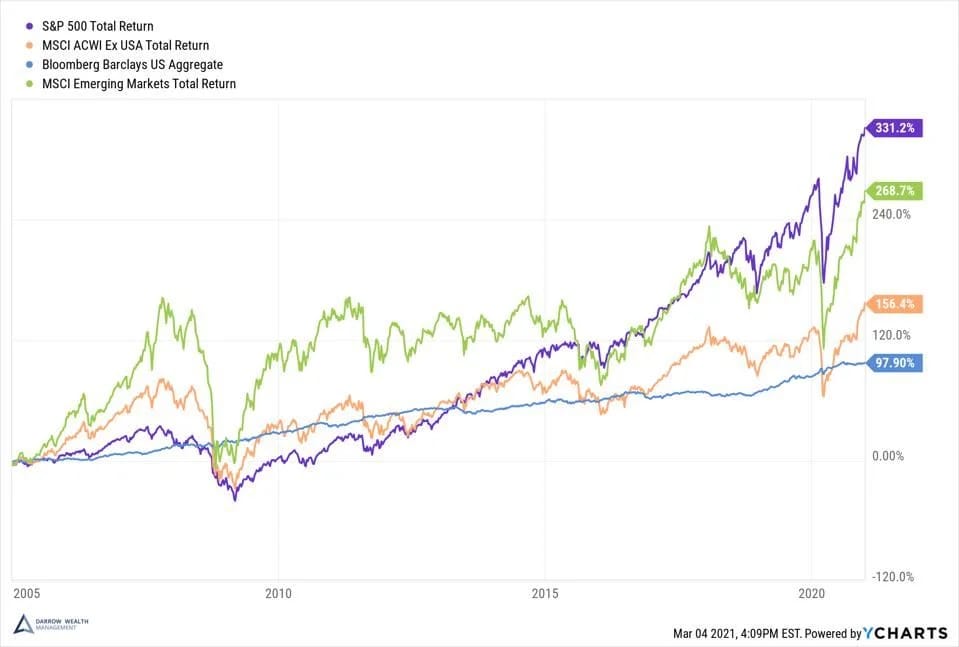
The S&P 500 isn’t the only option; there are other additional aspects to take into account when deciding what to invest in. Consider the graph below, which shows total returns from 2005 through 2020, to demonstrate how asset classes perform over time and the relative volatility.
The S&P 500, the Bloomberg Barclays Aggregate U.S. Bond Index, the MSCI ACWI ex-U.S., and emerging market stocks are all represented on the chart (MSCI Emerging Markets).
Focus on what you can control
You are powerless over the stock market. But, you have some influence over how you invest in it and what you do in a downturn. Long-term wealth creation and protection depend heavily on strong savings rates, continued investing, and adherence to the strategy. It’s like putting your financial future in the hands of chance to try to time the market by holding onto cash and waiting for a fall.