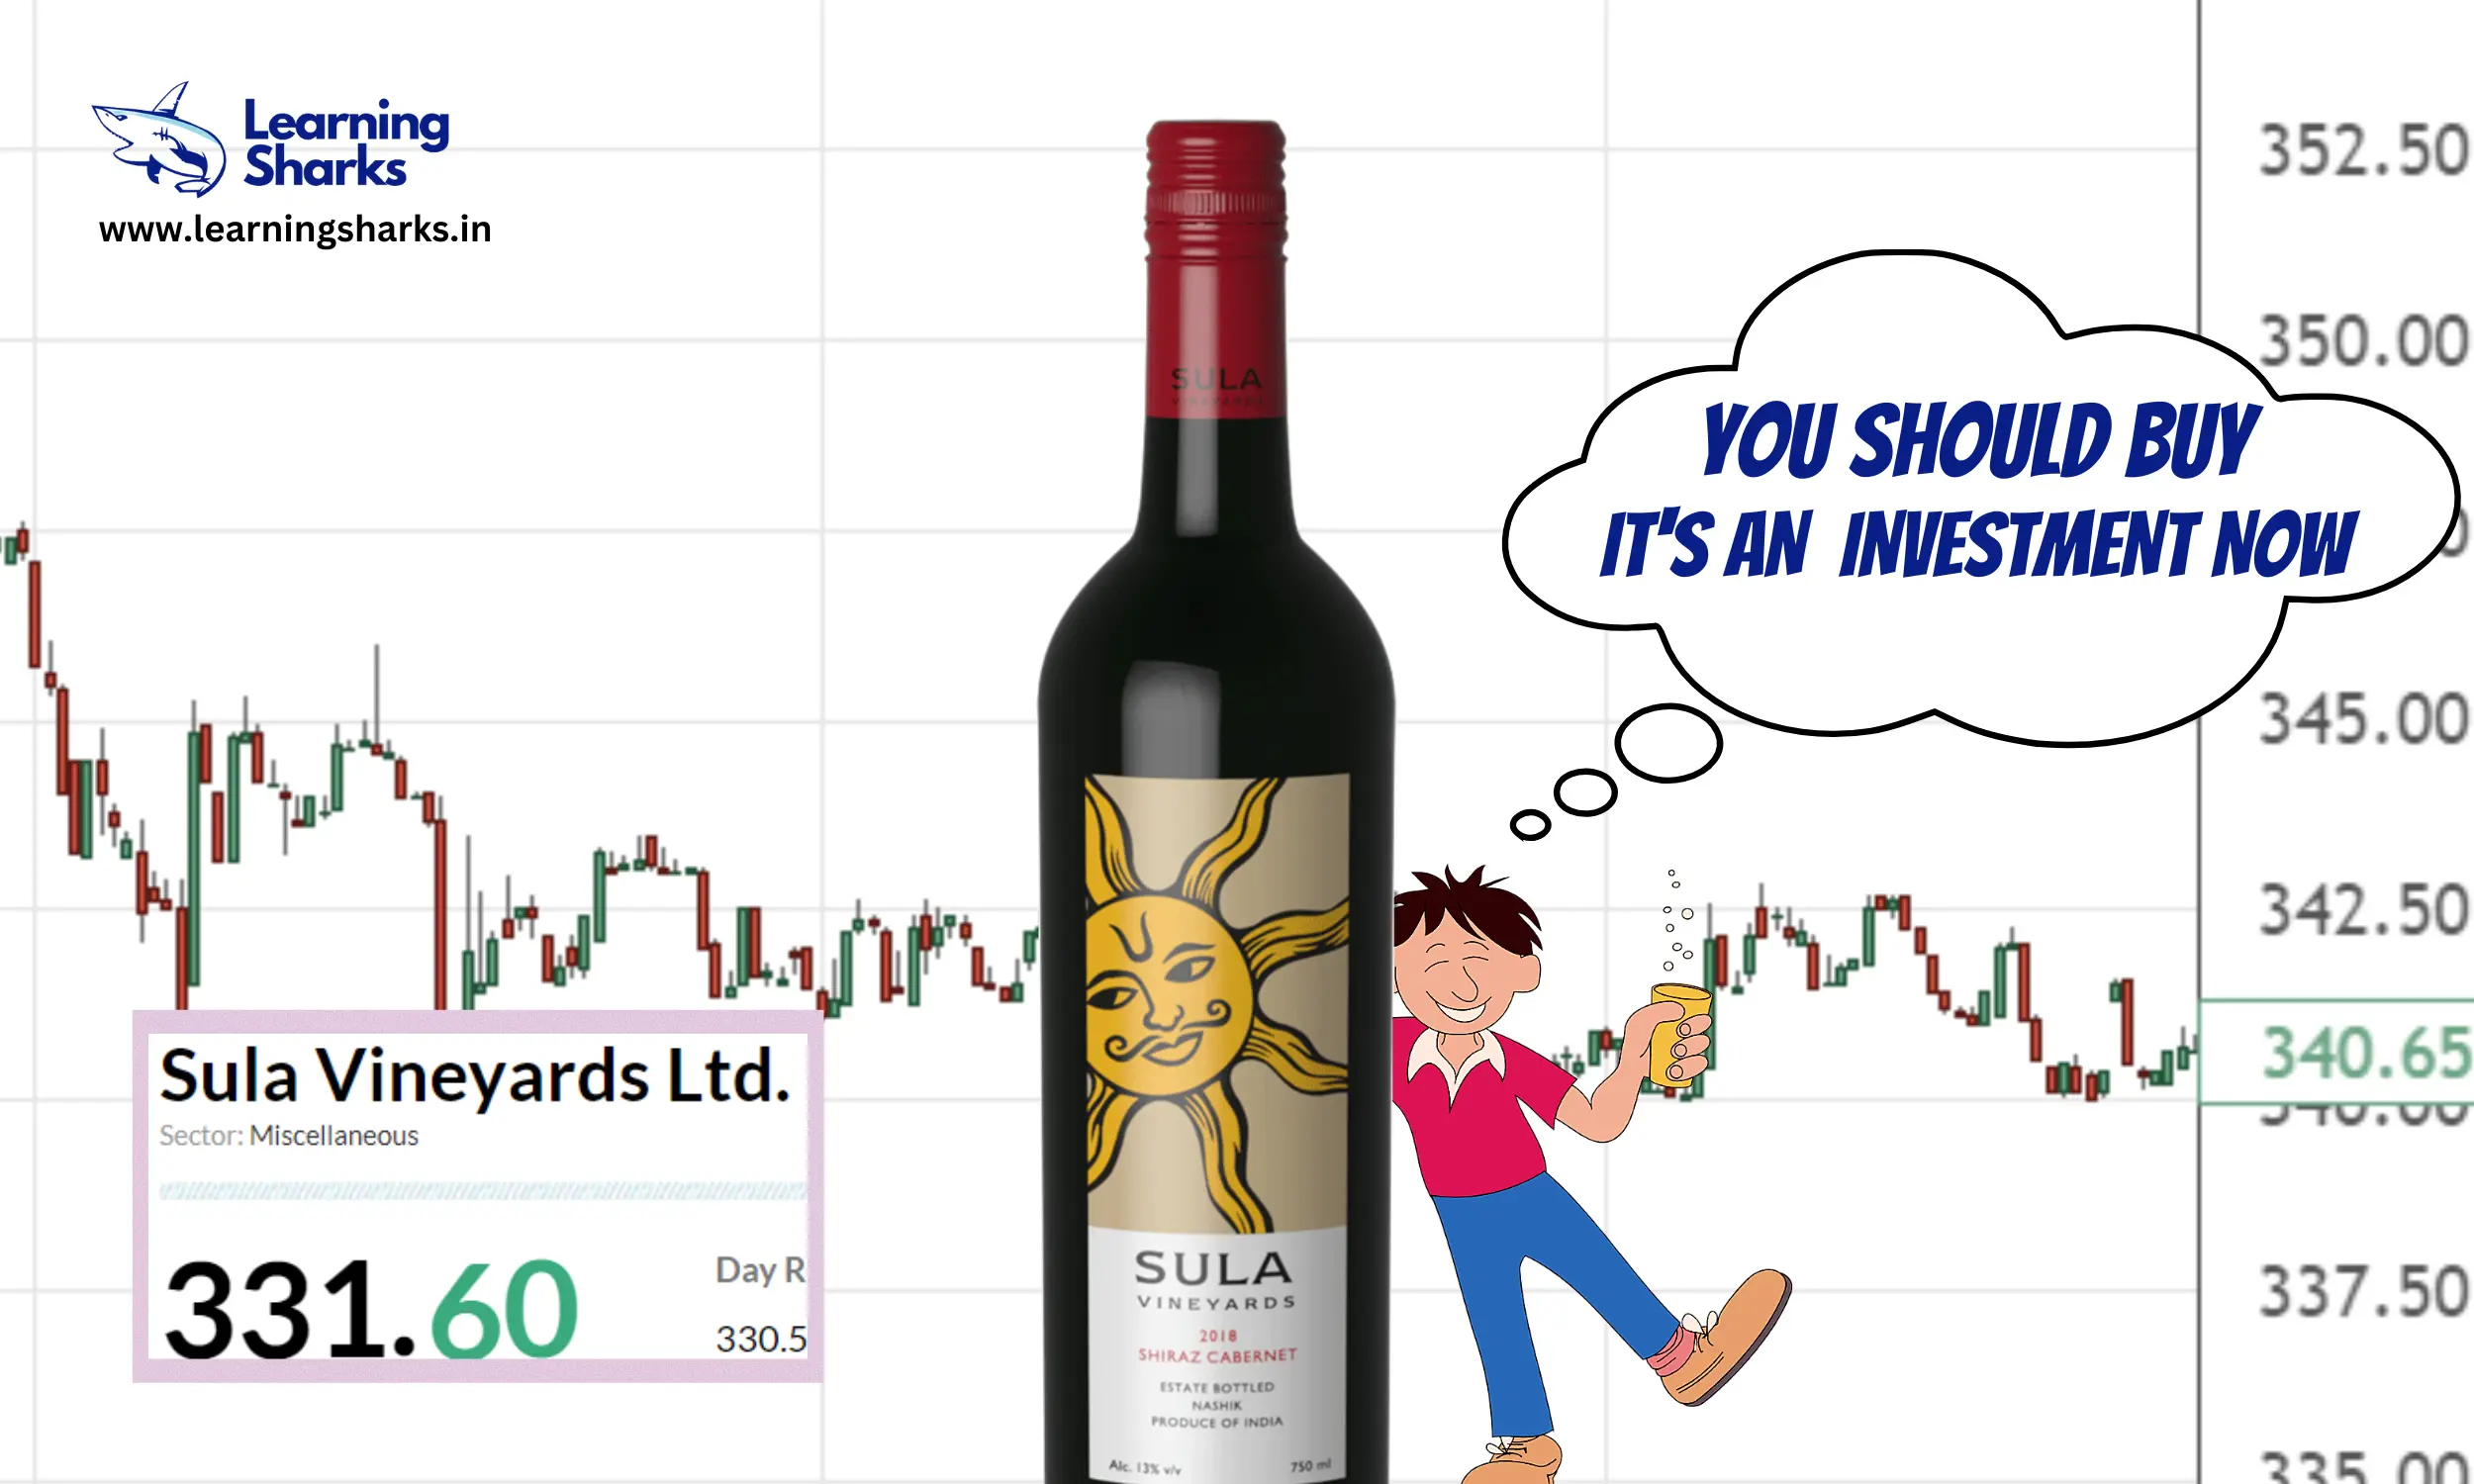
Incorporated in 2003, Sula Vineyards Limited is India’s largest wine producer and seller as of March 31, 2022. The company also distributes wines under a bouquet of popular brands including “RASA,” “Dindori”, “The source,” “Satori”, “Madera” & “Dia” with its flagship brand “Sula” being the “category creator” of wine in India.
The company’s business is broadly classified under two categories (i) the production of wine, the import of wines and spirits, and the distribution of wines and spirits (the “Wine Business”); and (ii) the sale of services from ownership and operation of wine tourism venues, including vineyard resorts and tasting rooms (the “Wine Tourism Business“)
Currently, the company produces 56 different labels of wine at four owned and two leased production facilities located in the Indian states of Maharashtra and Karnataka.
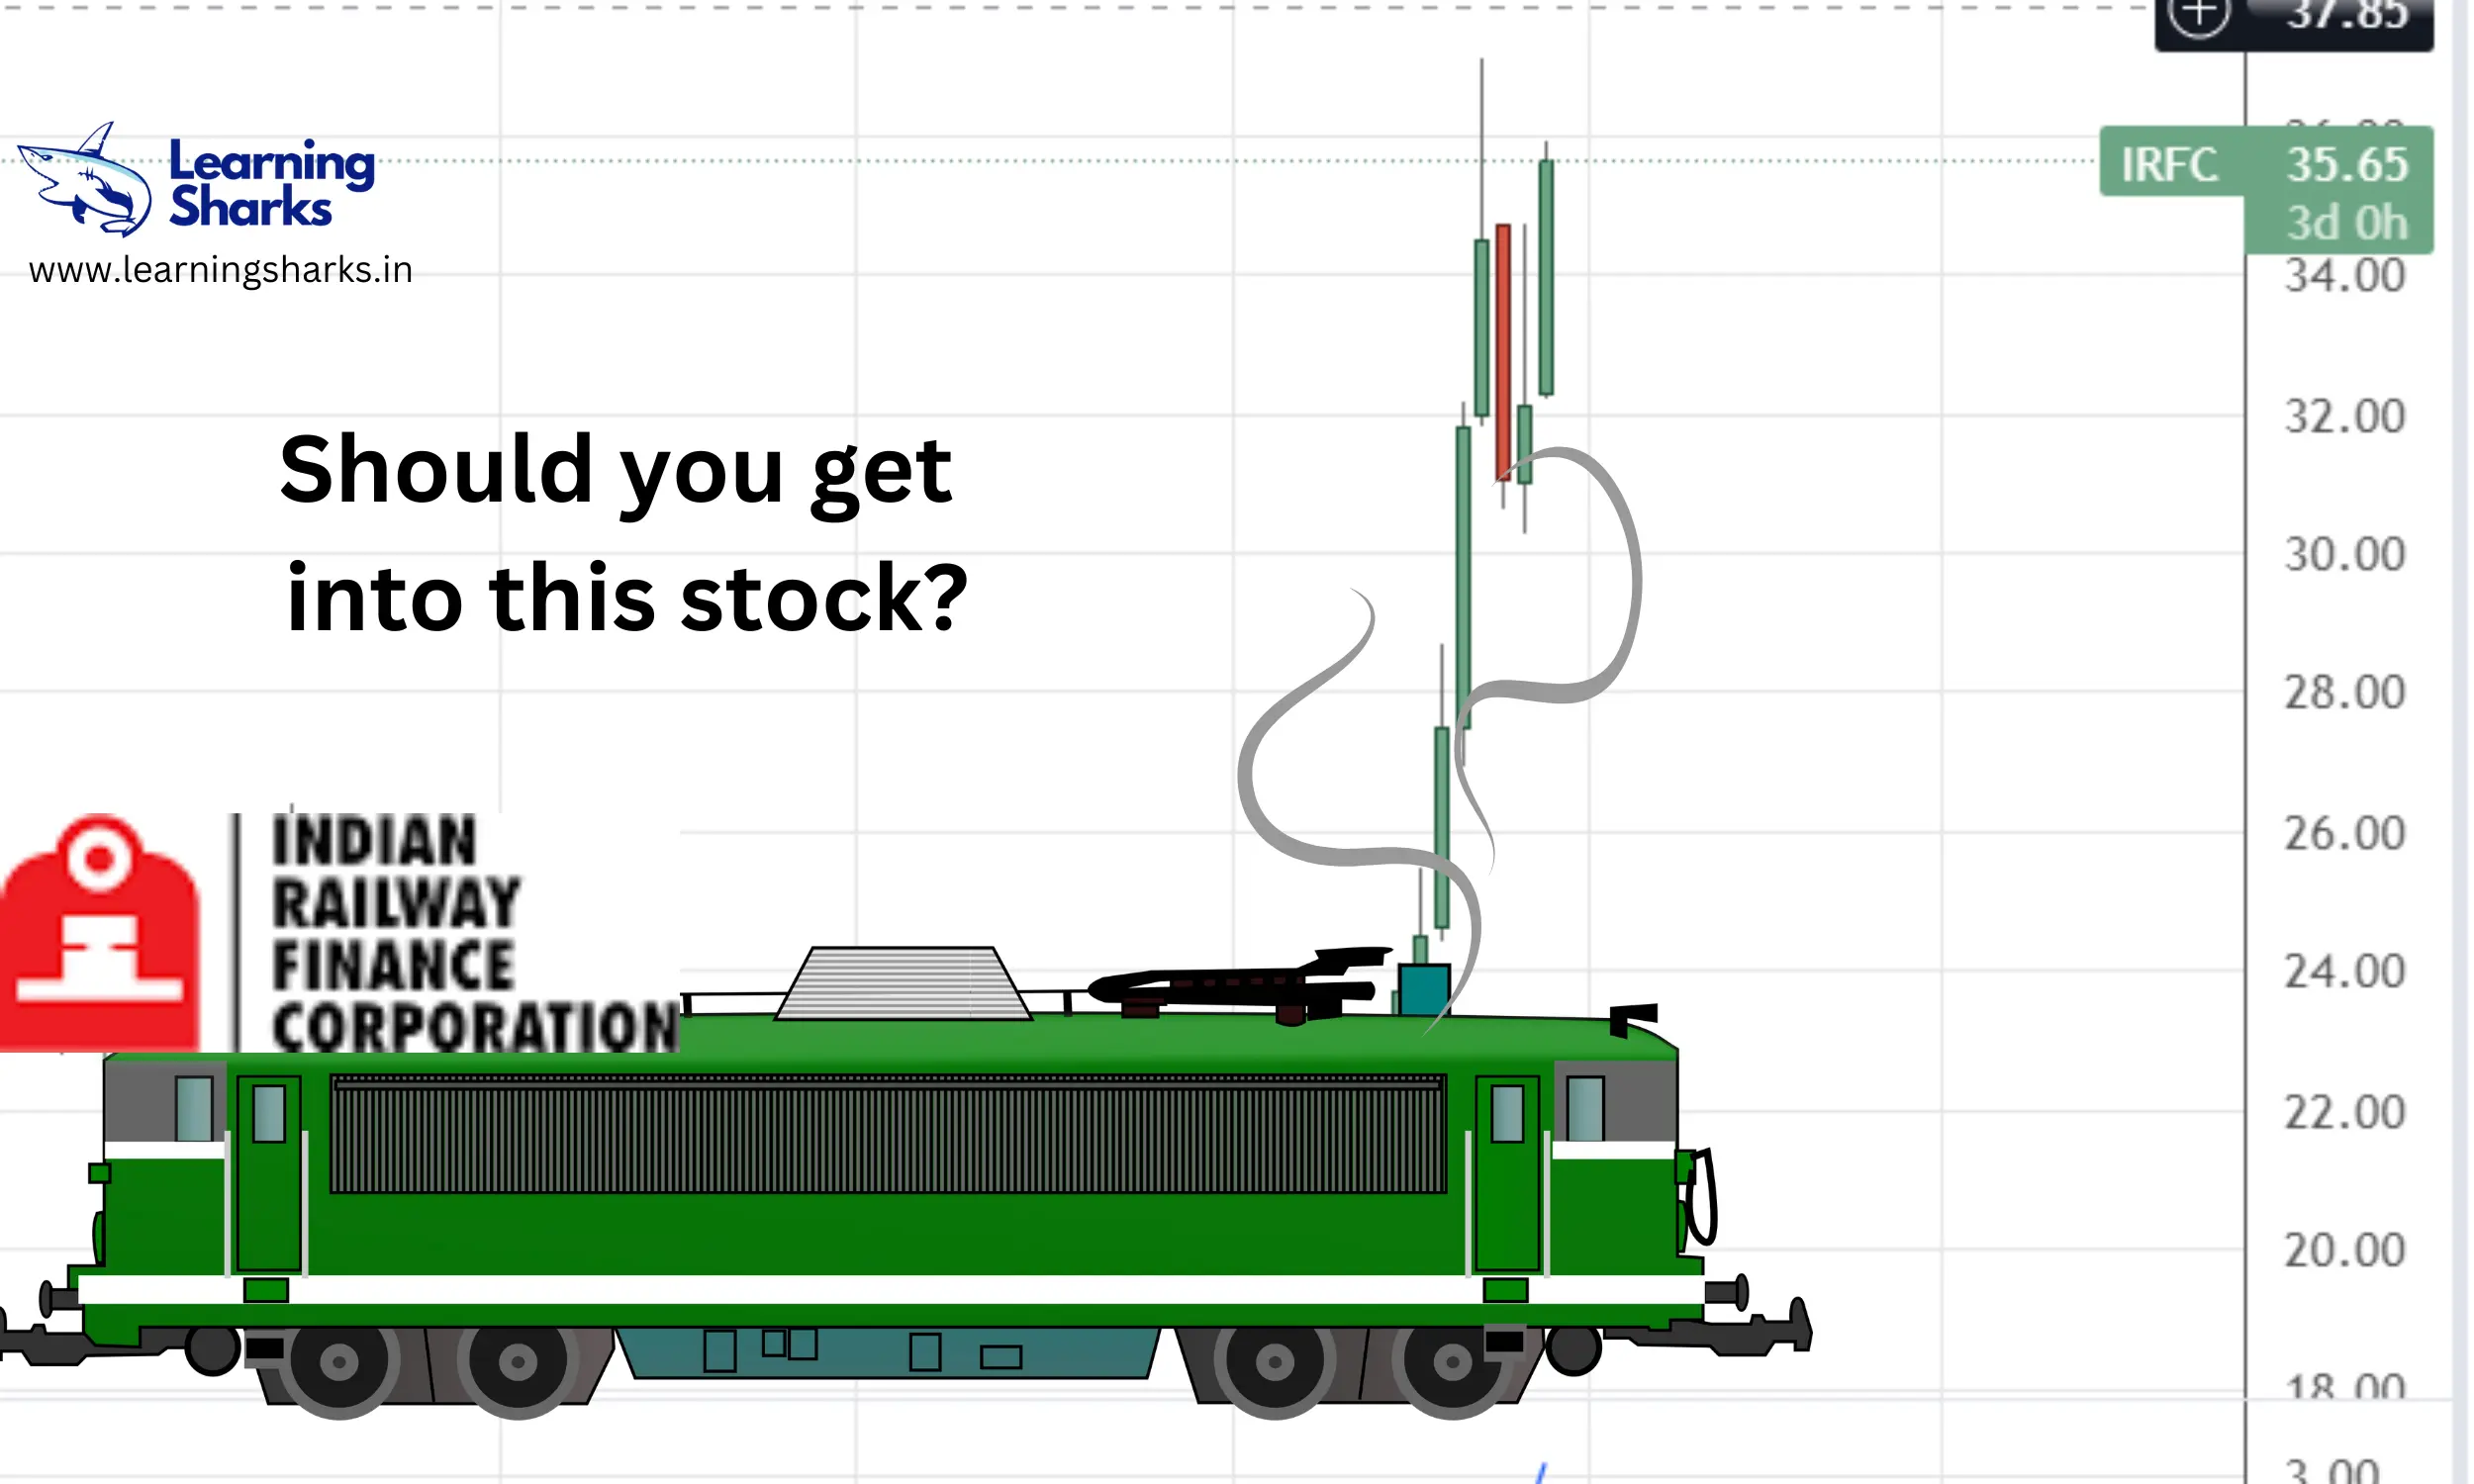
Should you invest in this SULA vineyard company?
Sula Vineyards shares make tepid market debut; share lists at 1.2% and is now trading -7.59% in Nse/BSE. The CMP of this share is 329.
Let’s look at the fundamentals of this stock.
Profit & Loss
Standalone Figures in Rs. Crores / View Consolidated
| Mar 2018 | Mar 2019 | Mar 2020 | Mar 2021 | Mar 2022 | |
|---|---|---|---|---|---|
| Sales + | 418 | 501 | 387 | 306 | 390 |
| Expenses + | 361 | 423 | 333 | 249 | 283 |
| Operating Profit | 58 | 78 | 54 | 57 | 107 |
| OPM % | 14% | 16% | 14% | 19% | 27% |
| Other Income + | 3 | 3 | 0 | 0 | 3 |
| Interest | 17 | 24 | 31 | 32 | 21 |
| Depreciation | 15 | 19 | 34 | 25 | 22 |
| Profit before tax | 29 | 38 | -12 | -0 | 66 |
| Tax % | 35% | 49% | 32% | -130% | 26% |
| Net Profit | 19 | 20 | -8 | -1 | 49 |
| EPS in Rs | 12.59 | 13.07 | -5.42 | -0.42 | 32.34 |
| Dividend Payout % | 0% | 0% | 0% | 0% | 0% |
Balance Sheet
Standalone Figures in Rs. Crores / View ConsolidatedCORPORATE ACTIONS
| Mar 2018 | Mar 2019 | Mar 2020 | Mar 2021 | Mar 2022 | |
|---|---|---|---|---|---|
| Share Capital + | 15 | 15 | 15 | 15 | 16 |
| Reserves | 310 | 328 | 311 | 312 | 399 |
| Borrowings + | 220 | 275 | 357 | 310 | 226 |
| Other Liabilities + | 130 | 143 | 160 | 110 | 116 |
| Total Liabilities | 674 | 761 | 843 | 747 | 757 |
| Fixed Assets + | 276 | 317 | 349 | 318 | 342 |
| CWIP | 1 | 2 | 0 | 0 | 1 |
| Investments | 21 | 26 | 26 | 21 | 27 |
| Other Assets + | 376 | 417 | 468 | 409 | 387 |
| Total Assets | 674 | 761 | 843 | 747 | 757 |
Conclusion
The company seems to be an excellent addition to your current portfolio. Considering the current market scenario, Sula vineyards may face resistance and take time to break. However, for the next 6 months, this price can touch up to 500 apiece.
#stockmarket #sharemarket #sulavineyards #ipo