Psychology and Risk Management
• What to expect
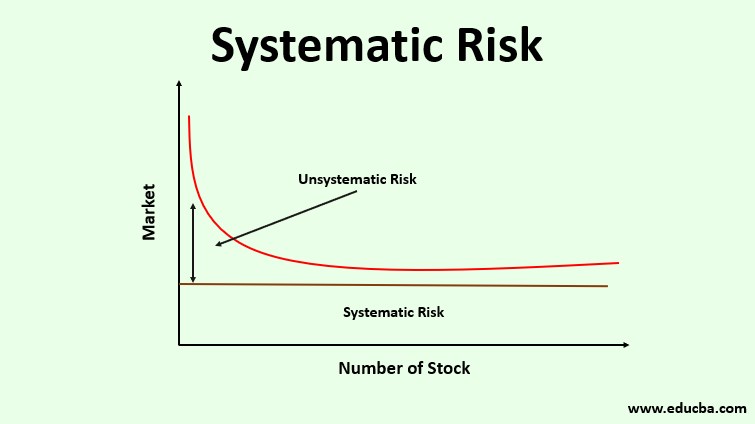
• Risks
• Position sizing
• illusion of control
• Accepting critisism
• Paralyzed by fear
• Loss is a feedback, not a failure
• The flexible trader
• Focusing on the positive
• Short straddle
• The dynamics of greed
• The herd mentality
• Notes
Loss is Feedback, Not Failure
Trading demands “thick skin,” just like any difficult activity. Criticism cannot readily injure a person. Being entirely open to criticism of any kind is necessary so that adjustments to one’s trading strategy can be addressed right away before losses accumulate. It takes the right mentality to be able to view criticism, which typically manifests as losses, from the appropriate angle. Instead of viewing criticism as a sign of personal failure, one must view it as unbiased input.
Most people start to establish their perspective on criticism at a young age. When kids are initially obliged to control their needs and impulses, such as when they are potty trained, according to Sigmund Freud, it may begin to develop.
However, other psychoanalysts contend that children’s ability to deal with the difficulties they face in school has a significant impact on how they learn to manage criticism.
Either a sense of superiority or inferiority develops in children. No matter when it occurs, there are huge variations in how people respond to criticism. Some people are particularly sensitive to criticism, whereas others like it.
Some people have extremely thin skin. They have spent their entire lives trying to find ways to shield themselves from punishment and broken feelings. Since they were frequently severely disciplined as children, they now have a tendency to anticipate punishment when they do anything wrong. They constantly search for what is “right” and what is “bad,” and they make every effort to avoid doing the latter. But this tendency has drawbacks as well.
One learns to view situations as either right or wrong, in black-and-white terms. One anticipates either being praised or penalised. One tends to avoid taking chances when they place too much emphasis on determining if their activities are right or bad.
One is prone to be cautious. One doesn’t learn how to make costly errors or how to bounce back from them since opportunities aren’t taken. When one has a setback, it is perceived as a terrifying event rather than as an opportunity to advance and find new approaches. Events, such as trading losses, are perceived as failures on a human level rather than as purely objective feedback that needs to be swiftly assessed so that adjustments may be made.
It’s imperative that you learn to evaluate a setback more objectively if you have problems seeing it as nothing more than honest feedback. Keep in mind that no one is watching you from behind.
Feel free to engage in any activity you like. Consider your trade with the same objectivity and dispassion that you do routine activities like driving a car.
Most people, for the most part, concentrate on the act of driving a car in a very detached and objective manner. You don’t think about how well you make a turn when you’re driving (in good weather on your typical route).
You just concentrate on the subsequent action, or the next item. There isn’t any self-criticism. You’re at ease. You are prepared to see the ensuing events.
Trading can be approached objectively in a similar way. Consider it in the same way as you would a driving lesson.
If you devote enough time and energy to developing your trading talents, you will eventually turn into a successful trader.
But you must maintain objectivity while doing so. Think about the procedure. Get as much feedback as you can and treat it as unbiased knowledge that will help you improve your trading abilities.
Profitable trading requires a particular talent. You’ll need to have the ability to view setbacks in the correct context if you want to master it.
Do not interpret setbacks as failures on your part. Do not at anyway personalise them. They only provide you with factual information that helps you gauge how well you are doing. Embrace the criticism.