Learning sharks-Share Market Institute


Rajouri Garden  8595071711 7982037049  Noida 8920210950 , and  Paschim Vihar  7827445731  

Fee revision notice effective 1st April 2025; No change for students enrolled before 15th May 2025

Download “Key features of Budget 2024-2025here

Trading system

Trading system

Basics of stock market

Why invest?
• who regulates
financial interdependence
• IPOs
• Stock Market returns
Trading system

• Day end settlements
• Corporate actions
• News and Events
• Getting started
• Rights, ofs,fpo and more
• Notes


6.1-Overview of Trading system

learning sharks stock market institute

Firstly, How could you possibly do it if I asked you to give me a real-time summary of the traffic situation?


Importantly, It is unlikely that you would check every road in the city to find the answer, even though there may be thousands of roads and junctions there. The better course of action for you to take would be to quickly check a few key intersections and roads in the four directions of the city and watch how the traffic is moving. If the traffic is chaotic on these roads, you can simply call the situation chaotic; otherwise, it can be thought of as normal.


Undoubtedly, The few key intersections and roads that you monitored to gauge the city’s overall traffic situation served as a barometer!

Making an analogy, how would you respond if I asked you how the stock market is performing right now? The National Stock Exchange has about 2,000 listed companies, while the Bombay Stock Exchange has about 5,000 listed companies. To check every company, determine whether they are up or down for the day, and then respond in detail would be awkward.

Instead, you would just check a few important companies across key industrial sectors. If a majority of these companies are moving up, you would say markets are up, if the majority are down, you would say markets are down, and if there is a mixed trend, you would say markets are sideways!

So essentially identify a few companies to represent the broader markets. Every time someone asks you how the markets are doing, you would just check the general trend of these selected stocks and then answer. These companies that you have identified collectively make up the stock market index!

6.2-The Index

learning sharks stock market institute

Fortunately, you don’t need to follow these particular companies closely to get a sense of how the markets are faring. To give you this information, the significant businesses have been pre-packaged and are under constant observation. The “Market Index” is the name of this pre-assembled market information tool.


In India, there are two primary market indices. The National Stock Exchange is represented by the CNX Nifty and the Bombay Stock Exchange by the S&P BSE Sensex.


Standard and Poor’s, a major credit rating agency, is known by the initials S&P. S&P has granted the BSE a licence to use their technical know-how in creating the index. As a result, the index also bears the S&P label.


The largest and most active stocks on the National Stock Exchange make up CNX Nifty. India Index Services & Products Limited (IISL), a partnership between the National Stock Exchange and CRISIL, is in charge of keeping it up to date. The letters “CNX” actually stand for CRISIL and NSE.


An ideal index gives us minute by minute reading about how the market participants perceive the future. The movements in the Index reflect the changing expectations of the market participants. When the index goes up, it is because the market participants think the future will be better. The index drops if the market participants perceive the future pessimistically.

6.3- Practical uses of the Index

learning sharks stock market institute

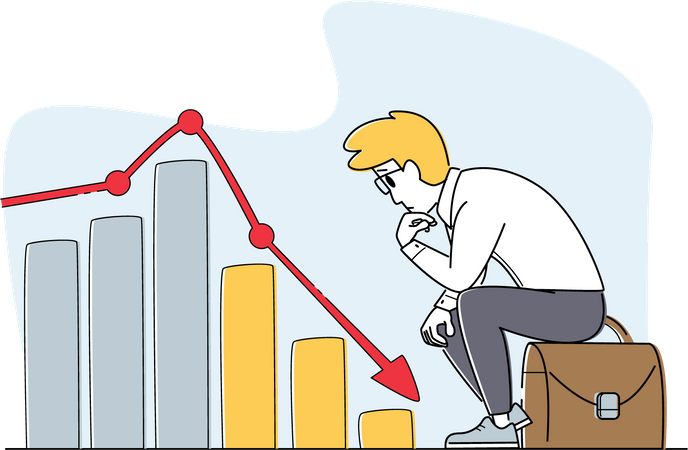
Information – Over time, the index reflects the broad market trend. The index gives a comprehensive picture of how the economy is doing in the nation. A rising stock market index is a sign that investors are upbeat about the future. Similar to how people have pessimistic views of the future when the stock market index is down.

For instance, the Nifty value on January 1st, 2014 was 6301, and on June 24th, 2014, it was 7580. This corresponds to an increase of 20.3 percent and a change of 1279 points in the index. This simply means that the markets have increased significantly over the time period under consideration, signalling a robust and optimistic economic future.


Benchmarking – For all the trading or investing activity that one does, a yardstick to measure the performance is required.  Assume over the last 1 year you invested Rs.100,000/- and generated Rs.20,000 return to make your total corpus Rs.120,000/-. How do you think you performed? Well on the face of it, a 20% return looks great. However, what if Nifty moved to 7,800 points from 6,000 points generating a return on 30% during the same year?

Well, suddenly it may seem to you that you have underperformed the market! If not for the Index, you can’t really figure out how you performed in the stock market. You need the index to benchmark the performance of a trader or investor. Usually, the objective of market participants is to outperform the Index.


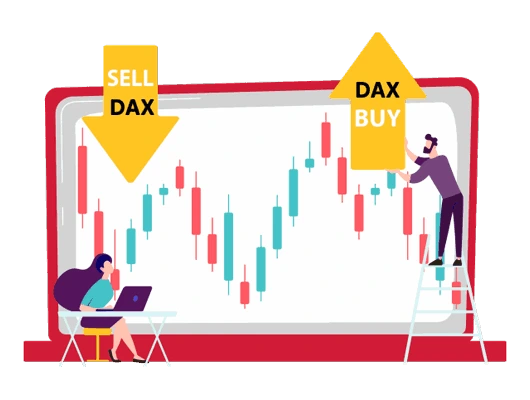
Trading – Trading on the index is probably one of the most popular uses of the index. Majority of the traders in the market trade the index. They take a broader call on the economy or general state of affairs and translate that into a trade.

For example, imagine this situation. At 10:30 AM, the Finance Minister is expected to deliver his budget speech. An hour before the announcement Nifty index is at 6,600 points. You expect the budget to be favourable to the nation’s economy. What do you think will happen to the index? Naturally, the index will move up. So to trade your point of view, you may want to buy the index at 6,600. After all, the index is the representation of the broader economy.

Portfolio Hedging –Typically, investors assemble a portfolio of securities. Ten to twelve stocks that they would have purchased with the long term in mind make up the average portfolio. Although the stocks are held for the long term, they may anticipate a sustained market downturn in 2008, which could deplete the portfolio’s capital. Investors can use the index to hedging the portfolio in such a case. This subject will be covered in the risk management module.

6.4 – Index construction methodology

learning sharks stock market institute

If one wants to advance as an index trader, it is crucial to understand how the index is built and calculated. As we previously covered, the Index is made up of numerous stocks from various industries that collectively reflect the state of the economy. An investment must meet certain requirements in order to be included in the index. As long as it meets the requirements, it should continue to be eligible as an index stock. The stock is replaced by another stock that meets the requirements if it fails to maintain the criteria.

The selection process is used to populate the list of stocks. A specific weighting should be given to each stock in the index. In plainer terms, weightage describes how much importance a particular stock in the index receives in comparison to the others. For instance, if ITC Limited has a 7.6% weight on the Nifty 50 index, then it is equivalent to saying that 7.6% of the movement of the Nifty can be attributed to ITC.

The logical question is: How do we give the stocks that make up the Index weights?

Weights can be assigned in a variety of ways, but the Indian stock exchange uses the free-float market capitalization method. The free-float market capitalization of the company determines the weights; the higher the market capitalization, the higher the weight.

The total number of outstanding shares on the market multiplied by the stock price results in the free float market capitalization.

If, for instance, company ABC has 100 outstanding shares and a share price of 50, its free-float market capitalization is 100*50, or Rs. 5,000.

 
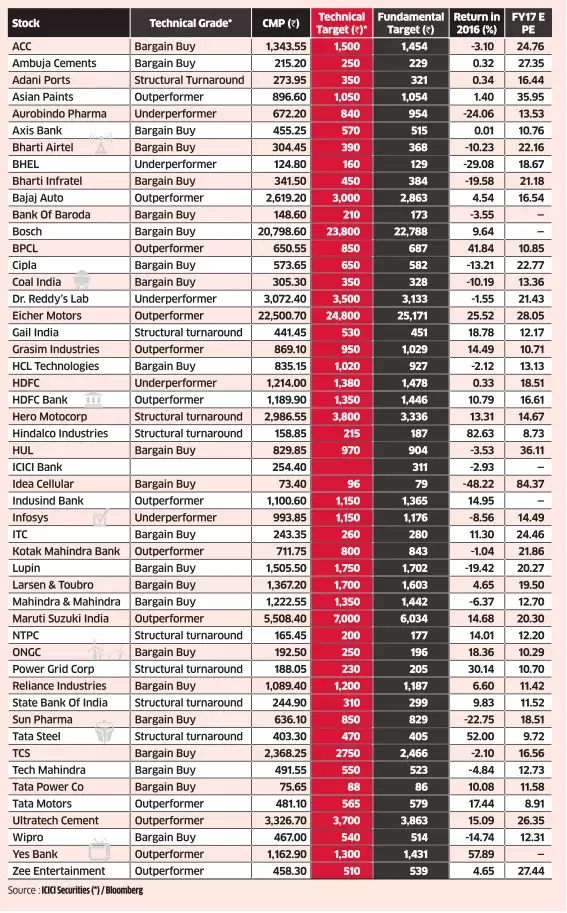
The 50  stocks that make up the Nifty at the time this chapter was written are listed below in order of their weight:
learning sharks stock market institute

6.5 – Sector-specific indices

learning sharks stock market institute

While the Sensex and Nifty represent the larger markets, other indices stand in for particular industries. We refer to these as sectoral indices. For instance, the Bank Nifty on the NSE symbolises the mood unique to the banking sector. The behaviour of all IT stocks on the stock markets is represented by the CNX IT on the NSE. Sector-specific indexes are available on the BSE and NSE. These indices are created and maintained similarly to other significant indices.

Appreciation

Undoubtedly,  learning sharks institute works hard to maintain this list of share market Training courses up to date. However, In the event of a dispute between the programs mentioned in the Learning sharks Academic Calendar and this list, the Calendar will take precedence nevertheless. In addition,  Please contact the Enrollment Desk if you have any further questions about admissions or program offerings. Nevertheless, Please contact us at feedback@learninghsharks.in to edit a program listing. Alternatively, you can reach us directly for any course queries. On the contrary, one can call our number 8595071711.


Even so, we launch new stock market integrated trading programs every 6 months. Despite stock market trends and conditions. While we have you here. Of course, we do not want to miss asking you to share a review. It is necessary and appreciated. our Trading community has been growing evidently. Surely, the credit goes to our mentors and our hard-working trading students. For this reason, we keep coming out with discounts and concessions on our programs. Besides, We believe each citizen has the right to learn about the market.


Because we believe each student should be successful. Since our program is so powerful. So, we encourage and invite more applications, therefore. Of course, we feel proud to invite the differently abled students too. Moreover, the stock market does not care about any race, religion, family background, or religion also. Then, again, We are there to assist you with the best education. Finally, head over to our contact page to speak to our counselor. For one thing, we do not want our students to fail, which is why give regular and repeated classes too.

First in Line and Ready for Action

Psychology and Risk Management

What to expect
Risks
• Position sizing
• illusion of control
• Accepting critisism
• Paralyzed by fear
• Loss is a feedback, not a failure
• The flexible trader
• Focusing on the positive
• Short straddle
• The dynamics of greed
• The herd mentality
• Notes

Security can be found in numbers. Have you ever observed an aquarium’s school of fish? They stick together because a single fish has a lower chance of being caught while swimming in the centre of a pack than when it is swimming alone if a larger fish is nearby and ready to consume one of them. Humans also go to “school” in their daily lives. For instance, it’s simpler to go fast in the middle of a group of automobiles on a deserted route. According to the reasoning, “the highway patrolman can’t pull us all over and give us all tickets.” Sometimes, especially when trading, it’s simpler to go with the flow. As they say,


“The trend is your friend.”

Following the crowd comes naturally to a lot of people. In our favour, it frequently works. Either we should move to the east side and blend in, or we should find out why none of our rich friends live on the west side of town. However, this way of thinking needs to be changed when it comes to trading. Before waiting to follow the mob, you must learn to anticipate what it will do next and to think for yourself. The primary purpose of trading is to make money by buying and selling stocks on the short term. It is challenging to achieve that if you are going with the flow.

learning sharks stock market institute

Many people find it natural to follow the herd. It often works in our favour. It’s in our best interest to find out why none of our wealthy friends reside on the west side of town, or to just move to the east side and blend in. But when it comes to trading, this way of thinking must be abandoned. You must develop the ability to predict what the mob will do next and learn to act independently before waiting to follow them. The main activity in trading is the short-term purchase and sale of equities for financial gain. If you are going with the flow, it is difficult to do that.


When buying a significant quantity of stock with the intention of selling it when the price rises a few points, you can’t wait for the general public to back up your predictions. Costs fluctuate in cycles. You risk trying to sell as the cycle brings the price back down if you wait too long for the price to hit a peak and for the market to buy a significant number of stock, validating your forecast. And by that time, the purchasing frenzy has passed, and you are probably trying to sell your stock when “fear” has set in and the majority of people are prepared to do so.


Ideally, you should buy stock when the public is going to embark on a buying spree, buy it at a lower price than they will gladly pay, and sell it to them then. You need to be the first person in line prepared to sell when everyone else is waiting in a different queue to buy. You must anticipate the next vogue and behave differently from the majority of people. In terms of realistic strategies, that is more challenging to put into practise.


To foresee the pivot points, for instance, you need precise momentum indicators. But psychologically speaking, one must also be willing to discard the lessons we have received throughout our lives about finding shelter by doing as others do. There is no safety in numbers in this situation. When it comes to trading, you must see the crowd as your rival rather than an ally. You must foresee what they will do and devise a strategy to profit from their anxiety and desire.


Remember that after the California Gold Rush, San Francisco’s mansions were not constructed by mining for rich metals but rather by providing food and other amenities to the large number of inexperienced miners looking to sate their greed. You must equally take advantage of the crowd and profit from their “herd mentality” as a trader. You must be the first to devise a plan to capitalise on their fear and greed to amass your wealth.

Margin Calculator

Forward Market

• Forwards market
• Futures contract
• Future trades
• Leverage & payoff
• Margin & M2M
• Margin calculator
• Open interest

• How to short
• Nifty futures
• Nifty futures
• Futures pricing
• Hedging with futures
• Notes

Margin Calculator (Part 1)

6.1 – The Margin Calculator

learning sharks stock market institute

We will now talk about the margin calculator as a follow-up to our chapter’s topic on margins. We will talk about the margin calculator and discover a few related subjects in the following two chapters.

Do keep in mind that we learned about the different kinds of margins  to start a futures trade in the previous chapter. Because margins are  on the volatility of the underlying, they differ from one future contract to another. Remember that volatility varies from one underlying to another, which causes margins to differ from one underlying to another. We will discuss volatility in more detail in the following lesson. So how can we find out what a specific contract’s margin requirements are? Well, if you trade with Zerodha, you probably already know about the “Margin Calculator.”

One of our most well-liked products is the Zerodha margin calculator, and for good reason. It is an easy-to-use tool with a highly advanced engine in the background. The margin calculator will be  to you in this chapter, along with the margin requirements for the contract you select. When we finish the chapter on options in the following module, we will go over this subject again and fully comprehend the adaptability of Zerodha’s margin calculator.

Let’s consider a scenario where someone chooses to purchase IDEA Cellular Limited’s futures contract, which expires on January 29, 2015. Now, one  to deposit the initial margin amount in order to start this trade. Additionally, the InitialSPAN Margin plus Exposure Margin equals Margin (IM). You only to complete the following to learn more about the IM requirement:

First, go to https://zerodha.com/margin-calculator/SPAN/ to see the margin calculator. Numerous possibilities are possible, as shown in the image below (I have  the same in black). But for the time being, we’ll concentrate on the first two choices, “SPAN” and “Equity Futures.” You will really get on the red- SPAN Margin Calculator subpage by default.

The SPAN Margin Calculator has two primary elements; let’s look at both of them in Step 2.

There are 3 drop-down menu selections in the red section. Choosing the exchange you want to run is essentially what is  of you in the ‘Exchange’ dropdown option. Decide –

  1. MCX if you want to trade commodities futures on MCX,
  2. NFO if you want to trade futures on NSE.
  3. To trade currency futures on the NSE, you must use CDS.

If you want to trade a futures contract, select Futures from the ‘Product’ drop-down menu on the right. If you want to trade options, select Options. The symbols for all of the futures and options contracts are  in the third drop-down menu. Select the contract you want from this drop-down menu.

Step 4: The Net Quantity is automatically set to 1 lot when you choose the futures contract. You must manually enter the new quantity if you want to exchange more than one lot. As you can see in the screenshot below, the net quality adjusted to the appropriate lot size, 2000, as soon as I chose the IDEA futures contract. I must enter 6000 (2000 multiplied by three) if I want to trade, say, three lots. After completing this, select the appropriate radio button (buy or sell, depending on what you want to do), and  click the blue “Add” button.

The split between the SPAN, Exposure, and total starting margin will be  once you have instructed the SPAN calculator to apply the margins. This is  in the red box in the illustration below:

The following are suggestions made by the SPAN calculator:

SPAN Margin = 22.160 Rupees

Exposure Margin = 14 730 rupees

Initial Margin = Rs. 36,890 (SPAN + Exp).

It’s that simple; now you know how much cash is  to start a futures trading on IDEA Cellular. The “Equity Futures” component of the margin calculator is the next intriguing section. The identical topic will be covered in the following chapter. To swiftly understand these three additional topics—Expiry, Spreads, and Intraday order types—we must first understand them. Once we understand these topics, we will be  better to understand the “Equity Futures” on the margin calculator.

6.2 – Expiry

The meaning of a futures contract’s “Expiry” was briefly explained in prior chapters. The contract’s expiration date, after which it will no longer exist, is by the term “expiry.” If I buy a futures contract for IDEA Cellular Limited at 149/- with an expiration date of January 29, 2015, anticipating that it will reach 155, it simply means that the move to 155 must occur by January 29, 2015. It goes without saying that I must book a loss if the price of IDEA drops below 149 before the expiration. It is useless to buy IDEA futures even if the price reaches 155 on January 30, 2015 (or any price above 149 in general).

Should it really be so rigid? Is there any leeway when it comes to extending the expiration date? As an example of what I mean:

Approximately one month from now, in the last week of February 2015, the Central Government is  to release its budget (considering today is 19th Jan 2015). This time around, I anticipate a strong budget, and in light of the ‘Make in India’ campaign, I’m optimistic that it will have a substantial positive impact on the manufacturing industry. Given this, I’m willing to wager that major manufacturer Bharat Forge will profit greatly from the incoming budget.To be more specific, I anticipate Bharat Forge to increase until the budget (pre-budget rally). I would like to purchase Bharat Forge’s futures right now in order to take advantage of my directional outlook on the company. Look at the illustration below:

Bharat Forge’s January 2015 contract is currently selling at Rs.1022/-, however given the current circumstances, in my opinion, Bharat Forge will increase in value from this point till the final week of February 2015. However, if I purchase the futures contract as indicated above, it will expire on January 29, 2015, leaving me stranded in the middle.

It is obvious that I am not  to purchase the January expiry contract because my directional view extends beyond that time frame. In fact, NSE gives you the option to choose a contract that satisfies the expiry criteria for reasons similar to these.

The NSE gives us the option to purchase a futures contract with three distinct expirations at any time. For instance, we have three Bharat contracts because it is January.

  1. 29 January 2015 – Also as the current month contract or near month contract.
  2. 2015-02-26 – This is to as the mid-month contract.
  3. March 26, 2015 – The far month contract is what it is as.

Look at the illustration below:

As you can see, depending on my particular , I may select any contract from the drop-down option for expiry that falls within the current month, mid-month, or far-month. It goes without saying that in this situation, I would select the mid-month contract that expires on February 26, 2015. (as shown below) –

The price change for futures is one element that comes out particularly clearly. The contract that ends on February 26, 2015 is currently trading at Rs. 1,032, while the contract that expires on January 29, 2015 is currently trading at Rs. 1,022.8. In other words, the mid-month contract costs more than the current-month contract. This is always true; the price increases as the expiration date approaches. In fact, the March contract for Bharat Forge Limited, which expires on March 29, 2015, is currently trading at Rs. 1,037.4/-.

For the time being, keep in mind that the price of the current month’s futures should be smaller than the prices of the mid-month and far-month futures. This has a mathematical basis, which will be .

Another crucial idea you should keep in mind is that, as I already indicated, the NSE always makes sure that three futures contracts—the current, mid, and far month—are available for trading. As of today, we are aware that the Bharat Forge contract will expire on January 29, 2015. This indicates that the January contract will no longer be valid for trading after 3:30 PM on January 29, 2015. Does that imply that starting on January 29, 2015, only the February and March contracts will remain in the system?

Not actually; the January contract is still in effect as of 3:30 PM on January 29th, 2015, after which time it will expire. NSE will launch the April 2015 contract on January 30 at 9:15 AM. Thus, we will have three contracts in effect as of January 30.

The February contract would now transition from the mid-month contract to the day before to the contract for the current month.

The mid-month contract would now be the March contract (graduated from being the far month the previous day to a mid-month now)

The recently adopted April contract is  to the far month contract.

The May contract will be  by NSE when the February contract ends. As a result, the market will be able to trade futures for March, April, and May. I could go on forever.

Anyway, sticking with the Bharat Forge Limited futures contract example, I can purchase the contract that expires on February 26, 2015 and hold it till I think it’s appropriate because I have a slightly longer time horizon. There is, however, yet another choice. I can purchase the January contract instead of the February contract, keep it until it expires or is extremely near to expiring, and  sell it. I can pay off the contract from January and purchase the one from February. This is  as a “rollover.”

If you frequently watch business news, the TV anchor will frequently discuss the “rollover statistics” right before the expiration time. Don’t be too perplexed by this, though; the process is actually fairly simple. They are attempting to convey a percentage measurement of the number of traders who have “rolled over” (or carried over) their current holdings to the mid-month. It is  as bullish if numerous traders are extending their open long bets into the following month; conversely, it is  as bearish if numerous traders are extending their open short holdings into the following month. That’s all there is to it. Is this a tried-and-true method for inferring specific market information? No, it’s only a perspective of the market.

So why would someone choose to roll over rather than purchase a long-dated futures contract? The liquidity, also as the ease of buying and selling, is one of the primary causes of this. To put it another way, more traders at any given time favour trading the current month contract than the mid or distant month contract. It goes without saying that the convenience of buying and selling improves when more traders are trading the same contract.

6.3 – Sneak Peek into Spreads

We are currently in a thrilling phase. The debate that follows may seem a little complex at times, but please read it through and make an effort to understand as much as you can. We will go into more information about this at the appropriate time in the future.

Just consider these two agreements:

  1. Futures on Bharat Forge Limited that expire on January 29, 2015
  2. Futures on Bharat Forge Limited that expire on February 26, 2015

For all intents and purposes, they are two distinct contracts with slightly different prices that receive their value from the same underlying, namely Bharat Forge Limited. As a result, they both behave similarly. Both the price of January futures and the price of February futures would increase if the spot market price of Bharat Forge stock increased.

Occasionally, circumstances arise whereby one can profit by simultaneously purchasing the current month’s contract and selling the mid-month contract, or vice versa. These kinds of opportunities are  as “Calendar Spreads.” The best way to spot these chances and put up transactions is a completely different subject. We’ll talk about this soon. But for now, I want to emphasise the importance of the margins.

We are aware of the rationale behind margin charges, which is mostly risk management. What amount of risk would there be if we bought the contract and sold the same kind of contract at the same time? The risk is significantly decreased. Let me use numbers to demonstrate.

First scenario: Trader purchases only January Futures from Bharat Forge Limited.

Spot Price for Bharat Forge is Rs. 1021 per share.

January contract price for Bharat Forge = Rs.1023/- per share

Size of Lot: 250

Assume that after purchasing, the current price falls to Rs. 1011/- (10 point fall)

Futures price as close as = Rs. 1013/-

P&L = (10 * 250) Equals loss of Rs. 2500

Scenario 2: Trader purchases January futures and sells them for February.

Spot Price for Bharat Forge is Rs. 1021 per share.

Long on the January contract for Bharat Forge at Rs.1023/- per share.

At Rs.1033/- per share, short the February Bharat Forge contract.

Size of Lot: 250

Assume that after placing this transaction, the spot price falls to 1011. (10 point fall)

January futures are approximately priced at Rs. 1013/-.

February futures are approximately priced at Rs.1023/-.

P&L on the January Contract equals (10 * 250) = a loss of Rs.

P&L on the February Contract is 10 * 250 for a profit of Rs.

Net P&L = – 2500 + 2500 = 0

A trader sells January futures and buys February futures in scenario three.

Spot Price for Bharat Forge is Rs. 1021 per share.

In the money on the January Bharat Forge contract at Rs.1023/- per share

Long on the February Bharat Forge contract at Rs. 1033 per share.

Size of Lot: 250

Assume that after this transaction is set up, the spot price rises to 1031. (10 point increase)

January futures are approximately priced at Rs.1033/-.

February futures are approximately priced at Rs.1043/-.

P&L for January Contract = (10 * 250) = Loss of Rs. 2500

P&L for February Contract = (250/10) = Rs. 2500 in profit

Net P&L = – 2500 + 2500 = 0

Clearly, the point that I’m trying to make here is that when you are long on one contract and short on another contract, the risk is virtually reduced to zero. However, it is not completely risk-free; one has to account for the liquidity, volatility, execution risk, etc. But by and large, the risk reduces drastically. So when risk reduces drastically, the margins should also reduce drastically.

In fact, this is what happens, have a look at the following snapshots –

This is the margin requirement (Rs.37,362/-) when we intend to buy January contracts of Bharat Forge.

The margin requirement (Rs. 37,629) is applicable when we plan to sell Bharat Forge’s February contracts.

And the margin  (Rs. 7,213/-) is as follows when we plan to simultaneously buy the January contract and sell the February contract.

As you can see, the January and February contracts each call for a payment of Rs. 37,362 and Rs. 37,629, respectively. Therefore, the total is Rs. 74,991. However, the risk is significantly reduced when a futures contract is bought and sold at the same time, thus the  for margin. As seen in the aforementioned graphic, the combined position only  a margin of Rs. 7,213/-. Another way to look at it is to say that the Margin Benefit (highlighted in black) is lowered from a total of Rs. 74,991 to Rs. 67,658 and is  passed on to the client. But keep in mind that a simultaneous long and short position is only created when chances present themselves. The “Calendar Spread” is the name given to these possibilities. There is no purpose in starting such trades if there is no calendar spread opportunity.

CONCLUSION

  1. You can easily determine the margin for a futures contract using the margin calculator.
  2. The built-in features of the margin calculator are very flexible.
  3. The SPAN and Exposure margins are divided up by the margin calculator.
  4. NSE makes sure there are always three contracts with the same underlying that expire in three separate (but consecutive) months at any one time.
  5. On the basis of the expiration date, a trader can select the contract of his choice.
  6. The contract for this month is to as the “Current Month Deal,” the contract for the following month as the “Mid Month Contract,” and the contract for the third month as the “Far Month Contract.”
  7. The current month contract expires with each renewal, and a new far month contract is initiated. The mid-month contract would eventually transition to the current month contract throughout this process.

  8. A trading strategy as a calendar spread is simultaneously purchasing one month’s contract and terminating another month’s contract for the same underlying.

  9. The margins needed to start a calendar spread are lower because the risk is so much lower.

Stock Market returns

Stock Market returns

Basics of stock market

Why invest?
• who regulates
financial interdependence
• IPOs
Stock Market returns
• Trading system

• Day end settlements
• Corporate actions
• News and Events
• Getting started
• Rights, ofs,fpo and more
• Notes


5.1 Overview of stock market returns

learning sharks stock market institute

We are now prepared to continue our investigation of the stock markets because we have a better understanding of the IPO process and what actually happens when a company moves from the primary to the secondary market.

Due to its status as a public company, the company is now required to make all information about it publicly available. On stock exchanges, shares of limited liability companies are traded every day.

Participants in the stock market trade for a limited number of reasons. This chapter will discuss these motives.

5.2 – What really is the stock market

The stock market is an electronic marketplace, as we covered in chapter 2. Buyers and sellers interact and exchange opinions.

Take At the time this essay was published, Infosys was coping with a succession problem, and the majority of its senior-level management experts were leaving the organization for internal reasons. It appears that the company’s reputation is suffering greatly due to the leadership void. The stock price consequently decreased from Rs. 3,500 to Rs. 3,000. The stock prices react whenever there are fresh reports about an Infosys management change.

Assume there are two traders – T1 and T2.

T1’s evaluation of Infosys Because it will be difficult for the business to find a new CEO, the stock price is expected to decline far more. The stock price will probably continue to fall.

If T1 trades as per his point of view, he should be a seller of the Infosys stock.

T2, however, views the same situation in a different light and therefore has a different point of view – According to him, the stock price of Infosys has overreacted to the succession issue and soon the company will find a great leader, after whose appointment the stock price will move upwards.

T2 should buy Infosys stock if the market behaves as it believes it should.

In Infosys, T1 will be a seller and T2 will be a buyer. 3, 000.

Now both T1 and T2 will place orders to sell and buy the stocks respectively through their respective stock brokers. The stock broker obviously routes it to the stock exchange.

The stock exchange must confirm that these two orders match, allowing for the execution of the trade. This is the primary job of the stock market – to create a marketplace for the buyer and seller.

learning sharks stock market institute

5.3What affects stock price?

Let’s keep using the Infosys example to better understand how stocks fluctuate. Consider yourself a market observer keeping tabs on Infosys.
The price of Infosys is 3000 at 10:00 AM on June 11th, 2014. The management announces to the media that they have succeeded in hiring a new CEO who will lead the business to greater heights. The new CEO will exceed expectations because they trust his ability and judgment to do so.

Two inquiries:-

  1. What impact will this news have on Infosys’ stock price?

  2. What trade would you make on Infosys, if you were to do so? Would it be a sell or a buy?

The stock price will increase, which is a straightforward response to the first query.

Infosys had a leadership problem, which the business has now resolved. Market participants frequently purchase the stock at any price when encouraging announcements are released, which results in a stock price surge.

Take note: The buyer is prepared to pay the seller’s desired prices. The share price usually increases as a result of this buyer-seller reaction.

So as you can see, the stock price jumped 16 Rupees in a matter of 5 minutes. Though this is a fictional situation, it is a very realistic, and typical behavior of stocks. The stock price tends to go up when the news is good or expected to be good.

In this particular case, the stock moves up because of two reasons. The corporation no longer has a leadership issue, and the new CEO is anticipated to take the company to new heights.

The answer to the second question is now quite straightforward; you purchase Infosys stocks taking into account the positive news that surrounds the stock.

Now, moving forward on the same day, at 12:30 PM ‘The National Association of Software & Services company, popularly abbreviated as NASSCOM makes a statement. For those who are not aware, NASSCOM is a trade association of Indian IT companies. NASSCOM is considered to be a very powerful organization and whatever they say has an impact on the IT industry.

The customer’s IT budget is anticipated to decrease by 15%, according to NASSCOM, which could have an impact on the sector going forward.

By 12:30 PM let us assume Infosys is trading at 3030. Few questions for you.

  1. What effects might this new information have on Infosys?

  2. What new trade would you start if you had access to this information?

  3. What would happen to the other IT stocks in the market?

The answers to the earlier queries are fairly straightforward. Let’s examine NASSCOM’s statement in more detail before we begin to respond to these questions.

According to NASSCOM, the customer’s IT budget is expected to drop by 15%. This indicates that IT company revenues and profits are most likely to decline soon. For the IT sector, this is bad news.

Now let’s attempt to respond to the questions above.

  1. Infosys a leading IT major in the country will react to this news. The reaction could be mixed because earlier during the day there was good news specific to Infosys. But a 15% drop in sales is a major issue, so Infosys shares are probably going to trade lower.

  2. If a fresh trade were to be started at 3030 based on the recently disclosed information, it would be a sell on Infosys.

  3. The data disclosed by NASSCOM is relevant to all IT stocks, not just Infosys. As a result, all IT companies will certainly experience selling pressure.

So as you notice, market participants react to news and events and their reaction translates to price movements! This is what makes the stocks move.

You might be mulling over a very practical and pertinent question at this point. What if there isn’t any news about a specific company today, you might be wondering. Will there be no change at all in the stock price?

Well, the answer is both yes and no, and it depends on the company in focus.

For example, let us assume there is no news concerning two different companies.

  1. Reliance Industries Limited

  2. Shree Lakshmi Sugar Mills

Reliance is one of the biggest companies in the nation, as we all know, and whether or not there is news, market participants want to buy or sell the company’s shares, causing the price to fluctuate constantly.

Due to its relative obscurity and the lack of news or events involving it, the second company might not catch market participants’ attention. In such cases, the stock price might not change at all, or if it does, it might change very little.

In conclusion, the expectation of news and events causes price movements. The news or events may have a direct bearing on the business, the sector, or the overall economy. For instance, the news of Narendra Modi’s selection as Indian Prime Minister caused the entire stock market to move.

learning sharks stock market institute

5.4 How is the stock transacted?

You decide to purchase 200 Infosys shares at 30.30 and hold them for a full year. What is the mechanism behind it? How exactly does one go about purchasing it? What happens once you purchase it?

Thankfully, there are systems in place that are logically integrated.

You must sign into your trading account, which is provided by your stock broker, after deciding to purchase Infosys. After you submit your order, an order ticket is generated with the following information:

  1. The details of your trading account, through which you intend to buy Infosys shares, show your identity.
  2. The price at which you intend to buy Infosys
  3. The number of shares you intend to buy

Your broker needs to confirm you have enough cash on hand to purchase these shares before sending this order to the exchange. If so, the stock market receives this order ticket. The stock exchange searches for a seller willing to sell you 200 shares of Infosys at 3030 once the order reaches the market using its order matching algorithm.

Now, the seller could be a lone individual willing to sell all 200 shares at $30 each, ten individuals selling 20 shares each, or two individuals selling 1 and 199 shares, respectively. It doesn’t matter what combinations and permutations exist. You have already placed an order for 200 shares of Infosys at 3030, which is all you need. As long as there are sellers in the market, the stock exchange guarantees that the shares are available to you.

The shares will be electronically credited to your DEMAT account after the trade is complete. The seller’s DEMAT account will likewise be electronically debited in order to purchase the shares.

learning sharks stock market institute

5.5 – What happens after you own stock?

After you buy the shares, they will remain in your DEMAT account. To the extent of your shareholding, you are now a shareholder in the business. To put things in perspective, 200 shares of Infosys equal 0.000035 percent ownership of the company.


You are instantly qualified for a number of corporate perks such as dividends, stock splits, bonuses, rights issues, voting rights, etc. simply by virtue of owning the shares. Later, we’ll go through each of these shareholder rights in more depth.

5.6- A note on holding period

learning sharks stock market institute

The holding term is the length of time you intend to keep the stock. You might be surprised to learn that the holding period could last anywhere between a few minutes and “forever.” Warren Buffet, a renowned investor, actually said “forever” when asked what his preferred holding period was.

In a previous example from this chapter, we showed how 5 minutes could cause Infosys stock to go from 3000 to 3016. Well, for a holding period of only five minutes, this return is actually pretty good! You can certainly close the trade and look for another opportunity if you are happy with it.

5.7- Where do you fit in?
learning sharks stock market institute

Every market participant approaches the market in a different, distinctive way. Their fashion changes as they advance and experience market cycles. The kind of market risk they are willing to take also determines their style. Whatever they do, they fall into one of two categories: traders or investors.

The definition of a trader is someone who recognizes an opportunity, enters the trade, and intends to profitably exit the trade as soon as possible. Typically, a trader views markets in the short term. During market hours, a trader is vigilant and constantly on the lookout for opportunities while weighing the associated risk and reward. He doesn’t care whether you go long or short.  We’ll talk more specifically about going long or short later.


There are different types of traders :

  1. Day Trader – During the day, a day trader opens and closes the position. His positions are no longer upheld. He dislikes taking overnight risks because he is risk-averse. As an illustration, he might purchase 100 shares of TCS at 2212 at 9:15 AM and sell them at 2220 at 3:20 PM, earning Rs. 800 in profit. A day trader often deals with 5–6 stocks every day.

  2. Scalper –  less time with the goal of quickly and modestly profiting. As an illustration, he might purchase 10,000 shares of TCS at 2212 at 9:15 and sell them at 2212 at 9.16. In this trade, he makes a profit of $1000. He would have made a lot of these trades in a typical day. A scalp trader is extremely risk-averse, as you may have noticed.

  3. A swing trader – holds onto his trade for a little bit longer; the holding period can last from a few days to weeks. Usually, he is more willing to take chances. As an illustration, he might purchase 100 shares of TCS on June 12 at 2212 and sell them on June 19 at 2214.

Traders like George Soros, Ed Seykota, Paul Tudor, Michael Steinhardt, Van K Tharp, Stanley Druckenmiller, and others have achieved great success.

An investor is a person who purchases stock with the expectation that the price will rise significantly. He is prepared to wait for the development of his investment. Investors typically hold their investments for a few years. Investors generally fall into one of two categories.

A)  Investors in growth Finding businesses that are predicted to grow significantly as a result of macro and emerging industry trends is the goal here. An iconic instance in the context of India would be the 1990s purchase of Hindustan Unilever, Infosys, and Gillette India. Due to the alteration in the industry landscape, these businesses experienced tremendous growth, creating.

B) Value traders The goal is to identify strong firms that are either established or growing yet have been wildly undervalued by the short-term market sentiment. These companies would be fantastic value purchases. L&T is one recent instance of this. L&T suffered significant harm in August or September 2013 as a result of short-term unfavorable sentiment. The stock price dropped to 690 from 1200. A company like L&T is viewed as inexpensive at 690, making it a solid value buy given its fundamentals as of August 2013. The stock price eventually scaled back to 1440 around May 2014, indicating that it did pay off.

Trading View

Technical analysis

Technical analysis
• Introduction
• Types of charts
• Candlesticks
• Candle sticks patterns
• Multiple candlestick Patterns
• Trading – get started
• Trading view

• Support  & resistance
• Volume trading
• News and Events
• Moving averages
• Indicators
• Fibonacci Retracements
• Notes

Interesting features in Trading view

If you haven’t already heard, Trading View is now available on Kite. The TradingQ&A post announcing the beta launch may be seen here.

Given this, I’d like to share a few of my favourite. Trading view (TV) features, which I think will be useful to you, especially if you’re new to TV. I’m not going to go over the most obvious charting elements on TV, which I’m sure are very simple to grasp. These are a few unusual ones that come in helpful when working with charts.


Multi timeframe setting

This function is not unique to television, but I believe it works better on television than on other platforms. I’m sure most of you are familiar with the various layout options.


Assume you want to trade ‘Indigo’ on an intraday basis. One thing you should consider before placing your order is how Indigo’s pricing changes over time. The consistent practise reduces the frequency from once a day to 15 or 5 minutes. While this fits the goal, it would be interesting to observe how the chart looks at different periods in real time. This allows you to anchor the price and have a view on where the current market price stands in relation to other timeframes. For example, I prefer to look at the 1-day, 30-minute, and 15-minute charts all at once.


With TV, you can do this very easy. Here’s how:


Select a layout that you are familiar with by clicking on the ‘Select Layout’ option in the top right corner. Because I want three charts, I chose a three-chart arrangement that matches my needs.


This is how the chart layout looks after you select it. All three charts now show the same scrip and time frame, i.e. Indigo’s 1-day chart –


Also, the one on the left panel is highlighted among the three charts, as indicated by the blue border.


The following step is to switch the time frame between the three periods. My personal preference is to keep the left panel at the frequency on which I expect to trade, i.e. 15 minutes, the right top panel at 30 minutes, and the right bottom panel at 1 day. You can adjust the time-frequency by clicking on the chart (the chart is highlighted and a blue border appears) and selecting the desired frequency. A red arrow indicates the frequency change option.


With this structure, I can now view all of the price movements throughout all time periods in an one shot.


Once you get this set up, you can do some interesting things. The crosshair, for example, is in sync here –


When you place the crosshair on a specific price point, it shows across all time periods at the same time. This allows you to have a perspective on the price action as it unfolds over multiple time spans.


If you wish to focus on one of the three charts, click the toggle button at the right bottom. This will magnify the chart and help you focus better –


You can annotate the chart, write notes, and limit its visibility to a specific timeframe. For example, the end-of-day chart may indicate a double top; if so, I’ll be ready with my shorts. This, however, is at the end of the day chart. So I can just remark on that chart. Select a text box by clicking on the text options –


Drop the text box to the desired time range and scribble your comments –


That’s with the multi-timeframe functionality, which I believe is useful for intraday transactions.


Undo Redo

This is a wonderful feature that I enjoy. Many times, I muck up the charts by putting trend lines and indicators that don’t make sense, such as this one –


In most other platforms, you’d have to select the trend line and erase it if you wanted to get rid of it. This is something you can do on TV with a single click. Please keep in mind that the undo functionality only undoes the most recent activity.


Visibility

This is yet another interesting feature. The visibility options allow you to visualise a specific drawing or trend line only within a specific time period. Here’s an example of a Fibonacci retracement on an end-of-the-day chart –

When I switch to an hourly chart, I can still see the Fibonacci retracement –


This can be a distraction because the study may not be applicable to this time range. You can fix the research solely to the relevant time frame on TV, and if you change the time frame, the study will not display.


To do so, double-click on the study and select Settings –


I’ve stated that the study should only be visible at the end of the day chart. As a result, if I modify the frequency, this study will no longer appear.


Go to date

This one is fantastic. How many times have you wanted to know how the stock price behaved on a certain date at a specific time? Let’s say I want to know what Infy did on January 2nd, 2019, at 12:30 PM. To figure this out, you normally have to scroll through the charts, and after a little trial and error, you’ll come up with the exact date. There is no such trouble with television because it includes a ‘Go-to’ feature. This tool is so effective that it can take you to the exact candle, even if you’re using it intraday. This is visible at the very bottom of the chart –


I’m looking at the March 5th, 12:15 PM candle –


Hd Images

How many times have you made a significant chart with a lot of research on it? You want to share it with a friend via what applications or tweet it, but you end up taking a snapshot of the chart, which produces an unappealing effect. You can avoid this by snapping high-quality photos of the chart while watching television.


All you have to do to get the image is press ‘Alt + S’ –


This will give you an option to either save the image or tweet it.


I’ll keep this chapter open. I’ll add more interesting features as I discover them myself. Meanwhile, if you have something interesting to share, go ahead and comment below.

Happy trading!


Getting Worked Up For Nothing

Psychology and Risk Management

What to expect
Risks
• Position sizing
• illusion of control
• Accepting critisism
• Paralyzed by fear
• Loss is a feedback, not a failure
• The flexible trader
• Focusing on the positive
• Short straddle
• The dynamics of greed
• The herd mentality
• Notes

Since Rohan has been trading for the past five years, he has worked extraordinarily hard. He took on two jobs to earn enough money to trade with a reasonable probability of success. He spent his evenings and weekends mastering cutting-edge trading strategies. Has it generated any profits? No! rohan is getting frustrated. He has made sacrifices and exerted heroic effort, but he can’t help but feel that his trade objectives are nothing more than wishful thinking. Ever experienced this? Those of you who have been trading in the markets for a while understand exactly what I mean. But in these circumstances, you must think strategically rather than emotionally.

learning sharks stock market institute

Success requires a positive outlook, yet it can be challenging to stay upbeat when encountering numerous failures. It’s normal to become irritated. Your feelings take control. You start to feel frustrated in your ideas. It’s not fair, you begin to think. Since I worked so hard, I SHOULD be rewarded greatly. Although it would be good if the markets behaved as per our expectations, we must follow the markets wherever they lead. We must embrace both the gifts and the burdens that the markets wish to bestow upon us. You won’t ever profit from the markets if you give in to pessimism and dissatisfaction.


What is your method? Recognize that trading presents challenges first. Don’t approach trading in a naive manner. Don’t let yourself believe that it is simple. You’ll only set yourself up for failure, which will make you bitterly unhappy if you have a setback. Hard does not equate to impossible. Recognizing the difficulties involved in understanding the markets can help you create a practical strategy for overcoming issues. Next, express your frustration. Dr. Ari Kiev, a trading specialist, contends that if you accept your emotions, they will go away. When you acknowledge your frustrations as they arise, you may prepare to go past the obstacle after they have passed. Third, you need to be prepared to develop a positive outlook. Remain optimistic.

Trading is one skill that may be learned. If you make the effort, you will be successful. It’s possible that you won’t find success immediately away. Even though you might not be a natural merchant, you will be prosperous. Last but not least, avoid letting feelings influence your judgement when making choices. Instead of emotionally reacting to setbacks, it’s critical to focus on finding solutions. Keep your patience. When you experience a setback, get back up. You’ll discover that if you work hard enough, you can attain your financial objectives.


Our location

Refuting Core Beliefs

Psychology and Risk Management

What to expect
Risks
• Position sizing
• illusion of control
• Accepting critisism
• Paralyzed by fear
• Loss is a feedback, not a failure
• The flexible trader
• Focusing on the positive
• Short straddle
• The dynamics of greed
• The herd mentality
• Notes

Stock Market Refuting core beliefs Our views and expectations determine our trading strategy. For instance, if we are very afraid, we won’t want to take chances and, at our most extreme, we might even be afraid to place a transaction. Whether conscious or not, our expectations have a significant impact on how well we trade.

Every typical worry that traders experience has underlying core assumptions and ideas that should  recognise and debunk. For instance, Mark Douglas lists four trading anxieties that lead to many trading mistakes in his book “Trading in the Zone”: being incorrect, losing money, missing out, and leaving money on the table, because of many anxieties of these fear of failing. 

learning sharks stock market institute
Sourse: Tickertape

For instance, the fundamental presumption behind the fear of failure is the conviction that one must be wholly competent, sufficient, and successful. According to Ellis, having such a notion causes worry and anxiety, which in traders frequently results in hesitancy and self-doubt. It makes sense how this belief came to be. Growing up, we frequently experience negative repercussions for not being meticulously skilled, whether at home, school, or job. As a result, we start to assume that we must be totally competent, adequate, and successful in whatever we do. But there is a cost to this belief.


If we have the mindset that we must always succeed, we will spend all of our precious psychological energy worrying about what will happen if we fail rather than concentrating on what we are doing right now to carry out our present trading strategy. Traders who feel they must possess a high level of competence spend their whole day worrying about what they did incorrectly, what could go wrong, and how they will rebound if they fail. These ideas detract from the present experience and make it difficult to accurately and consistently interpret current market behaviour.

Let go of your fear of failure if you want to succeed in trading. You don’t need to be flawless. One is destined to make mistakes every now and again, as any seasoned trader will tell you, and if you are concerned with avoiding them, Stock Market Refuting core beliefs, you’ll be so anxious and afraid that you will make even more blunders. To disprove the fundamental idea that drives the fear of failure: Remind yourself that you don’t need to think you need to be completely competent, adequate, or successful. No trader can meet that bar, and strangely, attempting to do so would only result in failure and incompetence.


Our location

Fear of a Sudden Turn of Events

Psychology and Risk Management

What to expect
Risks
• Position sizing
• illusion of control
• Accepting critisism
• Paralyzed by fear
• Loss is a feedback, not a failure
• The flexible trader
• Focusing on the positive
• Short straddle
• The dynamics of greed
• The herd mentality
• Notes

Things have been going well for the previous few months and you currently have a number of roles open. Following a Fear of a Sudden Turn of Events month of terrible weather and natural calamities, there is a sudden increase in interest rates. The markets decline as would be predicted, and many of your positions lose value. How do you behave? A seasoned trader would simply wait it out. You wait for the market to resume its previous trajectory after realising that the modest drop is just transitory. However, many traders are unsure about how to respond. They worry and begin to believe it’s the beginning of a significant bull market when they see their portfolio lose money. What is your typical response? Fear is a common factor.


But when it comes to investing, fear may be fatal.

learning sharks stock market institute

Fear of a Sudden Turn of Events propensity is biologically and genetically based. Fear and the fight-or-flight reaction are connected. Animals employ fear as a very basic survival mechanism, and it is regulated by brain regions that are really rudimentary. The instinct to either fight or retreat can be incredibly adaptive. A wild animal must gather its resources and decide quickly whether to resist the threat or run away to safety when damage is suspected. However, the fear instinct might divert you from your intended direction while trading the markets. You don’t want to lose control of your emotions and sell off your holdings hastily because you wrongly think that a brief slump heralds approaching disaster. Instead, you should calmly and logically weigh your options before making a decision.


It’s crucial to control your fear and prevent it from leading you to act inappropriately. But it’s sometimes challenging to remain rational when your money is on the line. How do you manage your fear? Ari Kiev provides a simple method for managing fear in his book “Trading to Win”: When you admit that you are terrified, the emotion will leave your body and lose all of its power. Refusing to accept your fear will only cause it to persist, however acknowledging your fear will cause it to lessen.


Simply acknowledging your fear is the first step toward overcoming it. Trading modest positions is a second strategy for controlling fear. Your risk-taking is lower and your likelihood of feeling dread is lower the less money you have on the line. 3. Control risk. You will feel more at peace and be able to handle worry more readily if you use protective stops and only risk a tiny portion of your capital on one trade. Fourthly, you can trade more circumspectly by ensuring that your trading strategy is in line with a larger trend.


Consider a day trade where your prediction is that the market will be bullish. You will be incurring less risk if the market’s longer-term trend is similarly optimistic. Even if the market goes against you during the trading day, you are aware that, in the worst event, you can wait it out and either minimise your losses or even profit. Finally, if things become too emotionally taxing, you can take a break and engage in paper trading. If you are particularly prone to fear, it is likely because you have recently executed a number of losing transactions. As a result, anxiety has become “associated” or “classically conditioned” with losing trades. You instantaneously and naturally get afraid when you start a trade.


“Systematic desensitisation” or “counter-conditioning” is a successful technique psychologists have used to overcome excessive Fear of a Sudden Turn of Events, This technique basically takes advantage of the fact that it is impossible to concurrently experience both the terror response and the relaxation response. An incident that previously caused fear will lose its power and no longer cause fear if you feel comfortable and prevent the fear response from happening. Imagine that you are placing a trade, but since no money is at danger, you won’t experience much dread. You are prepared to increase the risk once you can manage your fear while trading on paper.


Place a low-risk deal of modest size. Once more, make an effort to unwind and suppress the dread response. If you start to feel anxious, switch back to trading on paper until you can use a relaxation technique to stop the anxiety response from happening. Work your way up to placing a relatively risky trade by gradually executing trades that require more risk until you can do so without feeling nervous. Avoid letting fear get in the way of your trade at all costs. Be able to manage your fear. You can trade successfully if you can do it unrestrictedly and coolly.


Our location


Making Sense of it All

Psychology and Risk Management

What to expect
Risks
• Position sizing
• illusion of control
• Accepting critisism
• Paralyzed by fear
• Loss is a feedback, not a failure
• The flexible trader
• Focusing on the positive
• Short straddle
• The dynamics of greed
• The herd mentality
• Notes

People are “lay scientists,” according to social psychologists, who are Making Mistake in stock market, use this phrase frequently. Like academic scientists, they seek to comprehend their environment. They develop and test hypotheses. However, they use their daily experience to test out hypotheses they have about people rather than performing formal experiments. When we learn how to trade, we follow the same procedure. We research the markets and attempt to formulate our own unique beliefs regarding how they operate. However, since we don’t perform formal experiments, we can be susceptible to psychological biases. The false consensus effect is Making Mistake in stock market, one of these psychological biases. We have a tendency to believe that others share our beliefs and behave in the same way that we do, but this perspective is limited, and it can lead us astray.

learning sharks stock market institute

Trading in the short term frequently involves predicting what the masses will do. Will they purchase or sell? It might be challenging. Consider the previous two weeks. One may assume that the general public would flee the markets in light of the conflict, the hurricane, and the high price of oil. However, they didn’t. It proves that you can’t always predict how people would react to events happening around the world. It all comes down to having the proper perspective, which can occasionally be challenging to discover. Even though it could be difficult, we must at least attempt it.


One of the common wisdoms that might influence our actions is the false consensus effect. Social psychologists have shown that people consistently overestimate the number of those who agree with them, regardless of the decision you ask them to make, the significance of the issue, or the choice taken. It’s human nature to think that our actions are reasonable, appropriate, and similar to what our coworkers and peers would do in the same circumstances. We use our choices as a “anchor” and assess what other people might do in light of them. Being overconfident may be a result of this bias in judgement.


The process by which people choose their course of action is one theory for the false consensus effect. People attempt to put together evidence to reach a conclusion while deciding on a position. They eventually group all the evidence that favours one course of action over another, dismissing contradicting evidence. Once a decision has been taken, the supporting information is immediately “accessible” in memory and is simple to recall. People still have these numerous pieces of confirming data in mind, are able to recall them with ease, and assume that others will behave as they do based on the information they remember when asked to estimate the number of people who would reach a similar conclusion. People tend to Making Mistake in stock market, assumptions about what other people will do rather than relying on accurate facts.


In the world of trading, this prejudice frequently manifests. Trading requires ongoing foresight into how the general public will act. You consider and analyse the information in front of you, then come to a conclusion. However, your own perspective is the only one you can rely on. And that viewpoint might be incorrect.

How may the false consensus effect be countered? Learning about it is the best way to defend yourself. Keep in mind that you are acting based on incomplete knowledge. You can get around this trade reality, but you must embrace it.


Always be wary of promises. Manage your risk and be willing to admit that you might be Making Mistake in stock market, You are human, after all, and occasionally you are going to make biassed conclusions. It’s better to accept it and go on than to beat yourself up over it.


Our location

False Consensus Effects

Psychology and Risk Management

What to expect
Risks
• Position sizing
• illusion of control
• Accepting critisism
• Paralyzed by fear
• Loss is a feedback, not a failure
• The flexible trader
• Focusing on the positive
• Short straddle
• The dynamics of greed
• The herd mentality
• Notes

False Consensus Effects

Let’s say you chose to buy more bpcl shares. How many additional investors would you expect to support your choice? When faced with such a situation, people have a tendency to overestimate the number of people who will take the same course of action. The False effects in stock market “false consensus effect” is the name given to this bias in decision-making.

Social psychologists have shown that people consistently overestimate the number of people who will agree with them, regardless of the choice they are asked to make, the significance of the issue, or the importance of the issue. We all have a tendency to think that our actions are generally acceptable, typical, and consistent with what our coworkers and peers would do in a comparable circumstance.

We all have a tendency to think that our actions are generally acceptable, typical, and consistent with what our coworkers and peers would do in a comparable circumstance. We use our choices as a “anchor” and assess what other people might do in light of them. Being overconfident may be a result of this bias in judgement. Once we make a choice, we often believe that we are right and that other people would concur with us. Though they might not.

The process by which people choose their course of action is one theory for the false consensus effect. People attempt to put together evidence to reach a conclusion while deciding on a position. They eventually group all the evidence that favours one course of action over another, dismissing contradicting evidence. Once a decision has been made, the supporting information is “accessible” in memory and is simple to recall. People still have these numerous pieces of confirming data in mind, are able to recall them with ease, and assume that others will behave as they do based on the information they remember when asked to estimate the number of people who would reach a similar conclusion. People tend to make assumptions about what other people will do rather than relying on accurate facts.

learning sharks stock market institute
Image by user testing

However, there is some evidence to suggest that one’s propensity to arrive at a misleading consensus estimate relies on how confident they are in their choice. For instance, Drs. Gary Marks and Norman Miller altered the degree to which participants felt certain about a choice they had made. The estimation of the number of people who would adopt the same course of action depends on how confident one is in their choice. Therefore, the more certain we are about a choice, the more we think others will act in a similar manner. Our sense of overconfidence is further increased by these inaccurate consensus assessments.


How may the False effects in stock market, and false consensus effect be overcome? It is usually advisable to approach all of your choices with scepticism. Think about how people tend to make decisions based on information they can recall and seek for information that confirms it. It takes all of our mental effort to put information together that supports our decision together, but we must also search for information that contradicts our judgement because making a decision is so difficult. Therefore, take a step back after gathering your data and before making a decision and ask yourself, “Am I succumbing to a decision-making bias?” Was my evaluation of the facts objective or was it an effort to support an already held belief?

Always keep in mind that several typical decision-making biases, such as the false consensus False effects in stock market, can affect your perceptions.


Our location