Learning sharks-Share Market Institute


Rajouri Garden  8595071711 7982037049  Noida 8920210950 , and  Paschim Vihar  7827445731  

Fee revision notice effective 1st April 2025; No change for students enrolled before 15th May 2025

Download “Key features of Budget 2024-2025here

News and Events

Overview of News and Events

Basics of stock market

• Why invest?
• who regulates
• financial interdependence
• IPOs
• Stock Market returns
• Trading system

• Day end settlements
• Corporate actions
News and Events
• Getting started
• Rights, ofs,fpo and more
• Notes


learning sharks stock market institute

9.1 Overview

A market participant may find it insufficient to make decisions solely on the basis of company-specific information. Understanding the events that affect the markets is also crucial. Numerous external factors, such as economic and/or non-economic events, have a substantial impact on the performance of equities and markets as a whole.

We’ll attempt to comprehend some of these events in this chapter, as well as how the stock market responds to them.

Also, interdependent financial intermediaries work together to form the ecosystem that supports the financial markets. You can learn more about these financial intermediaries and the services they provide by reading this chapter.c

learning sharks stock market institute

9.2 – Monetary Policy

One of the most crucial financial intermediaries you should be aware of is the stockbroker.

Whereas stockbroker is a business that has registered with the stock exchange as a trading member and has a stockbroking license. They adhere to the rules established by SEBI.

Your entry point into stock exchanges is a stockbroker. To begin, you must open a “Trading Account” with a broker who satisfies your requirements. Your requirement might be as straightforward as the broker’s office’s proximity to your home. At the same time, finding a broker who can give you a single platform through which you can conduct business on numerous exchanges around the world can be challenging. We’ll go over what these requirements might be later on, as well as how to pick the best broker at this time. Firstly you can conduct financial transactions in the market using a trading account. A trading account is a brokerage account that enables the investor to buy and sell securities.

The Reserve Bank of India (RBI) uses monetary policy as a tool to manage the money supply by regulating interest rates. They adjust interest rates to achieve this. The RBI is the nation’s main bank. The central bank of every nation on earth is in charge of deciding on interest rates.

The RBI must strike a balance between growth and inflation when determining interest rates. Simply put, if interest rates are high, borrowing costs are also high (particularly for corporations). Corporations cannot expand if borrowing is difficult. If businesses don’t expand, the economy sputters.


On the other hand, borrowing is simpler when interest rates are low. This results in more money in the pockets of businesses and customers. With more money comes more spending, which causes retailers to raise prices, which causes inflation.

The RBI must carefully set a few key rates and take into account all the variables to achieve balance. Economic chaos can result from any inequity in these rates. The following are the important RBI rates that you should monitor:

Repo Rate: Banks can borrow money from the RBI whenever they need to. The repo rate is the interest rate at which the RBI lends money to other banks. The cost of borrowing is high when the repo rate is high, which causes the economy to grow slowly. In India, the repo rate is currently 8%. Markets disagree with the RBI’s decision to raise repo rates.

Reverse repo rate – The reverse repo rate refers to the interest rate at which the RBI borrows money from banks. Banks are happier to lend money to RBI than to a corporation because they are confident that RBI won’t default when they do so. However, the amount of money available in the banking system declines when banks decide to lend money to the RBI rather than a corporate entity. Reverse repo rate increases tighten the money supply, which is bad for the economy. Right now, the reverse repo rate is 7 percent.

Every bank must abide by the cash reserve ratio and maintain funds on deposit with the RBI (CRR). The CRR affects how much they keep in reserve. The economy suffers because more money is removed from circulation as CRR rises.

Every two months, the RBI meets to discuss rates. The market keeps an eye out for this important event. Interest-rate-sensitive stocks from a variety of industries, including banks, automobiles, housing finance, real estate, metals, etc., would be the first to respond to rate decisions.

9.3 – Inflation

Inflation is the term used to describe a steady increase in the average price of goods and services. The value of money decreases as inflation rises. If everything else is equal, inflation is to blame for the price increase if the price of 1 kg of onions went from Rs. 15 to Rs. 20. Although inflation is unavoidable, a high inflation rate is not preferred because it might cause economic unrest. A high inflation rate typically sends the markets the wrong message. Governments strive to bring inflation down to a manageable level. An index is typically used to calculate inflation. Inflation is rising if the index increases by a certain percentage point, and it is cooling off if the index decreases.

There are two types of inflation indices – The wholesale Price Index (WPI) and Consumer Price Index (CPI).

WPI, or the wholesale price index The wholesale price index, or WPI, tracks changes in wholesale prices. It tracks pricing fluctuations when commodities are exchanged between businesses rather than with actual clients. WPI is a straightforward and useful method of calculating inflation. However, it may not accurately reflect consumer inflation if institutional inflation is recorded here.

As I write this, the WPI inflation for May 2014 stands at 6.01%.

Consumer Price Index (CPI)– The CPI, on the other hand, captures the effect of the change in prices at a retail level. As a consumer, CPI inflation is what really matters. The calculation of CPI is quite detailed as it involves classifying consumption into various categories and subcategories across urban and rural regions. Each of these subcategories has its own index. This means the final CPI index is a composition of several internal indices.

The computation of CPI is quite rigorous and detailed. It is one of the most critical metrics for studying the economy.  A national statistical agency called the Ministry of Statistics and Programme Implementation (MOSPI) publishes the CPI numbers around the 2nd week of every month.

9.4 - Index of Industrial Production (IIP)

A short-term gauge of how the nation’s industrial sector is doing is the Index of Industrial Production (IIP). The Ministry of Statistics and Programme Implementation releases the information each month, along with data on inflation (MOSPI). The IIP, as its name suggests, measures production across all industrial sectors in India while maintaining a constant benchmark. India currently uses the reference period of 2004–2005. The base year is another name for the reference point.

The ministry receives production data from about 15 different industries, compiles it, and then publishes it as an index number. If the IIP is rising, this is a good sign for the economy and markets because it denotes a dynamic industrial environment (as production is rising).

To sum up, an upswing in industrial production is good for the economy, and a downswing rings an alarm. As India is getting more industrialized, the relative importance of the Index of Industrial Production is increasing.

The RBI is under pressure to lower interest rates if the IIP number drops. The following graph displays the percentage change in IIP over the previous year.

9.5-Purchasing Managers Index (PMI)

The purchasing managers’ index (PMI) is a measure of business activity used to assess the health of the nation’s manufacturing and service industries. This indicator is based on a poll, and the respondents, who are frequently buying managers, offer input on how their opinions of the company have evolved over the past month. Manufacturing and services each receive their survey. Using the survey’s data, a single index is produced. New orders, output, business expectations, and employment are typical survey topics.


An economic indicator called the purchasing managers’ index (PMI) aims to gauge business activity in both the country’s manufacturing and service sectors. This survey-based indicator captures how respondents—typically purchasing managers—perceived their company’s performance over the previous month. Each of the service and manufacturing industries are surveyed separately. The survey’s statistics are all compiled on one index. The survey frequently covers topics like new orders, output, business expectations, and employment.


Typically, the PMI value ranges from 50 to 60. Readings above 50 imply an economic expansion, while readings below 50 suggest a downturn. A result of 50 also indicates no change in the economy.

9.6 – Budget

The Ministry of Finance discusses the finances of the nation in depth during a budget. The Finance Minister delivers the budget on behalf of the ministry to the entire nation. The budget contains significant economic and policy announcements that have an impact on a range of market sectors and industries. Consequently, the budget is essential to the economy.

To further demonstrate this, consider that raising the taxes on cigarettes was one of the budget’s July 2014 expectations. . The Finance Minister increased the taxes on cigarettes during the budget, as was to be expected, which increased the price of cigarettes. A higher cigarette price has the following effects:

It goes without saying that this is debatable, but higher cigarette prices deter smokers from purchasing cigarettes, which lowers the profitability of cigarette manufacturing companies like ITC. Investors may want to sell shares of ITC if profitability declines.

Because ITC is an index heavyweight, the markets will decline if traders start selling ITC.

ITC traded 3.5 percent lower after the budget announcement for this specific reason.

 The budget is released every year during the last week of February. However, under some rare circumstances, such as the election of a new administration, the budget presentation may be postponed.

The Futures Pricing

Forward Market

• Forwards market
• Futures contract
• Future trades
• Leverage & payoff
• Margin & M2M
• Margin calculator
• Open interest

• How to short
• Nifty futures
• Nifty futures
• Futures pricing
• Hedging with futures
• Notes

learning sharks stock market institute

10.1 – The Pricing Formula

If you were to enroll in a traditional futures trading course, you would presumably learn about the futures pricing formula pretty early on in the program. However, we purposefully chose to discuss it now, at a much later time. The explanation is straightforward: you don’t really need to understand how futures are  if you’re trading them based on technical analysis, which I presume the vast majority of you are. However, having a solid understanding would be beneficial. However, you must be aware of this if you intend to trade futures using quantitative strategies like Calendar Spreads or Index Arbitrage. In reality, we will cover some of these methods in a module on “Trading Strategies,” thus the discussion in this chapter will serve as a basis for the ensuing modules.

If you recall, we occasionally covered the “Futures Pricing Formula” in some of the earlier chapters as the main cause of the discrepancy between the spot price and the futures price. I suppose it’s time to pull the curtain and disclose the “Future Pricing Formula” at this point.

We are aware that the respective underlying determines the value of the futures instrument. We are also aware of the future instrument’s synchronic movement with its underlying. The futures price would decrease if the actual price did, and vice versa.

However, the fundamental price and the futures price are not truly the same and different. As I write this, the Nifty Spot is trading at 8,845.5, while the comparable current month contract is trading at 8,854.7. For context, please see the snapshot below. “Basis or spread” refers to the price differential between the futures price and the actual price. The spread is 9.2 points (8854.7 – 8845.5) in the case of the Nifty sample below.

The “Spot – Future Parity” is responsible for the price discrepancy. The discrepancy between the spot and futures prices that results from factors like interest rates, dividends, a time before expiration, etc. is  as the spot future parity. In a very broad sense, it is just a formula that compares the underlying price to the matching futures price. The formula for futures pricing is another name for this.

The futures pricing formula reads as follows:

Futures Price is equal to Spot Price *(1+ RF)-D.

Where,

The risk-free rate is rf.

d: Dividend

It should be  that “rf” stands for the risk-free rate that you can earn for the entire year (365 days); given that the expiration is at 1, 2, and 3 months, you might want to scale it proportionately for time periods other than the precise 365 days.

Consequently, the following formula is more general:

Futures Price is equal to Spot Price plus [1 + rf*(x/365)].

– d

Where,

x is the number of remaining days.

The 91-day Treasury note issued by the RBI serves as a stand-in for the short-term risk-free rate.

The current rate is 8.3528 percent, as seen in the graphic above. In light of this, let’s work on a pricing example. What price should the current month futures contract for Infosys be set at if Infosys spot is now trading at 2,280.5 with 7 days left till expiration?

Futures Price: [1+8.3528 percent (7/365)] = 2280.5 – 0

Please take note that Infosys is not to pay a dividend over the following seven days, therefore I’ve assumed there would be none. The answer to the preceding equation is 2283, which is the predicted price. This is  to as the future’s “Fair value.” However, as you can see from the figure below, the actual futures price is 2284. The “Market Price” refers to the actual price at which the futures contract trades.

The difference between the fair value and market price mainly occurs due to market costs such as transaction charges, taxes, margins, etc. However by and large the fair value reflects where the futures should be trading at a given risk-free rate and the number of days to expiry. Let us take this further, and figure out the futures price for mid-month and far-month contracts.

Mid-month calculation

Number of days to expiry = 34 (as the contract expires on 26th March 2015)

Futures Price = 2280.5 * [1+8.3528 %( 34/365)] – 0

= 2299

Far month calculation

Number of days to expiry = 80 (as the contract expires on 30th April 2015)

Futures Price = 2280.5 * [1+8.3528 %( 80/365)] – 0

= 2322

From the NSE website let us take a look at the actual market prices –

It is obvious that the determined fair value and the market price are different. This is what I would put down to the relevant expenses. Additionally, the market might be accounting for some dividends paid at the conclusion of the fiscal year. The important thing to remember is that the gap between fair value and market value expands as the number of days till expiration increases.

In reality, this introduces us to the discount and the premium, two crucial terms utilized in the market.

The futures market is  to be at a “premium” if the futures are trading higher than the spot, which, mathematically speaking, is the natural order of events.

Although the term “Premium” is  in the equity derivatives markets, the term “Contango” is preferred in the commodity derivatives markets. The fact that the Futures are trading higher than the Spot, however, is what both contango and premium allude to.

Here is a graphic of the January 2015 series’ Nifty spot and associated futures. As you can see, throughout the entire run, the Nifty futures traded above the spot price.

I wish to focus your attention, in particular, on the following few points:

  1. The difference between the spot and futures is relatively large at the beginning of the series (shown by a black arrow). This is due to the large x/365 component in the futures price methodology and the high number of days till expiration.
  2. Throughout the series, the futures maintained a premium over the spot price.
  3. The futures and the spot have come together at the end of the series (shown by a blue arrow). In actuality, this constantly occurs. On the day of expiration, the futures and spot prices will always converge, regardless of whether the future is at a premium or a discount.
  4. If you have a futures position and don’t close it out by expiration, the exchange will do it for you and settle it at the spot price since both futures and spot prices converge on the day of expiration.

Futures trading is not necessarily more profitable than spot trading. There may be times when the futures trade at a lower price than the corresponding spot, primarily due to short-term imbalances in supply and demand. In this scenario, it is  that the futures are trading at a discount to the spot. A similar circumstance is as “backwardation” in the realm of commodities.

10.2 – Practical Application

Let’s put the formula for futures pricing to work before we wrap up this chapter. As I had previously indicated, the futures pricing formula is highly helpful if you want to trade using quantitative trading strategies. Please be aware that the conversation that follows is just a sneak peek into the realm of trading methods. When we start the module on “Trading Strategies,” we will go into deeper detail about all of these topics and more. Think about this scenario:

650 Wipro Spot

8.35 percent Rf

x = 30

d = 0

As a result, the futures ought to be trading at –

Futures Price is equal to 653*(1+8.35% (30/365)) – 0

= 658

In order to account for market fees, the futures should trade at or near 658. What if the price of the futures contract is dramatically different instead? How about 700? There is definitely a trade going on. In an ideal world, there should only be a 5-point gap between spot and futures, but due to market imbalances, that disparity has increased to 47 points. We can use trade to deploy and capture this spread.

The futures market price is  as being expensive in relation to its fair value since the futures contract is trading over its fair value. Alternately, we may state that the spot is trading less expensively than the futures.

The general rule for any kind of “spread trade” is to purchase the less expensive asset and sell the more costly one. As a result, using this as our guide, we can sell Wipro Futures on the one hand while concurrently buying Wipro on the spot market. Let’s enter the numbers and see what happens.

Purchase Wipro on-site for $653

Offer to sell Wipro futures at 700

Now we are aware that the spot and futures prices converge into a single price on the expiry day (refer to the Nifty graph posted above). Let’s assume a few arbitrary values where the spot and futures converge: 675, 645, 715

As you can see, after you execute the deal at the anticipated price, the spread is basically locked in. Profits are thus assured, regardless of where the market moves by expiry! It goes without saying that it makes sense to close out the bets right before the futures contract expiration. You would have to sell Wipro on the spot market and then purchase it back on the futures market to do this.

The term “Cash & Carry Arbitrage” also refers to this type of trade between futures and spots in which the goal is to extract and profit from the spread.

Spreadsheet Calendars 10.3

The calendar spread is a straightforward development of cash and carries arbitrage. The goal of a calendar spread is to extract and benefit from the spread that results from two futures contracts with the same underlying asset but different expiration dates. Continue using the Wipro example to better grasp this –

Wipro Spot currently trades at = 653.

30 days until expiration, current month futures fair value = 658

Futures for the current month are actually worth 700.

The fair value for mid-month futures (65 days to expiration) is 663

Mid-month futures actually have a market value of 665.

The current month’s futures contract is trading much over its anticipated theoretical fair value, as seen by the example above. The mid-month contract, however, is trading rather close to its real fair value estimate.

Based on these facts, I’ll assume that the basis for the current month’s contract will eventually contract and that the mid-month contract will continue to trade fairly.

The current month contract now seems to be more expensive than the mid-month contract. So, instead of buying the pricey contract, we sell the expensive one. I would therefore need to buy the mid-month futures contract at 665 and sell the current-month contract at 700 in order to execute the deal.

What do you believe the spread is in this case? The spread, or 700 – 665 points, is the difference between the two futures contracts.

The trade is set up as follows to catch the spread:

Sell the futures for the current month at 700

Keep in mind that because this is a hedged trade, the margins are significantly decreased because you are buying and selling the same underlying futures with different expires.

One must now wait for the current month’s futures to expire after starting the trade. We are confident that the spot price and the current month’s futures will converge at expiration. Of course, from a more pragmatic standpoint, it makes sense to close off the deal right before expiration.

Naturally, keep in mind that the crucial presumption we have made in this case is that the mid-month contract would remain relatively close to its fair value. According to my trading expertise, this occurs frequently.

Most importantly, keep in mind that this chapter’s study of spreads is really a brief introduction to the realm of trading methods. These methods will be  in a separate session that will provide you with a detailed examination of how to use them in a professional setting.

CONCLUSION

  1. The formula for calculating futures prices is Futures Price = Spot price *(1+Rf (x/365)) – d.
  2. The basis, also referred to as the spread, is the distinction between futures and spots.
  3. The term “Theoretical fair value” refers to the futures price as determined by the pricing algorithm.
  4. The term “market value” refers to the price at which futures trade on the market.
  5. Theoretically, the market value and the fair value of futures should be about equal. However, there can be a small variation, primarily because of the accompanying expenditures.
  6. Futures are to be at a premium if they are wealthy to spot, otherwise, they are said to be at a discount.
  7. Using commodities lingo Discount = Backwardation and Premium = Contango.
  8. One can buy in the spot market and sell in the futures using the spread as “cash and carry.”

  9. When one buys one contract and simultaneously sells another contract (with a different expiry but the same underlying), this is as a calendar spread.

Corporate actions

Corporate actions

Basics of stock market

• Why invest?
• who regulates
• financial interdependence
• IPOs
• Stock Market returns
• Trading system

• Day end settlements
• Corporate actions
• News and Events
• Getting started
• Rights, ofs,fpo and more
• Notes


learning sharks stock market institute

8.1 Overview of Corporate Actions

Corporate actions are projects undertaken by a corporate body that alter its stock. An entity has a wide range of corporate action options at their disposal. When deciding whether to buy or sell a particular stock, a thorough understanding of these corporate actions provides a clear picture of the company’s financial health.


The five most significant corporate actions and their effects on stock prices will be examined in this chapter.The board of directors proposes a corporate action,which the company’s shareholders then approve.

learning sharks stock market institute

8.2 Dividends

The business distributes dividends to its stockholders. In order to share out the company’s annual profits, dividends are paid. On a per-share basis, dividends are paid. For instance, Infosys declared a dividend of Rs. 42 per share for the fiscal year 2012–2013. A percentage of the face value is another way to describe the dividend payment. In the aforementioned instance, Infosys’ face value was Rs. 5 and the dividend was Rs. 42; as a result, the dividend payout is stated to be 840 percent (42/5).


Dividend payments are not required to be made each year. The business has the option to use the same cash to fund a new project for a better future if it decides that doing so would be preferable to paying dividends to shareholders.

Furthermore, dividends don’t have to be paid entirely from profits. The company can still pay dividends from its cash reserves if it had a loss for the year but did have a healthy cash reserve.


Occasionally, paying out dividends might be the best course of action for the business. It would make sense for the company to reward its shareholders in order to repay the faith the shareholders have in the company when the company’s growth opportunities have been exhausted and the company has extra cash.


The Annual General Meeting (AGM), where the company’s directors gather, is where the dividend payment decision is made. Dividends are not paid immediately following the announcement. This is because it would be challenging to determine who receives the dividend and who does not because the shares are traded throughout the year. You can better understand the dividend cycle by looking at the timeline below.


Dividend Declaration Date: This is the date on which the AGM takes place, and the company’s board approves the dividend issue


Ex-Date/Ex-Dividend Date: Two business days prior to the record date is typically the ex-dividend date. The dividend is only payable to shareholders who owned the shares prior to the ex-dividend date. This is so because the standard settlement in India operates on a T+2 basis. Therefore, in all actuality, you must ensure that you purchase the shares prior to the ex-dividend date in order to be eligible to receive a dividend.


Cum Dividend: Up until the ex-dividend date, the shares are referred to as cum dividend.

The stock typically declines to the extent of dividends paid when it goes ex-dividend. For instance, if ITC (currently trading at Rs. 335) announced a dividend of Rs. The stock price will decrease to the extent of the dividend paid on the ex-date; in this instance, ITC’s price will fall to Rs. 330. The amount paid out no longer belongs to the company, which is the cause of the price decrease.


Anytime during the fiscal year, dividend payments may be made. It is known as the interim dividend if it is paid during the fiscal year. The final dividend is the term used when a dividend is paid at the end of the fiscal year.

8.3 Bonus Issue

A stock dividend distributed by a company to its shareholders is known as a bonus issue. The company’s reserves are used to issue the bonus shares. These are free shares that shareholders receive in exchange for the shares they already own. These allocations frequently come in predetermined ratios like 1:1, 2:1, 3:1, etc.


If the ratio is 2:1 ratio, the existing shareholders get 2 additional shares for every 1 share they hold at no additional cost. So if a shareholder owns 100 shares, he will be issued an additional 200 shares, so his total holding will become 300 shares. When the bonus shares are issued, the number of shares the shareholder holds will increase, but an investment’s overall value will remain the same.


When a company’s share price is very high and it becomes difficult for new investors to purchase shares, companies issue bonus shares to encourage retail participation. The example above demonstrates how issuing bonus shares increases the number of outstanding shares while decreasing the value of each share. The face value stays the same.

8.4 Stock Split

The term “stock split” may sound strange to some people at first, but it occurs frequently in the markets. The obvious conclusion from this is that the stocks you currently own have been split.


When the company declares a stock split, the number of shares held increases, but the investment value/market capitalization remains similar to the bonus issue. The stock is split concerning the face value. Suppose the stock’s face value is Rs.10, and there is a 1:2 stock split then the face value will change to Rs.5. If you owned 1 share before the split, you would now own 2 shares after the split.

8.5 Rights Issue

The idea behind a rights issue is to raise fresh capital. However, instead of going public, the company approaches its existing shareholders Think about the rights issue as a second IPO and a select group of people (existing shareholders). The rights issue could be an indication of promising new development in the company. The shareholders can subscribe to the rights issue in the proportion of their shareholding. For example, 1:4 rights issue means every 4 shares a shareholder owns; he can subscribe to 1 additional share. Needless to say, the new shares under the rights issue will be issued at a lower price than what prevails in the markets.


A word of warning, though: The investor should look beyond the company’s discount and not let it influence them. In contrast to a bonus issue, one must pay money to purchase shares in a rights issue. Therefore, a shareholder should only invest if they have complete faith in the company’s future. It is obviously less expensive to purchase it from the open market if the market price is lower than the subscription price or right issue price.

8.6 Buyback of shares

A buyback can be viewed as a way for a company to invest in itself by purchasing shares from other market participants. Although buybacks reduce the number of shares outstanding in the market, they are a crucial corporate restructuring strategy. There may be a variety of factors at play when corporations decide to buy back shares.


  1. Increase the per-share profitability.
  2. to increase their ownership of the business.
  3. to prevent competition from other businesses.
    to demonstrate the promoters’ faith in their business.
  4. to prevent competition from other businesses.
    to demonstrate the promoters’ faith in their business.

When a company makes an announcement about a buyback, it expresses confidence in the company. Thus, this typically has a positive impact on the share price.

The Nifty Futures

learning sharks stock market institute

Forward Market

• Forwards market
• Futures contract
• Future trades
• Leverage & payoff
• Margin & M2M
• Margin calculator
• Open interest

• How to short
• Nifty futures
• Nifty futures
• Futures pricing
• Hedging with futures
• Notes

9.1 – Basics of the Index Futures

The Nifty Futures holds a very particular place in the world of Indian derivatives. The most liquid contract in the Indian derivative markets is the “Nifty Futures,” which is the most commonly traded futures product. Nifty Futures is really among the top 10 index futures contracts traded globally, which may surprise you. Like many of us, I would anticipate that once you become familiar with futures trading, you will start actively trading the Nifty Futures. It would make sense to fully comprehend Nifty futures in light of this. However, before we continue, I would like you to review the Index as we have already talked about it here.

I’m going to talk about the Index Futures or the Nifty Futures now that I’m assuming you are familiar with the index’s fundamentals.

The futures instrument, as we are aware, is a derivative contract whose value is derived from an underlying asset. The Index itself serves as the underlying for Nifty futures contracts. The Nifty Index is where the Nifty Futures derive their value from. This implies that as the Nifty Index’s value increases, so will the value of Nifty futures. The Index futures would also decrease in value if the Nifty Index’s value dropped.

Nifty Futures are  in three variations: current month, mid-month, and far month, much like any other futures product. For your reference, I have highlighted the same phrase in red. Additionally, I have highlighted the Nifty Futures price, which was Rs. 11,484.9 per unit of Nifty at the moment I took this picture. 11,470.70 rupees were the corresponding underlying value (index value in the spot). The futures pricing formula is the reason why there is, of course, a discrepancy between the spot price and the futures price. In the following chapter, we shall comprehend the ideas pertaining to futures pricing.

The lot size is 75 if you’ve noticed. The contract’s value is  to be –

CV is Futures Price times Lot Size

= 11484.90 * 75

= Rs.861,367/-

These facts ought to provide you with a fundamental overview of the Nifty Futures. Its liquidity is one of the primary characteristics of Nifty Futures that contributes to its popularity. Now that we have a better understanding of what liquidity is and how to quantify it, let’s move on.

9.2 – Impact Cost

24th August 2021 update – The fee that a buyer or a seller must suffer while completing a transaction in certain security is  as Impact Cost by the NSE. In comparison to the bid-ask spread, it gives a far more realistic picture of the costs traders incurs while executing a trade. It is a measure of market liquidity. It fluctuates depending on the magnitude of the transaction and is  separately for the buy-side and the sell-side. Due to its dynamic nature, the Impact cost is always shifting in response to the order book. One of the requirements for eligibility for companies to be  in indexes (such as Nifty 50, and Nifty 500) is that the impact cost must be below a specific threshold.

The effect cost is  using the following formula:

(Best Buy Price in Orderbook + Best Sell Price in Orderbook) / 2 is the ideal price.

Actual Buy Price = Total Quantity – (Quantity * Execution Price)

Impact Cost (for that specific quantity) is  as follows: Ideal Price * 100 / (Actual Buy Price – Ideal Price).

Let’s say someone wishes to purchase 350 units of Infosys. Let’s now determine the transaction’s impact cost.

Ideal Price =(1657.95+1658)/2 = 1657.975 ~ 1657.98

Actual Buy Price is  as follows: (15*1658) + (335*1658.20) / 350 = 1658.19143 1658.19

((1658.19 – 1657.98) / 1657.98) * 100 = 0.012 percent) is the impact cost for purchasing 350 shares.

The following are a few essential lessons I want you to learn from our discussion:

  1. Giving a perception of liquidity through impact cost
  2. Impact cost decreases when a stock’s liquidity increases.
  3. Another sign of liquidity is the difference in the price at which something is bought and sold.

1. The impact cost is larger the wider it is.

2. The effect cost is smaller the narrower it is

4. Liquidity increases and reduces volatility.

5. Placing market orders is not a good idea if the stock is not liquid.

9.3 – Why trading Nifty makes sense

The Nifty Index, as you are aware, consists of 50 stocks. These stocks were  to cover a broad spectrum of India’s economic sectors. Because of this, the Nifty is a good indicator of India’s overall economic activity. This naturally suggests that if overall economic activity is increasing or is anticipated to increase, the Nifty’s value will increase as well, and vice versa. Additionally, compared to trading single stock futures, trading Nifty Futures is a far superior option. There are numerous causes for this; here are a few:

It is  – From a risk perspective, it can occasionally be difficult to make a direct call on a single stock. Let’s imagine, for illustration purposes, that I decide to purchase Infosys Limited in the anticipation of positive quarterly results. In the event that the results don’t satisfy the markets, my P&L and the stock would undoubtedly suffer. On the other hand, Nifty Futures features a diverse portfolio of 50 stocks. The movement of the Index does not truly depend on a single stock because it is a portfolio of stocks. Of course, occasionally a few stocks (index heavyweights) can somewhat affect the Nifty, but not regularly.

In other words, when trading Nifty futures, “unsystematic risk” is entirely eliminated, and only “systematic risk” is dealt with. I am aware that we are introducing a new language here, however, we will go into more detail about these concepts when we discuss hedging.

Nifty’s movement is a reaction to the overall movement in India’s top 50 companies, making it difficult to manipulate (by market capitalization). As a result, there is almost no room for manipulating the Nifty index. The same cannot be  about certain stocks though (remember Satyam, DHCL, Bhushan Steel, etc)

High Liquidity (Easy Fills, Less Slippage): Earlier in the chapter, we covered liquidity. You can basically transact any amount of Nifty because it is so highly liquid, and you won’t have to worry about losing money on the impact fee. Plus, there is so much liquidity available that you may essentially transact any quantity of contracts.

Margin requirements are significantly lower for Nifty futures compared to individual stock futures. Nifty’s margin requirements range from 12 to 15 percent, while individual stock margins can be as high as 45 to 60 percent.

Taking a broader economic prediction is necessary when trading Nifty futures as opposed to making company-specific directional calls. I’ve found that the former is considerably simpler to do than the latter.

Application of technical analysis – On liquid instruments, technical analysis is most effective. Since liquid equities are difficult to manipulate, their movements are typically determined by the market’s dynamics of supply and demand, which is obviously what a TA mostly depends on.

Less volatile – When compared to individual stock futures, Nifty futures are less volatile. To put things in perspective, the annualized volatility of the Nifty futures is about 16–17%, whereas that of individual stocks, like Infosys, can reach 30%.

CONCLUSION

  1. The Nifty Index in spot, which serves as its underlying, determines the value of Nifty Futures.
  2. The Nifty futures lot size is 75 at the moment.
  3. The most liquid futures contract in India is the Nifty futures contract.
  4. Nifty Futures contracts are available with three different expiration options, just like other futures contracts (Current month, Mid Month, and Far Month)
  5. An arbitrarily quick instantaneous deal known as a “round trip” entails buying at the best sell price and selling at the best buy price.
  6. A round-trip trade is always unsuccessful.
  7. Impact cost calculates a round-trip loss as a percentage of the average bid and ask.
  8. Fewer liquidity results from higher impact costs, and vice versa.
  9. Due to impact cost, when you place a market order to transact, you could lose some money.

  10. The most liquid contract to trade is Nifty, which has an effective cost of about 0.0082 percent.

All about Shorting

learning sharks stock market institute

Forward Market

• Forwards market
• Futures contract
• Future trades
• Leverage & payoff
• Margin & M2M
• Margin calculator
• Open interest

• How to short
• Nifty futures
• Nifty futures
• Futures pricing
• Hedging with futures
• Notes

8.1 – Shorting in a nutshell

Shorting was briefly covered in Module 1. However, we shall examine shorting in more detail in this chapter. Because we don’t typically short things in our day-to-day transactions, shorting is a difficult idea to understand. Imagine this transaction, for instance:

Let’s imagine you purchased an apartment today for Rs. X and sell it for Rs. X+Y two years later. The added value above and above Rs. X, which just so happens to be Rs. Y is the transaction’s profit. This transaction is straightforward to understand and uncomplicated. In fact, the majority of daily transactions call for us to first buy something before later selling it (maybe for a profit or a loss). We are  to these straightforward transactions. However, when doing a short sale or simply “shorting,” we carry out the transactions in reverse, i.e., sell first and buy later.

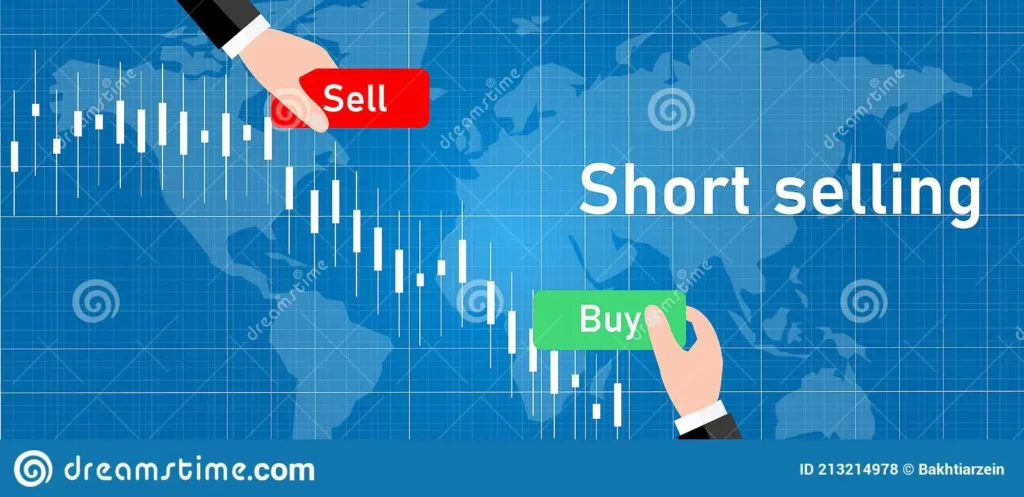
So what would force a trader to first sell something before later buying it? Well, it’s actually fairly straightforward: When we anticipate that the price of an item, like a stock, would rise, we buy the stock first and sell it later. However, we typically sell the stock first and then buy it later if we think its price will decrease.

Confused? In order for you to grasp the basic idea at this point, let me try to give you a crude comparison. Consider that you and your friend are watching a thrilling India-Pakistan cricket match. You two are in the mood for a quick wager. Your friend bets that India will lose the game, while you wager that India will win. Naturally, this implies that you profit if India triumphs. Likewise, if India lost the game, your friend would profit.

For the time being, imagine India (in this context, the Indian cricket team) as a company that trades on the stock exchange. When you do this, your wager is the same as saying that you will profit if the stock increases (India wins the game) and your friend will profit if the stock decreases (India loses the match). According to market jargon, you are long India while your friend is short the country.

Still, perplexed? Perhaps not, but there are probably a few unsolved questions niggling at the back of your mind. Just keep in mind this one thing for the time being if you are brand new to shorting stocks: whenever you believe a stock’s price is about to decrease, By selling the stock short, you can profit. You must sell your stock or futures initially and then purchase them back later to short them. In actuality, the P&L of actually shorting a stock or pair of futures is the best method to understand how to short. However, I’ll try to cover everything you should know in this chapter before you short stocks or futures.

8.2 – Shorting stocks in the spot market

Prior to learning how to short a stock in the futures market, it is important to comprehend how shorting operates in the spot market. Consider the following fictitious circumstance:

  1. A trader notices the formation of a bearish Marubuzo on HCL Technologies Limited’s daily chart.
  2. Other checkpoints on the checklist (covered in the TA module) comply in addition to the bearish Marubuzo.

1. higher than normal volume

2. the resistance level is present

3. Manifestations support

4. The risk-to-reward ratio is acceptable.

3. The trader believes HCL Technologies will decrease by at least 2.0% the following day as a result of the analysis.

The trader now hopes to profit from the  price fall in light of this view. He decides to short the stock as a result.

As is common knowledge, when one shorts a stock or stock futures, they anticipate that the stock price will decline and that they would be able to profit from the decline in value. The goal is to short the stock at Rs. 1990 based on the table above.

You only need to highlight the stock (or a futures contract) you want to short on your trading platform and press F2 when you have to short it. By doing this, the sell order form is . Before clicking submit, input the amount and other information. As soon as you click “Submit,” the order is sent to the exchange, and if it is filled, you will have opened a short position for yourself.

Anyway, consider this: Under what conditions would you incur a loss if you had a trading position? Naturally, you would lose money if the stock price moved in the opposite direction of what you had . So,

1. What way should a stock move in if you short it?

  1. The directional view is downward since it is that the stock price will decrease.

2. So when would you begin to lose money?

  1. when the stock moves counter to expectations

3. What would that be, then?

  1. This indicates that if the stock price begins to rise rather than decline, you will begin to lose money.

The stop loss price is always greater than the price at which you have shorted the stock whenever you have a short position. So, as you can see from the table above, the short trade entry price is Rs.1990, and the stop loss price is Rs.2000, which is Rs.10 more than the entrance price.

After starting the short trade at Rs.1990/-, let’s now speculatively consider two possible outcomes.

Situation 1: The stock price reaches the desired level of Rs.1950.

In this instance, the stock movement matched expectations. The stock price decreased from Rs. 1990 to Rs. 1950. The trader is  to close the position since the aim has been met. As is well known, in a short position, the trader must:

  1. initial sale at Rs. 1990, and
  2. Later purchase at Rs.1950

The merchant would have earned a profit throughout the entire procedure equivalent to the difference between the selling and buying prices, or Rs. 40/- (1990 – 1950).

If you approach it from a different perspective, such as the typical purchase first and sell later perspective, this is just as advantageous as purchasing at Rs. 1950 and selling at Rs. Just that the trader’s order of transactions has been flipped, with sales coming first and purchases coming last.

Scenario 2: The stock price rises to 2000 rupees.

In this instance, the stock price has risen over the Rs. 1990/- short price. Keep in mind that if you short a stock, the price must fall for you to profit. A loss would result if the stock price increased in place of falling. In this instance, the stock has increased, hence there will be a loss.

  1. The trader made a short sale for Rs.1990. The stock increased after being shorted, contrary to the trader’s anticipation.
  2. When the stock reaches Rs. 2000, the stop loss is triggered. The trader must finish the position by repurchasing the stock in order to stop further losses.

The trader would have lost Rs. 10 over the entire procedure (2000 – 1990). This transaction is equivalent to buying at Rs. 2000 and selling at Rs. 1990, if you approach it from the traditional buy first, sell later perspective. Likewise, if we reverse the sequence, it would be sold first and purchased later.

Hopefully, the two examples above have convinced you that when you short something, you profit when the price declines and lose money when the price rises.

8.3 – Shorting in spot (The stock exchange’s perspective)

One restriction applies to shorting in the spot market: it must be  exclusively intraday. The short transaction can be  at any moment during the day, but you must purchase back the shares (square off) before the market closes. The short position cannot be  over for a number of days. We must comprehend how the exchange handles the short position in order to comprehend why shorting in the spot market is purely an intraday activity.

Recall the discussion from above occasionally. Let’s imagine for a moment that you have shorted stock with the anticipation of profiting from the price decrease. You decide to wait another day because the price has not dropped as much as you had hoped after you shorted it. However, the exchange would determine at the end of the day that you had sold shares during the day, so you would need to retain these shares available for delivery.

However, you cannot fulfill your delivery commitment with these shares. This indicates that you will break your responsibility, which will result in a severe penalty. This circumstance is also known as “Short Delivery.”

In the event of short delivery, the exchange would raise the matter and resolve it in the auction market. You should read this Z-Connect article, which outlines the auction market procedures and how a client is penalized for failing to meet a delivery commitment. Here’s some advice: never engage in “short delivery” transactions, and always terminate your short trades before the market closes to avoid penalties that might be as much as 20% above your short price.

This also brings up a crucial point: the exchange already checks for commitments after the market ends. Therefore, if one were to cover the short position (by squaring off), there would be no obligation at all at the end of the day before the exchange can perform the “obligation check.” So, in order to avoid actually bringing forward the delivery obligation, shorting in the spot market must be  exclusively as an intraday trade.

Does that imply that all short positions must be settled by the end of the day? Actually, no. In the futures market, a short position can be maintained overnight.

8.4 – Shorting in the Futures Market

Shorting a stock in the futures segment has no restrictions like shorting the stock in the spot market. In fact this is one of the main reasons why trading in futures is so popular. Remember the ‘futures’ is a derivative instrument that just mimics the movement of its respective underlying. So if the underlying value is going down, so would the futures. This means if you are bearish about a stock then you can initiate a short position on its futures and hold on to the position overnight.


Similar to depositing a margin while initiating a long position, the short position also would require a margin deposit. The margins are similar for both the long and short positions and they do not really change.


Let’s use the following example to better illustrate the “Mark to Market” (M2M) perspective while shorting futures. Assume you sold a short position in HCL Technologies Limited at Rs. 1990. Lot dimensions are 125.


The two lines marked in red highlight the fact that they are loss-making days. To get the overall profitability of the trade we could just add up all the M2M values –


+ 1000 + 875 – 625 – 1125 + 2375 + 625

= Rs.3125/-


Alternatively, we could look at it as –


(Selling Price – Buying price) * Lot Size


= (1990 – 1965) * 125

= 25*125

=Rs.3125/-


Therefore, starting a long futures position and shorting futures are quite similar, with the exception that when you short, you only make money if the price drops. In addition, the M2M calculation and the margin need are unchanged.


Active trading involves a significant amount of shorting. You should become as confident starting a short trade as you would starting a long one, in my opinion.

CONCLUSION

  1. When shorting, we must sell first and then buy.
  2. Only when the closing price is lower than the entry price is a short trade profitable.
  3. A loss occurs when the price rises above the level at which one has shorted it.
  4. When trading short, the stop loss is always set higher than the price at which the trade was initiated.
  5. In the spot market, only intraday shorting is permitted.
  6. In the spot market, the short positions cannot be maintained overnight.
  7. The futures market allows for the overnight carrying forward of short positions.
  8. The margin requirement is the same for long and short trades.
  9. Both short and long trades use a similar M2M algorithm.

Day end settlements

Overview of day end settlement

Basics of stock market

• Why invest?
• who regulates
• financial interdependence
• IPOs
• Stock Market returns
• Trading system

Day end settlements
• Corporate actions
• News and Events
• Getting started
• Rights, ofs,fpo and more
• Notes


learning sharks stock market institute

7.1 Overview of day end settlements

Although clearing and settlement are very theoretical, it is crucial to comprehend the principles involved. Investors and traders don’t need to worry about how transactions are cleared and completed because skilled intermediaries will handle this responsibility expertly on your behalf.

But if the clearing and settling process is not understood, learning won’t seem to be complete. We will therefore examine what takes place in the background between the time you purchase a stock and the time it appears in your DEMAT account.

learning sharks stock market institute

7.2 What happens when you buy a stock?

Let’s say you purchase 100 shares of HDFC on Monday, June 23, 2014, for Rs. 1,000 each. The total cost of the purchase is Rs. 100,000 (100 x 1000). The trade date, abbreviated as “T Day,” is the day you complete the transaction.

Your broker will charge Rs. 100,000 plus any applicable fees toward your purchase by the end of the trading day. The fees listed below would be incurred if the deal went through Zerodha.

Sl NoChargeable ItemApplicable ChargesAmount
1BrokerageZero charges on Equity Delivery or 0.03% or Rs.20/- whichever is lower for intraday tradesZero
2Security Transaction Charges0.1% of the turnover100/-
3Transaction Charges0.00325% of the turnover3.25/-
4GST18% of Brokerage + Transaction charges0.585/-
5SEBI ChargesRs.10 per crore of transaction0.1/
Total103.93/-

As a result, on the day of the transaction, the full sum of Rs. will be debited from your trading account. 103.93 (which includes all applicable fees). Keep in mind that although money leaves your account, stocks have not yet arrived in your DEMAT account.

The broker also creates a “contract note” and sends you a copy of it on the same day generated bill that includes a list of all the purchases you’ve made is similar to a contract note. It is wise to keep this important document on hand for future use. A contract note typically includes the trade reference number and a breakdown of all transactions carried out during the day. It also outlines the breakdown of the broker’s fees.

Day 2 – Trade Day + 1 (T+ day, Tuesday)

The T+1 day is the day following the transaction that you made. You can sell the stock you bought the day before on day T+1. By doing this, you are essentially making a “Buy Today, Sell Tomorrow” (BTST) or “Acquire Today, Sell Tomorrow” trade (ATST). Keep in mind that the stock is not yet in your DEMAT account. There is therefore a risk, and you run the risk of getting into trouble for selling a stock that you don’t own. This doesn’t necessarily mean that you get into trouble every time you make a BTST trade, but it does occasionally, particularly when you trade B group and illiquid stocks. We purposely won’t discuss this subject at this time because of how complicated this situation is.

If you are a beginner in the markets, I advise against engaging in BTST trades unless you are aware of the risks.

From your perspective, nothing happens on T+1 day. However, in the background, the exchange, exchange transaction fees, and security transaction tax are collecting the money needed to buy the shares.

Day 3 – Trade Day + 2 (T+2 day, Wednesday)

On day 3, also known as the T+2 day, at approximately 11 AM, shares are debited from the person who sold you the shares and credited to the brokerage with whom you are trading. By the end of the day, the brokerage will then credit your DEMAT account. similar to how the person who sold the shares received credit for the money that was taken from you.

Now that you own 100 shares of Tata, the shares will start reflected in your DEMAT account.

In actuality, you should only plan on getting the share in your DEMAT account by the end of day T+2 if you buy a share on day T Day. Starting at T+3day, shares will go on sale.

7.3 What occurs when a stock is sold?

learning sharks stock market institute

The trading day, abbreviated as “T Day,” refers to the day you sell the stocks. When you sell shares using your DEMAT account, it becomes prohibited. The blocked shares are delivered to the exchange before T+2 day. After deducting any necessary fees, the sale’s proceeds would be deposited to your trading account on T+2 day.

Appreciation

Undoubtedly,  learning sharks institute works hard to maintain this list of share market Training courses up to date. However, In the event of a dispute between the programs mentioned in the Learning sharks Academic Calendar and this list, the Calendar will take precedence nevertheless. In addition,  Please contact the Enrollment Desk if you have any further questions about admissions or program offerings. Nevertheless, Please contact us at feedback@learninghsharks.in to edit a program listing. Alternatively, you can reach us directly for any course queries. On the contrary, one can call our number 8595071711.


Even so, we launch new stock market integrated trading programs every 6 months. Despite stock market trends and conditions. While we have you here. Of course, we do not want to miss asking you to share a review. It is necessary and appreciated. our Trading community has been growing evidently. Surely, the credit goes to our mentors and our hard-working trading students. For this reason, we keep coming out with discounts and concessions on our programs. Besides, We believe each citizen has the right to learn about the market.


Because we believe each student should be successful. Since our program is so powerful. So, we encourage and invite more applications, therefore. Of course, we feel proud to invite the differently abled students too. Moreover, the stock market does not care about any race, religion, family background, or religion also. Then, again, We are there to assist you with the best education. Finally, head over to our contact page to speak to our counselor. For one thing, we do not want our students to fail, which is why give regular and repeated classes too.

Go for it

Psychology and Risk Management

What to expect
Risks
• Position sizing
• illusion of control
• Accepting critisism
• Paralyzed by fear
• Loss is a feedback, not a failure
• The flexible trader
• Focusing on the positive
• Short straddle
• The dynamics of greed
• The herd mentality
• Notes

When your money is at stake, you are forced to take precautions. Avoid recklessly gambling with your money so that you end yourself in debt and have to work twice as hard to break even. However, you don’t want to become stationary. Carefree trading is a trait of successful traders. They don’t aim for an impossible standard of perfection. They act, deal with issues as they arise, and most importantly, they engage in transactions.

learning sharks stock market institute
source: Businessstandard

Pursuing perfectionism is rewarded in many professions. Studies of ambitious, successful individuals, for instance, have shown that they are persistent in working on a task until their comparatively high standards are reached, but they do not go overboard to the point of procrastination. When someone reaches a predetermined standard, they finish the task and move on. But many people are reluctant to risk failure and potential embarrassment because they don’t want to lose face.


Mark Douglas writes in his book “Trading in the zone” that inexperienced traders look for excuses not to place transactions. They might persuade themselves, for instance, that they need to learn new trade techniques. These justifications, however, are frequently evasions of accountability for carrying out a deal. Instead of making a trade and dealing with their limits, they would prefer to consider their options. However, traders must act immediately. Never attempt to overcome a challenge by backing down. Despite this, it’s only normal to want to double-check everything before making a trade. How many times have you ignored a potential negative event and then paid the price?


You’ve learnt the value of great caution the hard way. But in the end, you also realise that you need to act. You must take ownership of your actions and create a deal.

How can the pressure of taking chances be lessened? The first obvious option is to use risk management to reduce possible losses. You’ll really feel like you have little to lose if you keep the amount of risk to a modest portion of your account. Second, don’t give a trade more emotional weight than it deserves. It’s just your work; it’s not your baby. You’ll feel more at ease and be able to complete the trade more easily if you approach it objectively and professionally.


Third, you must be prepared to acknowledge the psychological reality that trading results are unpredictable.


Until you actually make a trade and see how it plays out, you can never tell for sure how it will end out.


While it may be challenging in the moment, facing the consequences is an important part of learning. Finding out just how difficult trading can be may be painful, but you’ll discover that in the long run, if you take personal risks, minimise the actual financial repercussions, and learn from your mistakes, you’ll become an expert in the markets. And the psychological suffering you had to go through in order to learn was well worth it. So don’t be reluctant to get in.

Goal Setting Enhances Motivation

Psychology and Risk Management

What to expect
Risks
• Position sizing
• illusion of control
• Accepting critisism
• Paralyzed by fear
• Loss is a feedback, not a failure
• The flexible trader
• Focusing on the positive
• Short straddle
• The dynamics of greed
• The herd mentality
• Notes

We typically determine our level of motivation by the goals we establish. Robert Koppel (2000) makes the following claim in his book, “The Mentally Tough Online Trader”: “Setting goals is vital for the trader to boost motivation and optimise performance. Goals should be realisable within a set time frame, practical, measurable, and under the person’s control. High-level goals are a sign of success, but if you set your sights too high, you’ll probably fail a lot of the time. Additionally, persistent failure can make you want to give up by harming your ego. Finding the sweet spot between being overly ambitious and being too modest when making objectives is the key.


It’s crucial for your emotional health to have reasonable expectations while making goals. For instance, many new traders fail when they attempt to transform a little investment into a large sum of money. Trading with insufficient funds won’t be able to pay for drawdowns, fees, or commissions. Also trading above their ability level are new traders. They could employ risky trading techniques and anticipate a reward even when changing market circumstances render their strategies ineffective. It’s challenging to accomplish irrational aims. It causes a lot of tension, and stress can lead to mistakes in trading. Setting more reasonable expectations reduces pressure and aids in the development of solid trading techniques. You experience a sense of satisfaction as you accomplish each goal.

learning sharks stock market institute
source: Free press journal

A common misconception among new traders is how long it takes to build a profitable business. For instance, many believe they can trade profitably in a matter of months, when experienced traders stress that such consistently lucrative trading may take several years. And achieving it is difficult. Yet many inexperienced traders believe that only a modest amount of work is required. For instance, individuals could believe that treating trading more like a pastime than a professional business will allow them to trade profitably. They overestimate how competent they are. They have an overly confident belief in their own abilities and skills, which they do not yet possess. Never underestimate a person’s propensity for arrogance.


It’s crucial to create explicit goals in addition to attainable ones. A common error is to set ill-defined, non-specific goals. Setting concrete objectives and rewarding yourself as you advance is beneficial. Profits do not have to be the primary focus of goals. You might wish to start by establishing objectives for skill improvement. You can choose to read one new trading book a week or spend three hours a day studying charts. Naturally, you’ll experience a sense of accomplishment as you accomplish each goal and mark your progress.


You can gradually set higher and higher goals as your skills advance. Though initially slow, you will eventually make great progress. Avoiding attempting to do too much is crucial. Move slowly. Work on your own schedule, and at your own pace. Not to be a competition. You are the only one you need to appease. You’ll master the markets and achieve long-term financial success if you create goals that are reasonable and work diligently to meet them.

Setting Goals for the New Year

Psychology and Risk Management

What to expect
Risks
• Position sizing
• illusion of control
• Accepting critisism
• Paralyzed by fear
• Loss is a feedback, not a failure
• The flexible trader
• Focusing on the positive
• Short straddle
• The dynamics of greed
• The herd mentality
• Notes

learning sharks stock market institute
Source: Dreamstime

It’s time to establish ambitious new objectives and create plans for the future now that the new year has arrived. Having goals might inspire you. The goals seem instantly attainable when we consider where we want to go in our lives and when we create precise targets. We begin to consider other options. The more we consider various options, the more plans we develop, and the more plausible the possibilities seem. We have a sudden surge of energy and feel like taking on the world. But it’s crucial to avoid overreacting. You must carefully define goals, whether they be for your personal life or new trading objectives.


The January Effect: What Is It?


The January Effect refers to a supposedly seasonal rise in stock values that occurs in January. Analysts frequently attribute this bounce to an uptick in buying after the price decline that typically occurs in December as a result of investors selling to realise tax losses to balance realised capital gains.


It’s easy to be overly optimistic at the beginning of the year. Why not aim for the moon? Even though having high expectations is essential for achieving ambitious goals, “reaching for the stars” typically results in unreasonable aims, which ultimately lead to failure. For instance, most New Year’s resolutions are broken by around 90% of people. The majority of these failures happen as a result of people’s overly optimistic goal-setting. They began to believe that, if one “dares to dream,” “everything is possible.” Even while the “everything is possible” mentality is motivating, it rarely comes to pass. You can’t just think yourself successful. Hard labour and preparation are required. And no amount of wishful thinking will enable one to accomplish the impossibility.


When setting a New Year’s resolution, the majority of individuals set improbable objectives. They have inflated expectations of their ability to shed weight. They frequently have a desire to fulfil personal tasks that are impossible given the resources at their disposal. And many inexperienced traders have unrealistic expectations for their financial success when it comes to trading.


Making your goals explicit while keeping them realistic is a good idea. Setting both types of goals and separating them from performance goals is beneficial. For instance, a new trader lacks the knowledge and resources necessary to engage in profitable trading over the long term. For instance, it can be challenging to set a target of producing a 40% profit in six months if you lack the necessary expertise. That is an illustration of a “performance target” that is too ambitious. Performance goals that are too ambitious frequently result in failure and utter disappointment.


When expectations are dashed, people tend to want to give up. Beginner traders should establish high learning goals rather than high performance goals. It is simpler to accomplish a learning objective, such as dedicating 20 hours per week to learning new methods and making 10 practise trades (profitable or not). One will probably succeed and accomplish their aim. One will feel accomplished, as if they have overcome the odds and prevailed, as opposed to feeling disappointed. One will feel inspired and prepared to continue on to accomplish even loftier objectives.


A terrific opportunity to make fresh, interesting resolutions is at the beginning of the new year. But take care. Decide on attainable objectives that you can reach. Many people have unrealistic expectations for the New Year, which leads to failure and utter despair. But if you make realistic goals, you’ll be more likely to succeed, feel energised, and reach your full potential.

Clear and Specific Goals

Psychology and Risk Management

What to expect
Risks
• Position sizing
• illusion of control
• Accepting critisism
• Paralyzed by fear
• Loss is a feedback, not a failure
• The flexible trader
• Focusing on the positive
• Short straddle
• The dynamics of greed
• The herd mentality
• Notes

Trading can occasionally be tedious. You have to continuously search for market chances, and once you do, you have to risk your money and a little bit of your ego, and you have to live with the results—good or bad. You’ll soon join the dejected minions who have left the trading profession if your heart isn’t in it. You must enjoy the trading process if you want to succeed as a trader over the long term. If that were the only method to trade, you must believe it’s so thrilling that you would do it for minimal wage. The prize is not the focus. It’s a calling and an honourable goal.


Who wouldn’t want to trade successfully? You could do anything you wanted if you had total financial independence. However, it’s important to translate the vague objective of being a successful trader into a precise, detailed strategy. Your trading goals should be exact, definite, and well-defined, according to Robert Koppel and Howard Abell, who make this argument in their book “The Inner Game of Trading.” You must also make an effort to finish your tasks in a reasonable amount of time. Your goals should be attainable and stated in a way that empowers you. Setting an objective that is simple to quantify is also crucial.

learning sharks stock market institute

Koppel and Abell claim that there are various ways to specify trade goals. First, you might establish performance goals that are centred on how well you are performing in comparison to your own standards. You aim to improve your physical and mental trade skills when working toward a performance goal. Second, you can specify outcome objectives. Outcome goals aid in identifying your priorities. You can use them to create trading methods and strategies that suit your personality. Third, setting a motivational goal encourages you to put more effort into developing your trading abilities. You can keep up a high level of enthusiasm and confidence by setting motivational goals.


For instance, it’s crucial to develop emotional self-control. Many traders make emotional decisions instead of logical ones. They also struggle with accepting defeat. It’s important to get past setbacks without fuss rather than let them bother you. It’s crucial to create a trading strategy that complements your personality. All traders ought to keep their risk under control. These are but a few examples, but with each of them, it’s imperative to work diligently toward achieving specified objectives each day. You might simply try to set a performance objective on some days. You could put a trading technique you’re seeking to perfect into practise using a bar you personally deem suitable. On other days, you can aim to accomplish a certain goal and gauge your success.


Many traders commit the error of trading aimlessly every day without attempting to accomplish any particular objectives. It’s like trying to saw down a tree without ensuring sure your blade is sharp enough to cut wood, as Koppel and Abell put it. Goals orient and inspire. You are embarking on a journey without a map if your aims aren’t clear and explicit.