Learning sharks-Share Market Institute


Rajouri Garden  8595071711 7982037049  Noida 8920210950 , and  Paschim Vihar  7827445731  

Fee revision notice effective 1st April 2025; No change for students enrolled before 15th May 2025

Download “Key features of Budget 2024-2025here

TOP 3 STOCK MARKET chart pattern- टॉप 3 स्टॉक मार्केट चार्ट पैटर्न l In hindi

टॉप 3 स्टॉक मार्केट चार्ट पैटर्न in hindi 2023 stock market chart patterns

स्टॉक मार्केट चार्ट पैटर्न क्या हैं?

स्टॉक चार्ट पैटर्न एक महत्वपूर्ण ट्रेडिंग टूल है जिसका उपयोग आपकी तकनीकी विश्लेषण रणनीति के हिस्से के रूप में किया जाना चाहिए। नौसिखियों से लेकर पेशेवरों तक, बाजार के रुझान की तलाश करते समय और आंदोलनों की भविष्यवाणी करते समय चार्ट पैटर्न एक अभिन्न भूमिका निभाते हैं। उनका उपयोग विदेशी मुद्रा, शेयर, वस्तुओं और अधिक सहित सभी बाजारों का विश्लेषण करने के लिए किया जा सकता है।


वित्तीय बाजारों में व्यापार करने के लिए तकनीकी विश्लेषण का उपयोग करते समय निम्नलिखित स्टॉक चार्ट पैटर्न सबसे पहचानने योग्य और सामान्य चार्ट पैटर्न हैं। सबसे महत्वपूर्ण स्टॉक चार्ट ट्रेडिंग पैटर्न में से ग्यारह के लिए हमारा गाइड अधिकांश वित्तीय बाजारों पर लागू किया जा सकता है और यह आपके तकनीकी विश्लेषण को शुरू करने का एक अच्छा तरीका हो सकता है।

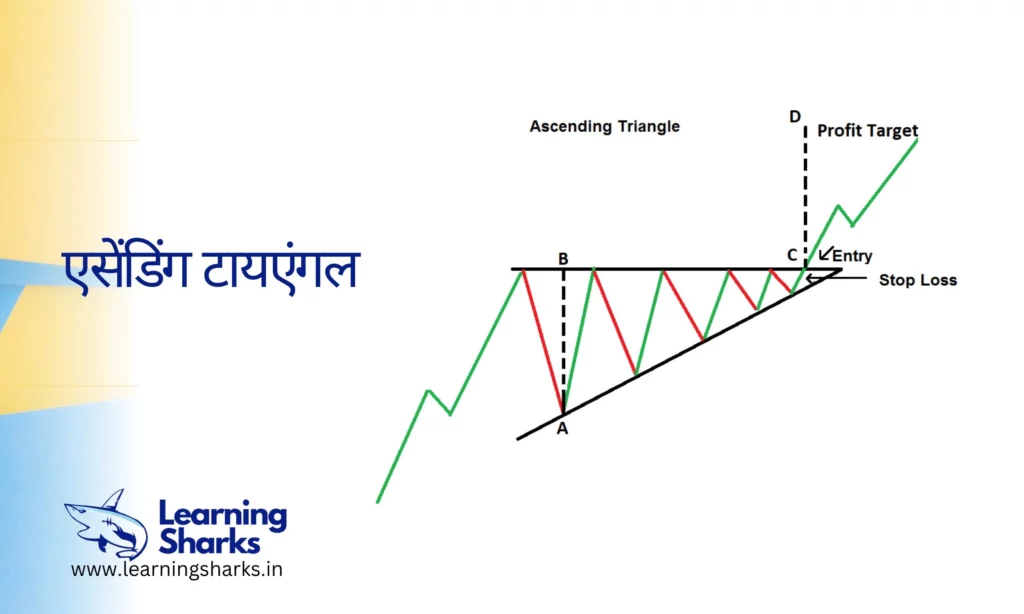
1.एसेंडिंग टायएंगल

यह कीमतों में उतार-चढ़ाव से बनता है जो स्विंग हाई के साथ एक क्षैतिज रेखा और स्विंग लो के साथ एक बढ़ती हुई ट्रेंडलाइन को खींचने की अनुमति देता है। दो रेखाएँ एक त्रिभुज बनाती हैं। ट्रेडर्स अक्सर त्रिकोण पैटर्न से ब्रेकआउट के लिए देखते हैं। ब्रेकआउट उल्टा या नीचे की ओर हो सकता है।

एसेंडिंग टायएंगल (What Is an Ascending Triangle? chart pattern)

एसेंडिंग टायएंगल को अक्सर निरंतरता पैटर्न कहा जाता है क्योंकि कीमत आम तौर पर उसी दिशा में टूट जाती है, जो त्रिकोण बनाने से ठीक पहले की प्रवृत्ति थी।

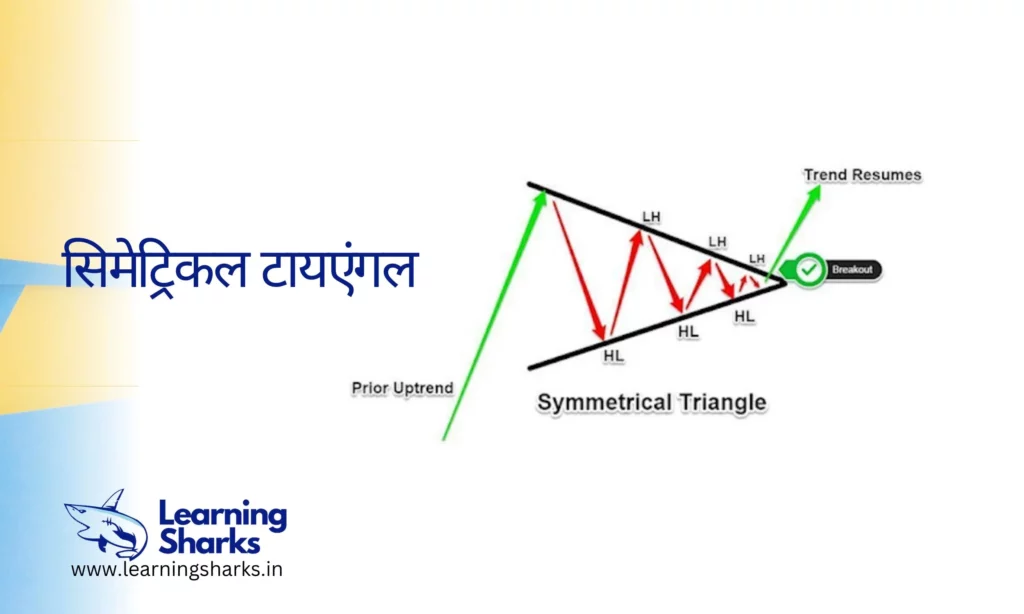
2. सिमेट्रिकल टायएंगल

symmetrical Triangle का मतलब होता है सममित त्रिभुज। जब market में price एक त्रिकोण जैसा pattern बनाता है तब इस pattern का निर्माण होता है। यह pattern अक्सर Side – ways market में बनता है तभी अच्छे से काम करता है। इस pattern के बनने के बाद market का price जिस दिशा में Break out देता है या Trend line को तोड़ता है उसी दिशा में जाने लगता है।

जब market side ways चल रहा हो और price दो बार या उससे अधिक बार Support और Resistance बनाते हुए एक symmetrical triangle का formation करे तब market neutral की स्थिती में आ जाता है और जैसे ही price support या Resistance में से किसी एक को High Volume के साथ break करे तब जिस दिशा में break होता है, तब market उसी दिशा में जाता हुआ देखने को मिल सकता है। 

     » इस प्रकार से Symmetrical Triangle chart pattern का formation होता है और इसकी कोई एक दिशा नहीं होती है इसलिए इसे Neutral chart pattern कहा जाता है।

सिमेट्रिकल टायएंगल (Symmetrical Triangle chart pattern)

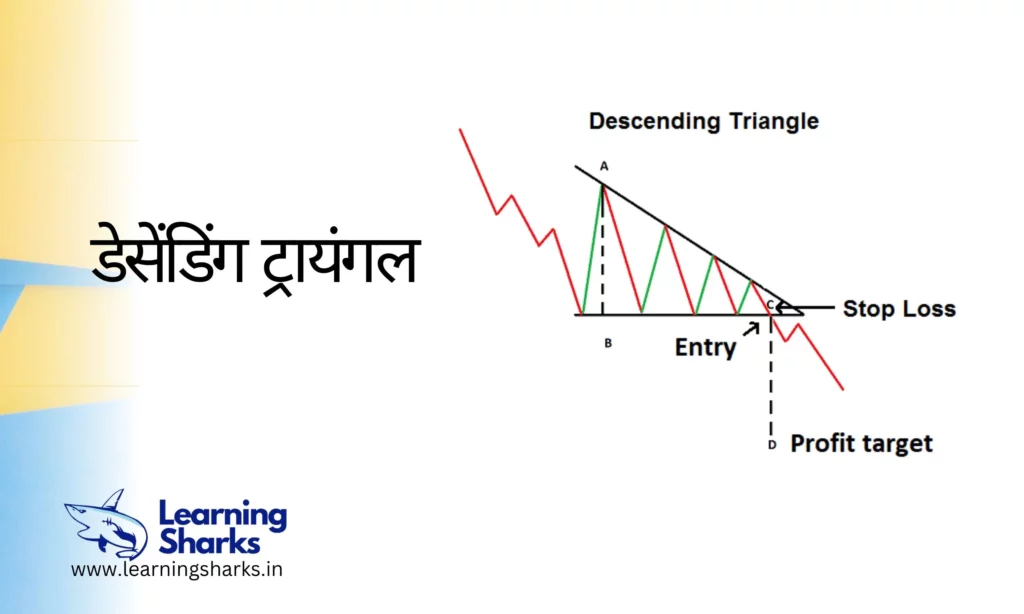
3. डेसेंडिंग ट्रायंगल (Descending triangle pattern)

3. डेसेंडिंग ट्रायंगल
डेसेंडिंग ट्रायंगल

इसका chart Pattern घटते हुए त्रिभुज के समान दिखाई देता है। इसलिए इसे हम Descending triangle pattern कहते हैं। यह pattern down trend में बनता है और यह Bearish Continuation को indicate करता है।

     > मतलब इस pattern के बनने के बाद market में जो मंदी का trend चल रहा है वह आगे भी चलेगा। ऐसा संकेत मिलता है। इसलिए इसे Bearish continuation chart pattern कहते हैं।

 » Down trend के दौरान chart में price एक Support बनाकर ऊपर उठने लगता है। लेकिन मंदी के trend को बरकरार रखते हुए पास में ही एक Resistance बनाकर वापस गिरने लगता है। इस प्रकार chart में पहला support और पहला Resistance का formation होता है। 

     अब price नीचे की ओर गिरता है और पहले support के आस-पास या बराबर में दूसरा Support बनाता है और फिर price ऊपर जाने लगता है और पास में ही दूसरा Resistance बना लेता है। लेकिन यह दूसरा Resistance पहले Resistance की तुलना में lower होता है।

Anlon Technology Solutions: Share price gives 150% return on debut- Fire Rescue Company

The stock increased by another 5% to Rs 263.65 during its first trading session on Tuesday, bringing the overall gains to 166% over the stated issue price of Rs 100.

It offers services such as airport rescue and fire fighting vehicles, high-rise building rescue, evacuation, and fire-fighting equipment, industrial fire engines, runway rubber removal, and paint removal machines, runway sweeping, and bay cleaning, among others.

Anlon Technology Solutions, the newest Dalal Street debutant, gave its investors a strong listing pop of 150% on Tuesday. Even in the SME market, it is one of the best listing pops in the near future.

Anlon Technology Solutions, which made its debut on the NSE’s SME platform, reached a settlement price of Rs 250 per share on Tuesday, increasing by 150% over its initial offering price of Rs 100 per share.

The stock increased by another 5% to Rs 263.65 during its first trading session on Tuesday, bringing the overall gains to 166% over the stated issue price of Rs 100.

Anlon Technology Solutions’ initial public offering (IPO) was open for subscription between December 29, 2022, and January 2, 2023. The company sold its shares for between Rs 95 and Rs 100 each in order to raise Rs 15 crore.

Let’s look at the fundamentals of the stock.

Profit & Loss

Figures in Rs. Crores

Mar 2020Mar 2021Mar 2022
Sales +13.6914.3519.34
Expenses +12.6713.0715.23
Operating Profit1.021.284.11
OPM %7.45%8.92%21.25%
Other Income +0.130.090.25
Interest0.070.140.75
Depreciation0.130.190.20
Profit before tax0.951.043.41
Tax %28.42%29.81%28.74%
Net Profit0.690.742.43
EPS in Rs690.00740.002,430.00
Dividend Payout %0.00%0.00%0.00%

Balance Sheet

Figures in Rs. CroresCORPORATE ACTIONS

Mar 2020Mar 2021Mar 2022
Share Capital +0.010.010.01
Reserves1.712.454.88
Borrowings +0.181.615.81
Other Liabilities +9.1511.4610.27
Total Liabilities11.0515.5320.97
Fixed Assets +1.731.593.87
CWIP0.000.000.00
Investments0.000.000.00
Other Assets +9.3213.9417.10
Total Assets11.0515.5320.97
The balance sheet of Anlon technology

The issue received a whopping 428.6 subscriptions, with the non-institutional bidder allocation receiving 883.58 subscriptions and the retail bidder quota receiving 447.06 subscriptions. It was reserved 54.53 times for institutions that met the criteria.

Each lot in the issue cost Rs 1.2 lakh and had a fixed lot size of 1,200 shares. Each lot at listing cost Rs 3 lakh, giving the investors who received the share allocation a profit of Rs 1.8 lakh.

Conclusion

Overall, the company seems to be doing good in terms of profitability. One can make this stock a part of their portfolio for the long term. However, it is advised to wait for the stock to find it support and resistance.

This is purely for educational purposes. If you are interested in the stock market courses, you can visit our courses page.

#anlontechnologyshareprice #latestshareprice #stockmarket #sharemarket

Hindustan Copper- Mining company l Entry price l Latest Hind copper share price

stock market chart patterns

As of 12:423 IST on the NSE, Hindustan Copper Ltd. is trading at Rs 123.70, up 3.33% on the day. The stock has lost 30% in the last year but has recovered from the price. Sensex Today Live 59763.31 | Nifty Live 17825.1 – Indian Share Market Live, Stock Market News | Learning sharks

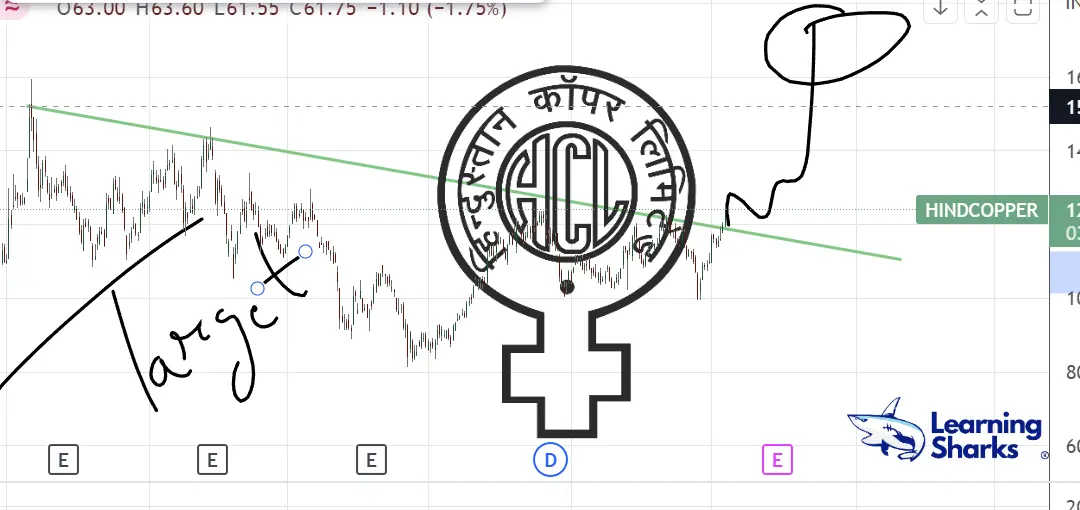
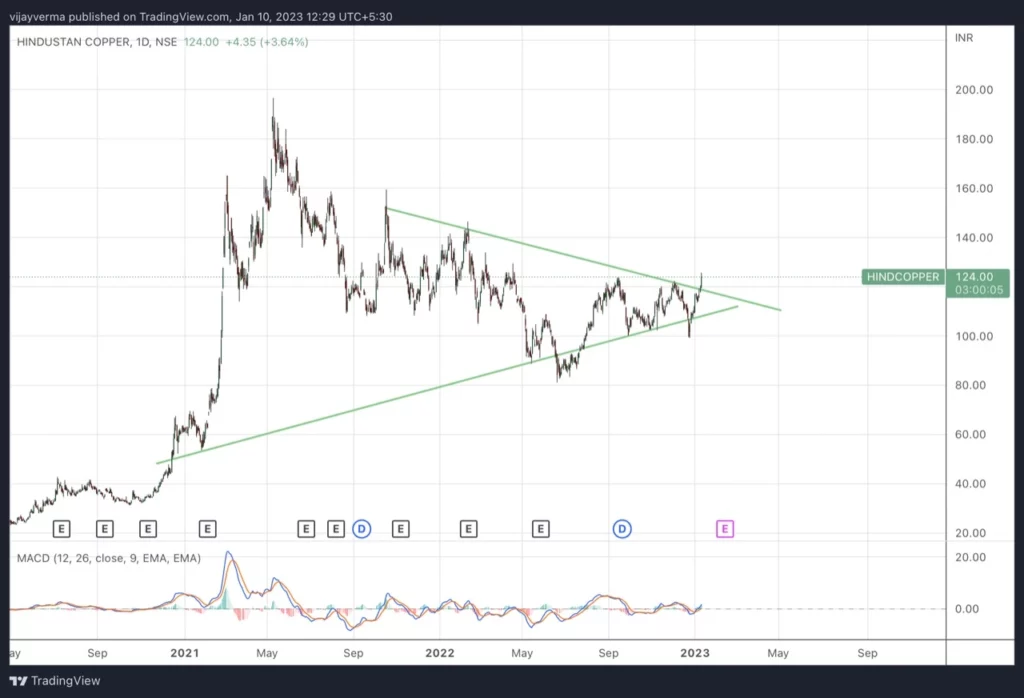
Let’s look at the technicals of the stock, The stock seems to be breaking the resistance level of Rs117 with the target up to Rs 162 a piece.

The stock seems to be coming out of its symmetrical triangle pattern. This could push the price to a new high. While we are discussing the technicals of this stock. Let’s check out the fundamentals of this share price as well.

Profit & Loss

Standalone Figures in Rs. Crores / View Consolidated

Mar 2011Mar 2012Mar 2013Mar 2014Mar 2015Mar 2016Mar 2017Mar 2018Mar 2019Mar 2020Mar 2021Mar 2022TTM
Sales +1,1711,4851,3231,4891,0161,0721,2041,6701,8168321,7871,8221,650
Expenses +7889521,0209848889629811,3991,3101,0741,3761,3101,176
Operating Profit383534303505128110223271506-242411512474
OPM %33%36%23%34%13%10%18%16%28%-29%23%28%29%
Other Income +5385257102675227413757355060
Interest42621314266062643018
Depreciation97144151174113119142165253291295150177
Profit before tax335473404431804094122230-53887382339
Tax %33%32%12%33%16%5%34%35%37%-6%-26%2%
Net Profit22432335628668386280146-569110374344
EPS in Rs2.423.503.843.100.730.410.670.861.57-6.151.193.873.56
Dividend Payout %41%29%26%32%21%0%30%29%33%0%29%30%
Compounded Sales Growth
10 Years:2%
5 Years:9%
3 Years:0%
TTM:-8%
Compounded Profit Growth
10 Years:2%
5 Years:43%
3 Years:37%
TTM:86%
Stock Price CAGR
10 Years:-2%
5 Years:5%
3 Years:37%
1 Year:-9%
Return on Equity
10 Years:6%
5 Years:2%
3 Years:-2%
Last Year:25%

Shareholding Pattern

Numbers in percentages

Dec 2019Mar 2020Jun 2020Sep 2020Dec 2020Mar 2021Jun 2021Sep 2021Dec 2021Mar 2022Jun 2022Sep 2022
Promoters +76.0576.0576.0576.0576.0576.0572.7666.1466.1466.1466.1466.14
FIIs +0.200.190.140.120.410.711.141.070.260.310.671.32
DIIs +13.7013.6513.6413.5913.3112.6613.0217.0216.8016.4415.6115.95
Public +10.0610.1110.1810.2410.2410.5813.0815.7716.7917.1017.5816.59

CONCLUSION

Overall, the stock seems to be in the buying zone with targets of up to 20%. One can take an entry to fetch some profits. This is for educational purposes, not a buying call.

To know more about stock market courses, visit our course page

#stockmarket #hindcopper #hindustancopper #sharemarket #price

Reliance to buy 51% stake in this Chocolate share – Read to know if you should Invest

Lotus Chocolate Company Ltd share price - Full technical and fundamental analysis 2023

Who knew reliance’s Mukesh Ambani was such a big fan of chocolate? He recently plans to buy 51% of Lotus chocolate for 74 crores. Read full to know whether you should invest in this stock.

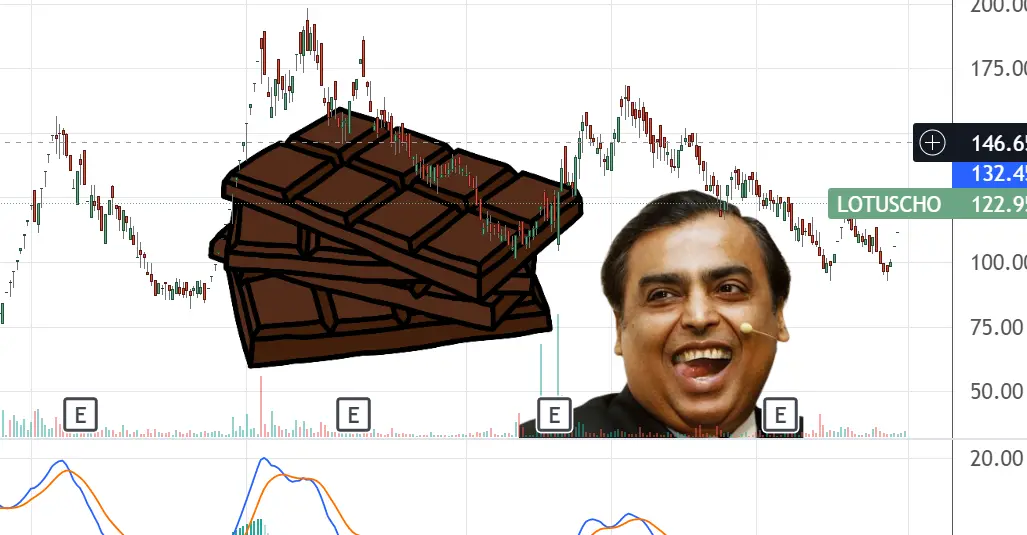
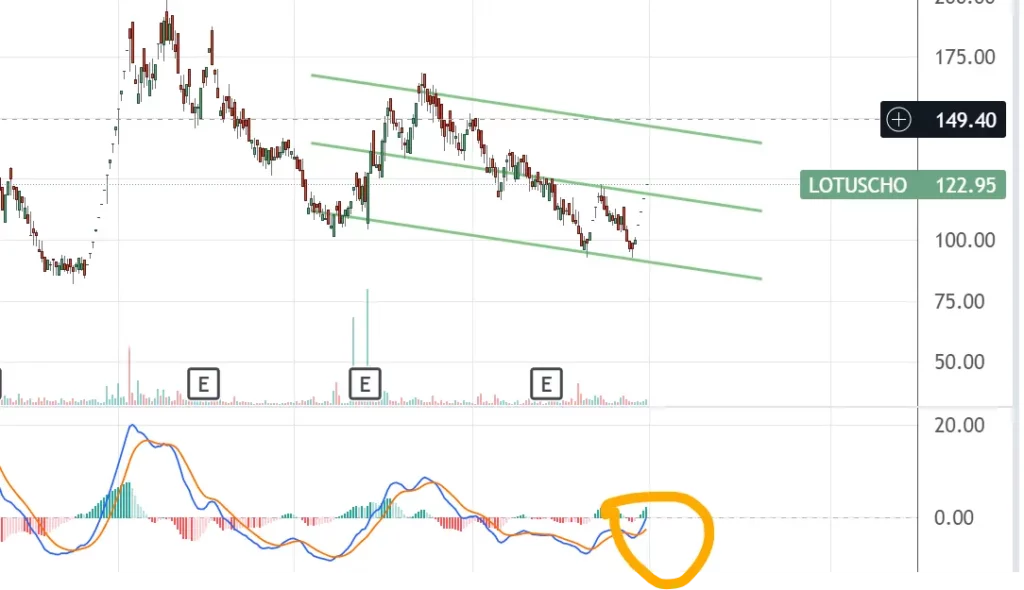
Lotus chocolate’s current share price is 122.95 apiece. Today the stock opened and rushed 5% during the trading hours on the BSE exchange. Let’s look at the technical analysis of this stock.

Lotus chocolate share price technical analysis

The company looks fine on the daily and Monthly chart time frame, however, on the Monthly time frame it seems overbought already. You should be a little concerned if you are planning to invest for the next few months. In the short time frame, the technical seems fine.

Let’s look at the Fundamentals of the Lotus chocolate share

Balance Sheet

Figures in Rs. CroresCORPORATE ACTIONS

Mar 2011Mar 2012Mar 2013Mar 2014Mar 2015Mar 2016Mar 2017Mar 2018Mar 2019Mar 2020Mar 2021Mar 2022Sep 2022
Share Capital +20.2320.2320.2320.2320.2320.2320.2320.2320.2320.2320.2320.2320.23
Reserves-18.57-20.66-22.19-24.88-24.29-23.03-23.50-22.45-21.13-20.20-18.43-12.42-12.84
Borrowings +20.4517.3816.9119.8718.3229.3623.2916.9415.6314.3016.2013.608.30
Other Liabilities +13.5012.1016.3414.8915.6515.0613.1514.9313.7514.1111.6913.445.65
Total Liabilities28.2221.6623.9022.7222.5234.2325.7822.2621.0921.0522.3027.4621.34
Fixed Assets +4.363.925.746.095.795.795.523.422.772.121.491.601.75
CWIP2.002.000.330.030.050.000.000.010.010.010.010.000.00
Investments0.200.180.180.000.000.000.000.000.000.000.000.000.00
Other Assets +21.6615.5617.6516.6016.6828.4420.2618.8318.3118.9220.8025.8619.59
Total Assets28.2221.6623.9022.7222.5234.2325.7822.2621.0921.0522.3027.4621.34
Balance sheet of Lotus chocolate share

While the company has reduced its borrowings, its reserves are Negative. While we look at the profit and loss

Profit & Loss

Figures in Rs. Crores

Mar 2011Mar 2012Mar 2013Mar 2014Mar 2015Mar 2016Mar 2017Mar 2018Mar 2019Mar 2020Mar 2021Mar 2022TTM
Sales +38.6955.5146.4456.3060.7865.4066.4756.9265.6969.8947.8786.9785.94
Expenses +42.2555.6147.0757.9759.8662.6565.0454.2263.7568.3245.4880.6382.04
Operating Profit-3.56-0.10-0.63-1.670.922.751.432.701.941.572.396.343.90
OPM %-9.20%-0.18%-1.36%-2.97%1.51%4.20%2.15%4.74%2.95%2.25%4.99%7.29%4.54%
Other Income +0.080.310.140.060.590.190.130.020.070.050.110.20-0.24
Interest0.881.800.530.420.070.911.220.660.150.200.200.310.38
Depreciation0.510.500.510.660.730.770.800.800.650.650.620.220.18
Profit before tax-4.87-2.09-1.53-2.690.711.26-0.461.261.210.771.686.013.10
Tax %0.00%0.00%0.00%0.00%0.00%0.00%0.00%26.19%-9.92%-14.29%-5.36%0.00%
Net Profit-4.87-2.08-1.54-2.690.711.26-0.460.931.330.881.776.013.10
EPS in Rs-3.79-1.62-1.20-2.090.550.98-0.360.721.040.691.384.682.41
Dividend Payout %0.00%0.00%0.00%0.00%0.00%0.00%0.00%0.00%0.00%0.00%0.00%0.00%
Profit and loss of lotus chocolate share

The company has turned slightly profitable, and most of the shares are with the promoters themselves. Overall it is a decent buy. One can accumulate this share at this rate and average if it goes south.

If you wanna stay updated with these stock recommendations for educational purposes, stay connected with our website. Have a look at the share market courses here our institute has to offer.

#sharemarket #reliance #lotuschocolateshareprice #mukeshambani #latestpost2023

Should you buy, sell or hold this share? #IRFC share price

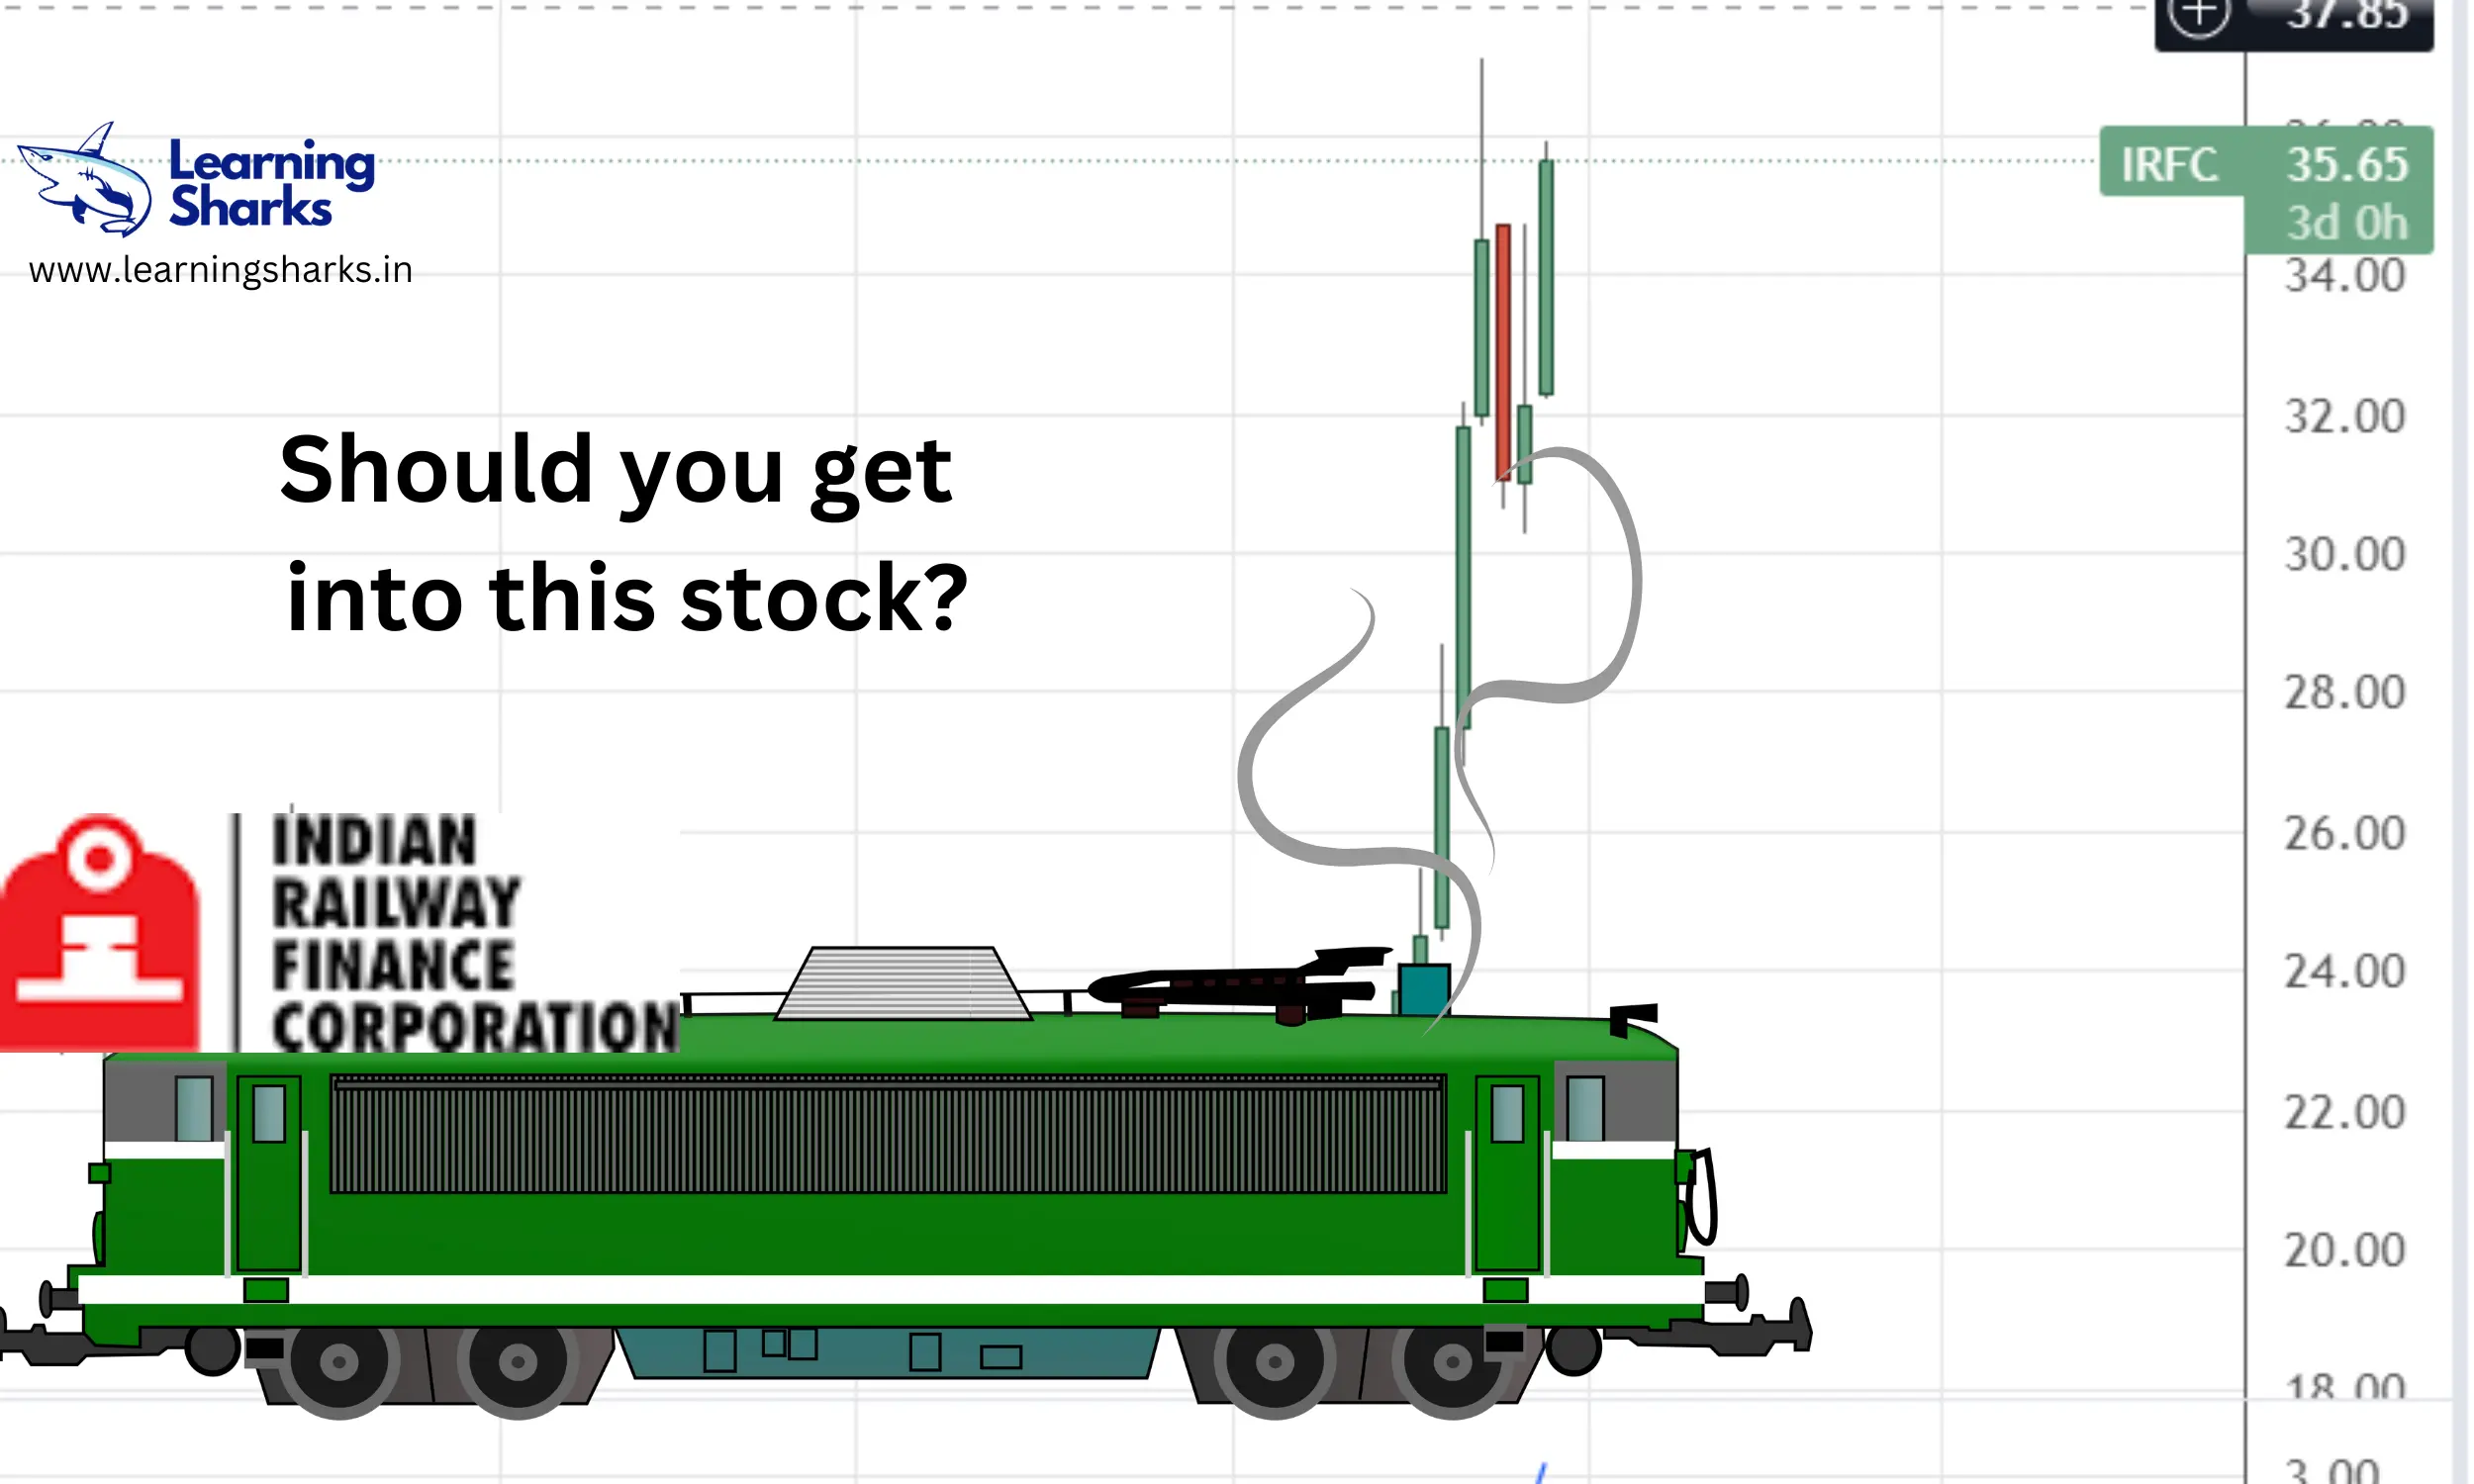
Technical analysis of IRFC share price

Share price of IRFC NSE Target: On Tuesday, December 20, despite a generally bearish market, the share price of Indian Railway Finance Corporation (IRFC) soared 9%. The PSU stock has experienced recent volatility as profit-taking has dropped the price more than 20% from its 52-week high of Rs. 37.10, which it reached on November 30.

The benchmark indices declined in opening trade as a result of subpar global cues, but the stock opened in the green at Rs 32.95 per share on NSE, up slightly from the previous close of Rs 32.85. In today’s session, the Indian Railways stock experienced strong momentum and strong volume as strong buying propelled it to the day’s high of Rs 35.95, soaring 9%.

According to NSE data as of 3:18 PM, 16,16,33,418 shares of IRFC were traded during today’s trade.

Let’s look at the fundamentals of the stock.

Profit & Loss

Figures in Rs. Crores

Mar 2012Mar 2013Mar 2014Mar 2015Mar 2016Mar 2017Mar 2018Mar 2019Mar 2020Mar 2021Mar 2022TTM
Sales +4,6425,5506,1976,9397,5079,0479,26711,13413,42115,77120,29922,465
Expenses +92219343826384866113123148
Operating Profit4,6335,5286,1786,9057,4689,0219,22911,08513,35515,65720,17722,317
OPM %100%100%100%100%99%100%100%100%100%99%99%99%
Other Income +1211101-00023
Interest3,6204,0754,6074,9925,5196,8886,6388,18310,16311,23714,07515,842
Depreciation00000000041415
Profit before tax1,0131,4541,5721,9141,9502,1332,5922,9023,1924,4166,0906,463
Tax %53%64%55%60%56%56%21%22%0%0%0%
Net Profit4815227017588499342,0552,2553,1924,4166,0906,462
EPS in Rs2.693.384.664.94
Dividend Payout %21%21%6%20%40%40%18%18%0%31%30%

Balance Sheet

Figures in Rs. CroresCORPORATE ACTIONS

Mar 2012Mar 2013Mar 2014Mar 2015Mar 2016Mar 2017Mar 2018Mar 2019Mar 2020Mar 2021Mar 2022Sep 2022
Share Capital +2,1022,3523,3523,5844,5266,5266,5269,38011,88013,06913,06913,069
Reserves3,0493,4423,9784,5554,9995,4837,40215,64818,41922,84527,92830,481
Borrowings +50,25158,75369,91771,27087,503106,395134,006173,933234,377323,145388,440386,733
Other Liabilities +4,6746,2086,6838,23811,37211,24513,5347,64210,82821,42320,54434,915
Total Liabilities60,07670,75583,93087,647108,400129,650161,468206,604275,504380,482449,980465,198
Fixed Assets +131313121212111111453831
CWIP000000000000
Investments151311988141312121010
Other Assets +60,04870,72983,90687,626108,381129,630161,443206,579275,482380,424449,932465,157
Total Assets60,07670,75583,93087,647108,400129,650161,468206,604275,504380,482449,980465,198

Shareholding Pattern

Numbers in percentages

Mar 2021Jun 2021Sep 2021Dec 2021Mar 2022Jun 2022Sep 2022
Promoters +86.3686.3686.3686.3686.3686.3686.36
FIIs +1.440.861.061.091.121.021.05
DIIs +4.233.743.183.203.183.253.39
Public +7.979.039.409.349.339.369.19

Overall, the share is nice however it will not be a multi-bagger. This is merely an educational opinion. and not investment advice.

#IFRC #SHAREPRICE

Essential Things To Know About Investing

learning sharks stock market Institute : Investing
Image source: Edelweiss

There is a wealth of information available when it comes to investing, and it can be intimidating, especially for novices. However, with information and awareness, it may be simple to begin. There are several things to know before investing, regardless of whether you wish to invest in fixed return securities or the stock market. Let’s explore the various facets of investments in further detail.

Know Your Financial Status,Goals and Investing

Investments demand discipline and careful planning. Understand your financial situation, including your present assets, liabilities, and income, before investing your hard-earned money. Similarly, be clear about your short- and long-term financial objectives. Your chances of reaching your financial objectives might be improved by being aware of your financial situation before investing.

Why Do You Want To Invest?

Wealth Creation

The majority of us have an unstated financial objective of increasing our wealth, commonly known as our money. Making your money work harder for you is the key to achieving that, and the best asset type for that is equities. You can decide to invest in a combination of stock, debt, and gold depending on your financial objectives, risk tolerance, and investment horizon; the higher the percentage of equities, the higher the likelihood of wealth development.

Accomplish Financial Goals

Even while building wealth may be the unstated financial objective, eventually your investments will be employed to achieve your financial objectives. The most common and important goals are retirement, children’s education, marriage, buying a car or house, and so on. Make a list of your objectives and develop an investment plan to meet them. If necessary, get a seasoned investment advisor to assist you with the same. Though you may have several aspirations, time is limited. Delays have a cost since time is worth money.

Leave A Legacy For Heirs

People may reflect more on their legacy and what they will leave for their heirs as they age. The legacy can include assets like real estate, equities, mutual funds, bonds, and precious metals. This is an element of succession planning, which could call for professional help because it entails formalities like drafting a will and setting up a trust.

Different Investing Avenues

Stocks

By purchasing stocks, you own a portion of a business whose value may increase in the future. If the company’s value increases over time, you will eventually profit. You must open a Demat and Trading account with a brokerage company before you can begin investing in stocks.

Make sure a stock has a solid foundation before investing. This entails taking a close look at elements including the company’s finances, management, market competition, etc. A company will probably perform well in the long run if it is strong in all of these areas. Investing in a fundamentally good firm is a great strategy to boost your chances of success even if there is no guarantee that a stock will go higher.

Mutual Funds

If you are a novice or don’t have the knowledge, time, or resources to choose the finest stock, mutual funds are your best solution. They are not only reasonably priced, but they also provide a wide range of investment options. Managers of mutual funds have the knowledge that can help you get greater results. Additionally, the majority of funds are liquid, allowing you to withdraw your investment whenever you need cash.

Deposits, Bonds, and Debentures

For those looking for consistent cashflows or income, these fixed-return investments are suitable. Although the nature of the instruments is the same, depending on the borrower, they go by different names. These are the methods used by banks, financial institutions, private corporations, and state and federal governments to raise money. The actual returns are frequently negative after accounting for taxes and inflation. The advice of experts is to combine fixed returns with equity that can outperform inflation.

Knowing the credit risk, also known as default risk, will help before you invest in any of them. The borrowing entity’s creditworthiness affects the interest rate in a variety of ways. It is crucial to analyse the borrowing entity’s prior borrowing and repayment history in order to determine its creditworthiness.

Things to Know Before Investing

Link Your Investment To A Financial Goal

It is simple to build a portfolio that is in line with the risk and investment horizon of the goal when you start with a financial objective. It is easy to predict the potential return of a portfolio and determine in advance whether the financial objective will be met.

Know About Product Structure

Understanding how investment products are organized in terms of return, transaction cost, fees, taxation, and liquidity is essential before you begin investing.

Match Your Risk Tolerance With Product Risk

Each product’s risk-return relationship is unique. To ensure that your portfolio is set up to provide the best results, it is crucial to match your risk tolerance with the product risk. For instance, if you’re a cautious investor, you might feel better at ease making investments in lower-risk securities like bonds or savings accounts. However, if you have a strong tolerance for risk, investing in equities or other more volatile asset types may allow you to achieve bigger returns.

Investment Horizon

The length of time you plan to keep your money invested is known as the investment horizon. You can take on greater risk as your investment horizon lengthens. You’ll have more time to recover from temporary losses as a result. Similar to this, you should be extra cautious with your investments if your investment horizon is shorter. Otherwise, you can end up losing money.

Conclusion

You are now knowledgeable about the subtleties of investment. Start right away is the next step. Keep in mind that wasting time has a price, therefore don’t do it!

Why Investing is Important & Where to Invest?

stock market institute in jaipur

Why invest?

Basics of stock market

Why invest?
• who regulates
• financial interdependence
• IPOs
• Stock Market returns
• Trading system

• Day end settlements
• Corporate actions
• News and Events
• Getting started
• Rights, ofs,fpo and more
• Notes


Why Investing is Important & Where to Invest?

Why Investing is Important & Where to Invest?

Investing is a great way to grow your money and save for the future. It puts your money to work for you, allowing it to appreciate in value over time. You can invest in stocks, bonds, mutual funds, or ETFs (exchange-traded funds) and use the returns from those investments for retirement savings or other goals you may have. Different types of investments have different levels of risk and reward—so it’s important to conduct research and speak with a financial professional before taking a plunge into investing. Once you determine where and how much to invest, make sure you’re diversifying your portfolio across multiple investments so that no one type of investment represents all your holdings.

This helps reduce financial risks down the road by ensuring that if one investment falls through, others will still be able to support you financially. With careful planning and due diligence, investing could ultimately help you build wealth over time!

Why Should You Invest?

Also, Investing is essential to achieve your goals. It is the only way to make your future better. By making investments, you are also saving and accumulating a corpus for a rainy day. Apart from that, making regular investments forces you to set aside a sum regularly, thereby helping you instill a sense of financial discipline in the long run.

Impact of Inflation & Importance of Investing

Importantly, Simply put, inflation is a rise in the cost of goods and services. However,  Your purchasing power and money’s value are both diminished. Undoubtedly, With the same amount of money, you can buy fewer things when inflation rates rise. The inflation rate is outside of your control. If you want to stay ahead of inflation, you must have enough money now to buy the full range of the goods you plan to buy in the future.

Surely, Money doesn’t, however, grow on its own. Whereas,  Your money must generate returns if it is to grow. You must invest if you want to get returns. Investments are therefore required to combat inflation. At last, An 8 % inflation rate means that you will need 8 % more money than you do now to buy the same thing next year. Here is how Rs. 1 lakh would be worth after eight years of inflation at 8%.

Where can I invest?


Having figured out the reasons to invest, the next obvious question would be – Where would one invest, and what are the returns one could expect by investing?

For example, Once one has determined why one should invest, the next logical question is where to invest and what kind of returns one can anticipate. A category of investments with specific risk and return characteristics is referred to as an asset class. Popular asset classes include the ones listed below.

  • Fixed income instruments
  • Equity
  • Real estate
  • Commodities (precious metals)


Fixed Income Instruments

Investable securities have a low risk to the principal, and the investor receives a return in the form of interest based on the specific fixed-income security. Whereas,  The intervals at which interest is paid can be quarterly, semi-annual, or annual.  Capital invested is returned to the investor at the conclusion of the term of deposit, also referred to as the maturity period.

An example of a fixed income investment is:

  • Firstly, Banks offer fixed deposits
  • Secondly, Bonds issued by government-related organizations like NHAI and HUDCO,corporate-issued bonds
  • Thirdly, Bonds issued by the Indian government
  • Last but not least, The typical return on a fixed income investment ranges between 8% and 11% as of June 2014.

Equity

Accordingly, Purchasing stock in publicly traded companies is an example of investing in equities. Even so, Shares are exchanged on the National Stock Exchange and the Bombay Stock Exchange also known as NSE and BSE.


Also, When a person invests in equity, there is no capital guarantee, in contrast to a fixed income instrument. As a compromise, the returns on equity investments can be quite good. Indian equities have generated returns with a CAGR (compound annual growth rate) of roughly 14 to 15% over the past 15 years. 


In addition, Long-term returns on investments in some of the best and most efficiently run Indian companies have exceeded 20% CAGR. Such investment opportunities require skill, diligence, and perseverance to identify.


Long-term returns on investments in some of the best and most efficiently run Indian companies have exceeded 20% CAGR. Such investment opportunities require skill, diligence, and perseverance to identify.

Real Estate

Furthermore, Transactions involving the purchase and sale of both commercial and noncommercial land are a part of real estate investment. Examples of typical transactions would be those that occur in sites, apartments, and commercial structures. Rental income and capital growth of the investment amount are the two sources of income from real estate investments.

Transaction process, which involves document legalization, can be quite complicated. Real estate investments typically require a sizable cash outlay. Returns produced by real estate are not formally quantified. It would therefore be difficult to comment on this.

Commodity – Bullion

Especially, One of the most well-liked investment options is to buy gold and silver. Over an extended period, gold and silver have increased in value. In the past 20 years, investments in these metals have generated a CAGR return of about 8%. Gold and silver investments can be made in a variety of ways. Especially, , Exchange Traded Funds or jewelry are two options for investing (ETF).

An investment note

Clearly, Investments should be well-balanced across all asset classes. It is a good idea to spread your investment across several asset classes. Asset allocation refers to the process of distributing funds among different asset classes.


Undoubtedly, A young professional might. For example, take on more risk given his age and the years of investment he has under his belt. Generally speaking, investors should invest about 70% of their available funds in equity, 20% in precious metals, and the remaining 30% in fixed-income investments.


According to the same logic, a retiree could allocate 80% of his savings to fixed income, 10% to equity markets, and 10% to precious metals. An investor’s risk tolerance determines the ratio in which investments are spread across asset classes.

What should you know before investing?

Definitely, Investing is a fantastic option, but you should be aware of the following things before getting started.

1. Risk and return are mutually exclusive. Higher return at higher risk. The return is lower than the risk.

2. Best course of action, if you want to safeguard your principal, is to invest in fixed income. It is considerably less dangerous. When you adjust the inflation return, though, you run the risk of losing money. For instance, receiving a fixed deposit that pays 9 percent when inflation is 10 percent results in a net loss of 1 percent annually. Investors who are extremely risk-averse should consider fixed-income investments.

3. Real Estate investment requires a large outlay of cash and cannot be done with smaller amounts. Also, Liquidity is another issue with real estate investment – you cannot buy or sell whenever you want. Moreover, You always have to wait for the right time and the right buyer or seller to transact with you