Learning sharks-Share Market Institute


Rajouri Garden  8595071711 7982037049  Noida 8920210950 , and  Paschim Vihar  7827445731  

Fee revision notice effective 1st April 2025; No change for students enrolled before 15th May 2025

Download “Key features of Budget 2024-2025here

Godrej Properties Share Price Analysis

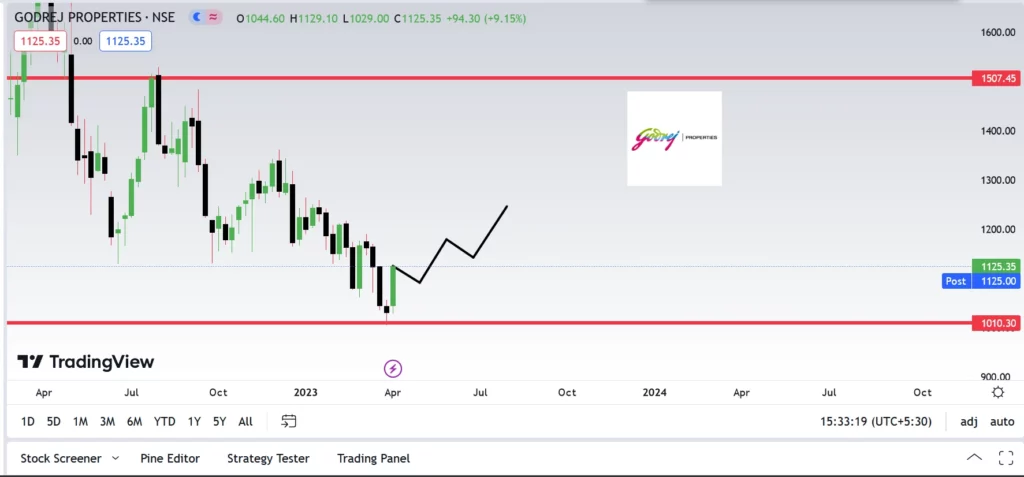
As of 10:15AM on Thursday, shares of Godrej Properties Ltd. were up 1.89 percent to Rs 1075.7. (IST). During the period, the stock’s price ranged between Rs 1053.0 and Rs 1078.7.

The stock’s return on equity (ROE) was 4.06 percent. Around 10:15 AM, there were 1015 shares traded on the counter, with a transaction of Rs 0.99 crore. Godrej Properties Ltd.’s shares recently traded at a 52-week high of Rs. 1704.9 and a 52-week low of Rs. 1005.7.

Developer/FII Holding
Promoters owned 58.42% of the business as of December 31, 2022, while foreign investors owned 27.31% and domestic institutional investors owned 2.61%.

Primary Financials
The company reported consolidated sales of Rs 404.58 crore for the quarter that ended on Dec. 31, 2022, an increase of 9.58% from the previous quarter’s Rs 369.2 crore and 13.35% from the same quarter a year earlier. Net income after taxes for the most recent quarter.

Let us look at the Fundamentals

Profit & Loss

Consolidated Figures in Rs. Crores / View Standalone

Mar 2011Mar 2012Mar 2013Mar 2014Mar 2015Mar 2016Mar 2017Mar 2018Mar 2019Mar 2020Mar 2021Mar 2022TTM
Sales +4527701,0371,1791,8432,1231,5831,6042,8172,4417651,8251,937
Expenses +3466507518971,5861,9861,3301,8192,6392,1811,2141,8801,956
Operating Profit105120286283257137253-216178260-449-56-19
OPM %23%16%28%24%14%6%16%-13%6%11%-59%-3%-1%
Other Income +10788107583146150499419473568761786
Interest4534541104150234220185167164
Depreciation4446101414161421202123
Profit before tax204199289347326228284117348493-86516580
Tax %30%35%32%32%28%30%27%26%27%44%-121%32%
Net Profit14312919723623616020787253274-189351425
EPS in Rs7.344.926.958.009.587.339.564.0111.0410.73-6.8112.6815.10
Dividend Payout %24%24%23%25%21%0%0%0%0%0%0%0%
Compounded Sales Growth
10 Years:9%
5 Years:3%
3 Years:-13%
TTM:109%
Compounded Profit Growth
10 Years:15%
5 Years:11%
3 Years:15%
TTM:514%
Stock Price CAGR
10 Years:16%
5 Years:8%
3 Years:20%
1 Year:-37%
Return on Equity
10 Years:4%
5 Years:2%
3 Years:2%
Last Year:4%

Balance Sheet

Consolidated Figures in Rs. Crores / View StandaloneCORPORATE ACTIONS

Mar 2011Mar 2012Mar 2013Mar 2014Mar 2015Mar 2016Mar 2017Mar 2018Mar 2019Mar 2020Mar 2021Mar 2022Sep 2022
Share Capital +70787899100108108108115126139139139
Reserves8421,3651,3511,6941,7471,6571,8961,1022,3544,6828,1818,5368,639
Borrowings +9452,0871,6782,5743,4863,1233,9803,7033,5163,7154,5935,1965,382
Other Liabilities +3611,1791,5721,7792,0301,6911,1973,3582,1071,5673,3333,9324,885
Total Liabilities2,2184,7094,6796,1477,3636,5787,1818,2718,09210,09016,24517,80419,045
Fixed Assets +4646516411710710211397113174183188
CWIP1193662731071100163229340428
Investments000006647601,4542,6373,5715,2434,8834,489
Other Assets +2,1704,6444,5936,0217,1735,8076,3196,6335,2596,24310,59912,39713,940
Total Assets2,2184,7094,6796,1477,3636,5787,1818,2718,09210,09016,24517,80419,045

Dhani Share Price Analysis- 17% up today

The shares of Dhani Services Ltd, formerly known as Indiabulls Ventures Ltd, surged in late-day trade on Monday, continuing their fourth consecutive session of recovery. Sameer Gehlaut will become the company’s non-executive chairman as of March 31, 2023, according to a statement made by the business in an exchange filing. our experts expect a retest at Rs30 then a bull rally in Dhani stock.

Let us look at the Fundamentals

Profit & Loss

Consolidated Figures in Rs. Crores / View StandalonePRODUCT SEGMENTS

Mar 2011Mar 2012Mar 2013Mar 2014Mar 2015Mar 2016Mar 2017Mar 2018Mar 2019Mar 2020Mar 2021Mar 2022TTM
Sales +3641951912843983974139801,9932,9151,3471,434830
Expenses +2461641221191401622014787501,9529631,9861,157
Operating Profit11831691652582362135021,243963384-551-327
OPM %32%16%36%58%65%59%51%51%62%33%29%-38%-39%
Other Income +-327181012961544929118
Interest402882461148139224591824518284198
Depreciation18128513232412271168495101
Profit before tax57-7611541947714628162927-209-901-508
Tax %33%-48%-4%34%22%4%30%25%27%-55%-10%4%
Net Profit38-10631021517410221046042-230-860-528
EPS in Rs1.38-0.372.313.704.862.122.693.997.590.09-4.27-14.42-8.84
Dividend Payout %61%0%110%18%52%119%31%22%15%3,836%0%0%
Compounded Sales Growth
10 Years:22%
5 Years:28%
3 Years:-10%
TTM:-39%
Compounded Profit Growth
10 Years:%
5 Years:%
3 Years:%
TTM:33%
Stock Price CAGR
10 Years:13%
5 Years:-34%
3 Years:-30%
1 Year:-51%
Return on Equity
10 Years:0%
5 Years:-2%
3 Years:-7%
Last Year:-17%

Balance Sheet

Consolidated Figures in Rs. Crores / View StandaloneCORPORATE ACTIONS

Mar 2011Mar 2012Mar 2013Mar 2014Mar 2015Mar 2016Mar 2017Mar 2018Mar 2019Mar 2020Mar 2021Mar 2022Sep 2022
Share Capital +4646464652596493113102115121121
Reserves1981881711712682733851,8066,3124,9255,0684,9423,971
Borrowings +198371373681,6902,1931,5194,9298,6485,4103,7392,4821,369
Other Liabilities +2882431912324151962479309421,1291,2001,079857
Total Liabilities7305145468182,4252,7202,2157,75816,01511,56610,1218,6246,318
Fixed Assets +503932346646608666118755409537457
CWIP001011368596670
Investments488343326901634996386341,420588380
Other Assets +6333924707511,6802,0231,9597,18815,25010,1718,2867,4925,481
Total Assets7305145468182,4252,7202,2157,75816,01511,56610,1218,6246,318

GHCL Share Price Analysis

A mid-cap business in the chemical sector, GHCL Ltd. has a market value of Rs. 6,071.13 crore. Soda ash (anhydrous sodium carbonate) and sodium bicarbonate (baking soda), two crucial raw materials for the glass and ceramics industries, are manufactured by the chemical company. To supply the raw materials needed to produce soda ash, GHCL also runs lignite mines in the Khadsaliya district of Gujarat. Another product that GHCL produces at a capacity of about 65,000 MTPA is sodium bicarbonate, a vital raw material for industries like baking, medicines, the production of fire extinguishers, cleaning products, etc.

Let us look at the fundamentals

Profit & Loss

Consolidated Figures in Rs. Crores / View StandalonePRODUCT SEGMENTS

Mar 2011Mar 2012Mar 2013Mar 2014Mar 2015Mar 2016Mar 2017Mar 2018Mar 2019Mar 2020Mar 2021Mar 2022TTM
Sales +1,5681,9582,2542,2012,3562,5312,7842,9193,3413,3052,4913,7785,301
Expenses +1,3051,6021,8471,7671,8281,9012,1032,3132,5822,5761,8862,7973,673
Operating Profit2633564074345286296816077597296059821,628
OPM %17%18%18%20%22%25%24%21%23%22%24%26%31%
Other Income +209-50-26-15-337381616185896
Interest152213179183171165137127127120746452
Depreciation1001068282858286110117131111117123
Profit before tax3146961432573804954075314954378591,549
Tax %131%3%26%24%29%32%23%13%34%20%25%25%
Net Profit-1044711091822583803563513973266471,170
EPS in Rs-0.964.457.1410.8518.1925.7738.0436.5835.7641.7434.3267.82122.44
Dividend Payout %-209%45%28%18%12%0%13%14%14%7%16%0%
Compounded Sales Growth
10 Years:7%
5 Years:6%
3 Years:4%
TTM:64%
Compounded Profit Growth
10 Years:32%
5 Years:11%
3 Years:23%
TTM:144%
Stock Price CAGR
10 Years:31%
5 Years:14%
3 Years:79%
1 Year:-2%
Return on Equity
10 Years:22%
5 Years:20%
3 Years:19%
Last Year:23%

Balance Sheet

Consolidated Figures in Rs. Crores / View StandaloneCORPORATE ACTIONS

Mar 2011Mar 2012Mar 2013Mar 2014Mar 2015Mar 2016Mar 2017Mar 2018Mar 2019Mar 2020Mar 2021Mar 2022Sep 2022
Share Capital +10010010010010010099979895959596
Reserves4453824674876709361,2471,5131,8272,0542,3892,9903,502
Borrowings +1,9151,7951,5581,4861,3241,3651,4631,3221,3021,254782788509
Other Liabilities +5996897559417585486946957677667121,122703
Total Liabilities3,0602,9672,8803,0142,8512,9493,5043,6283,9954,1693,9784,9954,810
Fixed Assets +2,1702,0671,8751,8691,9342,0492,4102,5022,5912,6642,6752,4742,528
CWIP19403212737267411712281213273
Investments59572159101291517182
Other Assets +8658509671,1259098481,0591,0431,2751,3751,2072,2921,827
Total Assets3,0602,9672,8803,0142,8512,9493,5043,6283,9954,1693,9784,9954,810

Mental Health of Stock Market Traders- Trader’s health special

Trading stocks is a dynamic and unique career in and of itself. However, due to easy entry to the market and the potential for huge profits quickly, non-professional people enter the activity. The number of De-mat accounts created at various countries’ central depository systems indicates that the number of traders and investors joining the capital markets has reached historic highs. Most of them lose some or all of their money due to their unquenchable avarice before giving up or going back to learning the fundamentals. Even cautious buyers occasionally engage in trading, which depletes their wealth.

Life Style of a Trader

The prevalence of sleep disorders has increased as a result of contemporary socioeconomic and lifestyle variables. There needs to be advocacy for proper sleep hygiene, amount, and quality.
The week on the Indian stock exchanges runs from Monday to Friday. Trading is permitted on the equity exchange from 9:00 AM to 3:30 PM.

The commodity market, however, is available from 10 AM to 11:30 PM. Occasionally, suggestions to advance market timings were made. SEBI published a discussion document outlining the advantages of extending market hours. (SEBI, 2018). The ideas were mostly abandoned, though, for operational reasons.

Participants in the financial markets have lost two hours of slumber per day over the past century. Following a weekend of daylight saving time, the markets have experienced sharp declines that are ascribed to sleep asynchronies.

Stress in Life of a Trader

Griffith, Najand, and Shen (2019) investigated small investor mood measurement in the dimensions of fear, gloom, joy, and stress to forecast market returns and market volatility. Fear significantly and persistently affects market results. Stress has a one-day lag and is observed to have a relatively smaller effect on returns.

Joy and happiness have no bearing on forecasting returns. According to studies, optimistic investors who are joyful are more likely to anticipate positive market gains. The stressful nature of stock market trading often makes the trader’s worst adversary the merchant. The trader has an advantage if they are conscious of stress level measurement technology like Ambient Intelligence.

Mental Health of a Trader

Well-documented, violent stock market shocks and crashes are discussed in research groups. Examining the connections between behavioral agreement, correlation to stock market returns, and market volatility reveals a phase transition between the indicators.
Significant coupling strength causes a rise in all three variables.


Trading participants ignore their random factors and adhere to the market trend when coupling strength is equivalent to one. A lot of studies have been done on the effects of events on stock markets, including how they affect liquidity and volatility. Economic and Financial.


stress can potentially lead to human capital loss in the form of suicide or murder-suicide. Financial trading is a job that requires careful risk management. Dynamic and unpredictable markets frequently cause trades to skip the risk management step, which can result in financial loss and, in the worst instances, suicide. Mental health studies have found a close relationship between trading risk, financial debt, and stock market failure.

For some experienced traders, trading stocks is a type of self-employment. In general, self-employment increases job and life satisfaction but may also raise mental health issues, despite the fact that the self-employed do not see it as mentally challenging.

If you liked this article, do visit our Instagram page to follow more of such content.

FOR COURSES RELATED INFORMATION, CLICK HERE

Bajaj Auto Share Price Analysis- Target Price Rs4279

Brokerage firms Antique started a buy on Arvind Smartspace, JPMorgan kept an overweight rating on Bajaj Auto, and IDBI Capital also started covering on Coforge with a buy rating.

From ETNow and other sources, we have compiled a list of the best brokerage firms’ recommendations:

On Bajaj Auto, JPMorgan says: Overweight | Target: Rs. 4400 | Upside 16%

Let us Look at the Fundamentals

Profit & Loss

Consolidated Figures in Rs. Crores / View StandalonePRODUCT SEGMENTS

Mar 2011Mar 2012Mar 2013Mar 2014Mar 2015Mar 2016Mar 2017Mar 2018Mar 2019Mar 2020Mar 2021Mar 2022TTM
Sales +16,40819,58220,02520,13721,59522,57421,75525,21030,35829,91927,74133,14535,501
Expenses +13,22915,90116,37015,97417,46717,78117,32620,36425,16024,80922,80327,88629,347
Operating Profit3,1793,6813,6564,1634,1284,7934,4294,8465,1985,1094,9385,2596,154
OPM %19%19%18%21%19%21%20%19%17%17%18%16%17%
Other Income +1,3865027906742281,1941,4681,4042,0281,8321,5702,6711,788
Interest223116111437927
Depreciation124147168181267307307315266246259270280
Profit before tax4,4384,0134,2774,6554,0835,6795,5885,9336,9566,6926,2417,6527,636
Tax %23%25%29%31%31%28%27%29%29%22%22%19%
Net Profit3,4553,0483,1333,3803,0264,0614,0794,2194,9285,2124,8576,1665,882
EPS in Rs119.39105.35108.26116.82104.56140.35140.98145.80170.29180.11167.85213.08204.41
Dividend Payout %34%43%42%43%48%39%39%41%35%67%83%66%
Compounded Sales Growth
10 Years:5%
5 Years:9%
3 Years:3%
TTM:5%
Compounded Profit Growth
10 Years:6%
5 Years:6%
3 Years:5%
TTM:-2%
Stock Price CAGR
10 Years:9%
5 Years:7%
3 Years:25%
1 Year:6%
Return on Equity
10 Years:25%
5 Years:21%
3 Years:21%
Last Year:19%

Balance Sheet

Consolidated Figures in Rs. Crores / View StandaloneCORPORATE ACTIONS

Mar 2011Mar 2012Mar 2013Mar 2014Mar 2015Mar 2016Mar 2017Mar 2018Mar 2019Mar 2020Mar 2021Mar 2022Sep 2022
Share Capital +289289289289289289289289289289289289284
Reserves4,5185,7927,7769,87810,80613,73117,56720,13622,94421,37326,98429,57025,753
Borrowings +34715011659112118120121125126121123124
Other Liabilities +3,9944,8944,4615,0814,7583,1023,6614,5955,4764,7226,2075,1296,356
Total Liabilities9,14911,12612,64215,30815,96617,24021,63825,14128,83426,51033,60235,11132,516
Fixed Assets +1,8551,9202,3552,6602,4482,0262,0021,8781,7641,6991,6681,8361,787
CWIP704229414425552425648601677222
Investments4,2114,4736,0598,4488,98511,06715,47718,89520,60319,91424,68726,63422,786
Other Assets +3,0134,6923,9344,0564,2774,0954,1174,3126,4204,8377,2326,5647,721
Total Assets9,14911,12612,64215,30815,96617,24021,63825,14128,83426,51033,60235,11132,516

PVR Share Price Analysis- Target Price

Most brokerage houses stay optimistic about the stock in light of the combined PVR-INOX, which has a share of 43% in multiplex screens and 50%+ in multiplex box office, an improving slate of Hindi films, and a solid pipeline for the entire film industry in FY24. Following the company’s first investor conference following the merger, shares of PVR rose as much as 3% during the day, reaching $1,574.95 per share. On Wednesday, the price increased by 0.94 percent to $1,542.05 per share.

Let us look at the Fundamentals

Profit & Loss

Consolidated Figures in Rs. Crores / View StandalonePRODUCT SEGMENTS

Mar 2011Mar 2012Mar 2013Mar 2014Mar 2015Mar 2016Mar 2017Mar 2018Mar 2019Mar 2020Mar 2021Mar 2022TTM
Sales +4595188061,3481,4771,8502,1192,3343,0863,4142801,3313,146
Expenses +3704416881,1331,2711,5511,7991,9332,4992,3386161,2252,262
Operating Profit90761192152062993204015871,076-336106884
OPM %20%15%15%16%14%16%15%17%19%32%-120%8%28%
Other Income +101061124552303238469326100
Interest1618378078848184128482498498508
Depreciation67365694117115138154191542575614626
Profit before tax163132521214515319429990-939-681-150
Tax %98%18%-39%4%7%32%37%36%37%70%20%28%
Net Profit025445012999612418927-748-489-108
EPS in Rs2.809.0810.4712.712.8619.5819.0824.8437.814.95-123.07-80.04-17.56
Dividend Payout %33%61%9%18%33%10%10%8%5%75%0%0%
Compounded Sales Growth
10 Years:10%
5 Years:-9%
3 Years:-24%
TTM:223%
Compounded Profit Growth
10 Years:%
5 Years:%
3 Years:%
TTM:84%
Stock Price CAGR
10 Years:18%
5 Years:4%
3 Years:15%
1 Year:-21%
Return on Equity
10 Years:-6%
5 Years:-13%
3 Years:-26%
Last Year:-32%

Balance Sheet

Consolidated Figures in Rs. Crores / View StandaloneCORPORATE ACTIONS

Mar 2011Mar 2012Mar 2013Mar 2014Mar 2015Mar 2016Mar 2017Mar 2018Mar 2019Mar 2020Mar 2021Mar 2022Sep 2022
Share Capital +27264041424747474751616161
Reserves3142576033583688359181,0291,4491,4291,7731,3091,318
Borrowings +1622036576137476608208311,2825,0665,0035,1965,291
Other Liabilities +1531262873402733564404421,062881665757646
Total Liabilities6566131,5861,3521,4291,8972,2252,3483,8407,4287,5027,3237,316
Fixed Assets +3682739968208601,0001,5091,5902,7425,8865,4755,4075,360
CWIP5888145107807610610222115521764104
Investments11382422221112100
Other Assets +2302524074024868206096368661,3851,8081,8511,852
Total Assets6566131,5861,3521,4291,8972,2252,3483,8407,4287,5027,3237,316

Borosil Renewables Share- Should You Buy?

Updates on the cold maintenance of the furnace at GMB Glasmanufaktur Brandenburg GmbH from Stock Report Borosil Renewables Ltd. sharing icon for Facebook Twitter sharing icon for sharing Twitter sharing icon on Pinterest Share this icon can be pinned. WhatsApp sharing icon for sharing Email sending button for sharing Updates on the cold maintenance of the furnace at GMB Glasmanufaktur Brandenburg GmbH from Borosil Renewables Ltd. There was a glass leakage incident from GMB’s furnace on July 31, 2022, prior to the purchase of a majority stake of 86% (through wholly owned subsidiaries) in GMB Glasmanufaktur Brandenburg GmbH (GMB) and Interfloat Corporation (Interfloat) in October 2022. GMB runs its manufacturing plant in Tschernitz, Germany, with a single furnace that can produce 300 tonnes per day (TPD).

Let us look at the Fundamentals

Profit & Loss

Standalone Figures in Rs. Crores / View Consolidated

Mar 2011Mar 2012Mar 2013Mar 2014Mar 2015Mar 2016Mar 2017Mar 2018Mar 2019Mar 2020Mar 2021Mar 2022TTM
Sales +118126134156175222267296217271502644680
Expenses +898127131146168212248255182234305399497
Operating Profit-780-13971019413437197245183
OPM %-664%-1%2%6%4%5%7%14%16%14%39%38%27%
Other Income +1,58242253662111263530352018
Interest2000011007834
Depreciation112455651832424243
Profit before tax799402642641513870461153220155
Tax %19%20%24%11%23%-4%8%34%-0%64%41%25%
Net Profit64833203749161274646090166123
EPS in Rs40.492.621.653.104.101.6913.775.025.010.046.8912.729.45
Dividend Payout %2%14%23%16%15%37%5%12%13%0%0%0%
Compounded Sales Growth
10 Years:18%
5 Years:19%
3 Years:44%
TTM:3%
Compounded Profit Growth
10 Years:23%
5 Years:32%
3 Years:53%
TTM:-34%
Stock Price CAGR
10 Years:58%
5 Years:48%
3 Years:132%
1 Year:-31%
Return on Equity
10 Years:8%
5 Years:12%
3 Years:17%
Last Year:24%

Balance Sheet

Standalone Figures in Rs. Crores / View ConsolidatedCORPORATE ACTIONS

Mar 2011Mar 2012Mar 2013Mar 2014Mar 2015Mar 2016Mar 2017Mar 2018Mar 2019Mar 2020Mar 2021Mar 2022Sep 2022
Share Capital +43333222911131313
Reserves663621624654694634769819323315602772828
Borrowings +002123300429279157213
Other Liabilities +3036303350374165517589113137
Total Liabilities6966596596917507058138874254947831,0551,192
Fixed Assets +83480173156158109108117345320278262
CWIP347146655412514297600
Investments49642540938044538045450946728021424
Other Assets +189153155132143162245266138141178267305
Total Assets6966596596917507058138874254947831,0551,192

KPIT Share Price Analysis-

Shares of KPIT Technologies tumbled over 17% to Rs 760 in Monday’s trade on BSE after the global brokerage firm JPMorgan initiated coverage on the stock with an underweight rating and a target price of Rs 520, a potential downside of 44% from Friday’s closing price of Rs 925.

JPMorgan’s target for the stock is driven by lower structural margins, risks from single vertical and high client concentration, and excessive valuations, according to media reports.The average price estimate for the stock, according to Trendlyne data, is Rs 786, down 15% from Friday’s closing price of Rs 925. KPIT Technologies’s average rating from 11 analysts is a hold. Of these experts, three have strong sell and sell ratings, three have strong buy and buy ratings, and one has a hold rating. Seven analysts have strong buy and buy ratings. At 2.49 a.m., the stock was trading 14.4% lower than its previous day’s ending price of 925 rupees per share, at Rs. 792. On the other hand..

Let us look at the Fundamentals

Profit & Loss

Consolidated Figures in Rs. Crores / View StandaloneGEOGRAPHICAL SEGMENTS

Mar 2018Mar 2019Mar 2020Mar 2021Mar 2022TTM
Sales +06412,1562,0362,4322,999
Expenses +05501,8661,7291,9942,440
Operating Profit-092290307439560
OPM %14%13%15%18%19%
Other Income +0119214562
Interest0720171929
Depreciation019108133120135
Profit before tax-067181178345458
Tax %0%18%18%17%20%
Net Profit-055148147276356
EPS in Rs-27.001.985.385.3310.0012.72
Dividend Payout %0%37%18%28%31%
Compounded Sales Growth
10 Years:%
5 Years:%
3 Years:56%
TTM:29%
Compounded Profit Growth
10 Years:%
5 Years:%
3 Years:50%
TTM:41%
Stock Price CAGR
10 Years:%
5 Years:%
3 Years:178%
1 Year:33%
Return on Equity
10 Years:%
5 Years:%
3 Years:17%
Last Year:21%

Balance Sheet

Consolidated Figures in Rs. Crores / View StandaloneCORPORATE ACTIONS

Mar 2018Mar 2019Mar 2020Mar 2021Mar 2022Sep 2022
Share Capital +0268269269270270
Reserves-06917809381,0401,122
Borrowings +0132204230227186
Other Liabilities +0582384531799862
Total Liabilities01,6741,6371,9682,3362,441
Fixed Assets +0420526577641678
CWIP0151202
Investments0509127129128
Other Assets +01,2041,0961,2511,5661,633
Total Assets01,6741,6371,9682,3362,441

Cash Flows

Consolidated Figures in Rs. Crores / View Standalone

Mar 2018Mar 2019Mar 2020Mar 2021Mar 2022
Cash from Operating Activity +-0151389628475
Cash from Investing Activity +016-136-503-292
Cash from Financing Activity +034-177-115-127
Net Cash Flow0201751056

Bodal Chemical Share Price Analysis-Is it a risky investment?

As you can see Bodal Chemicals is currently trading at Rs 57.70 but our experts suggest to wait till it goes above 60 and for the downside one can take position at Rs41.50.

The latest balance sheet data shows that Bodal Chemicals had liabilities of ₹8.04b due within a year, and liabilities of ₹2.66b falling due after that. On the other hand, it had cash of ₹151.5m and ₹5.95b worth of receivables due within a year. So its liabilities outweigh the sum of its cash and (near-term) receivables by ₹4.59b.

Bodal Chemicals has a market capitalization of ₹11.7b, so it could very likely raise cash to ameliorate its balance sheet, if the need arose. But it’s clear that we should definitely closely examine whether it can manage its debt without dilution.

Let us look at the Fundamentals

Profit & Loss

Consolidated Figures in Rs. Crores / View Standalone

Mar 2011Mar 2012Mar 2013Mar 2014Mar 2015Mar 2016Mar 2017Mar 2018Mar 2019Mar 2020Mar 2021Mar 2022TTM
Sales +5736145279601,0439081,2331,1421,4241,3751,2262,0511,768
Expenses +5126105087708597581,0079461,1871,2371,1401,8311,608
Operating Profit6142018918415022619623613887220160
OPM %11%1%4%20%18%16%18%17%17%10%7%11%9%
Other Income +164-70519158131016-110
Interest23354047271295919172936
Depreciation14161625222629122128304750
Profit before tax25-41-33471391312041862191015514284
Tax %33%27%30%35%34%34%35%33%35%15%28%31%
Net Profit17-30-2330928613312214186409964
EPS in Rs1.67-2.73-2.122.768.417.8812.1810.0311.727.123.438.795.50
Dividend Payout %32%0%0%0%0%8%7%8%7%11%23%9%
Compounded Sales Growth
10 Years:13%
5 Years:11%
3 Years:13%
TTM:-6%
Compounded Profit Growth
10 Years:18%
5 Years:-4%
3 Years:-8%
TTM:-38%
Stock Price CAGR
10 Years:26%
5 Years:-16%
3 Years:11%
1 Year:-47%
Return on Equity
10 Years:17%
5 Years:12%
3 Years:8%
Last Year:11%

Balance Sheet

Consolidated Figures in Rs. Crores / View StandaloneCORPORATE ACTIONS

Mar 2011Mar 2012Mar 2013Mar 2014Mar 2015Mar 2016Mar 2017Mar 2018Mar 2019Mar 2020Mar 2021Mar 2022Sep 2022
Share Capital +20223747472222242524242425
Reserves483613431352133416738059079571,0311,049
Borrowings +259345348372209143151181171257454676644
Other Liabilities +22217290156169132193194290267314382357
Total Liabilities5495754735935345107071,0721,2901,4551,7492,1132,074
Fixed Assets +272279265168190192222437609656804817803
CWIP1209309192671470274
Investments101122171763600
Other Assets +2752942074153393164595996507899241,227997
Total Assets5495754735935345107071,0721,2901,4551,7492,1132,074

Nifty Pharma Sector Analysis-Heading towards 12600

In a bullish market on Friday, the Nifty Pharma index moved in the green around 11:16AM (IST).

Among the top gainers were Granules India (up 5.43%), Glenmark Pharmaceuticals (up 4.43%), Ipca Laboratories (up 2.42%), Glaxosmithkline Pharmaceuticals (up 2.37%), and Sanofi India (up 2.31%).
The biggest losers on the index were Lupin (down 1.33%), Sun Pharmaceutical Industries (down 0.67%), Pfizer (down 0.46%), Gland Pharma (down 0.41%), and Zydus Lifesciences (down 0.22%).

At the time this story was being written, the Nifty Pharma index was up 0.55 percent, standing at 12008.6.

The BSE Sensex increased by 591.23 points to 58551.32, while the benchmark NSE Nifty50 indicator increased by 162.65 points to 17243.35.

Following Covid, analysts noted that the pace of US FDA inspections has once more accelerated and that they have observed a rise in incidents with 483 observations and unfavourable outcomes.