The Nifty50 is likely to stay in the region of 18,000 to 18,200 in the near future, according to Rupak De of LKP Securities. He suggested that the index may climb towards 18,500 with a strong advance above 18,200.

After a one-way 600-point run from 17,550 to 18,150, the Nifty50 dipped for the first time in seven straight sessions, but concluded with modest gains on May 3.
Technology, metal, oil & gas, and a few equities in the banking & financial services industry have all experienced corrections.
- As a result of session-long volatility, the index, which had started the day at 18,114, was controlled by bears. On the daily charts, a bearish candle with a lower shadow was formed as it closed at 18,090, down 58 points.
- After a six-day rally and in anticipation of the outcome of the Federal Reserve’s two-day meeting tonight, the profit taking and cautious trading followed the predicted patterns.
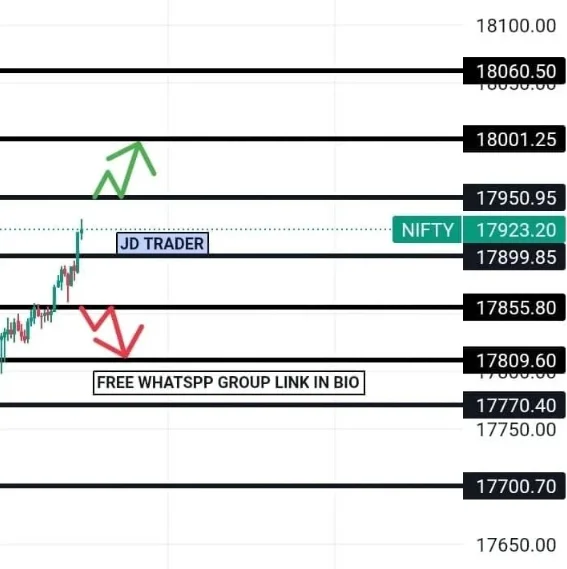
- The psychological 18,000-mark is anticipated to act as a crucial area for further direction, so if it breaks that level, then 17,900-17,800 can be possible levels on the downside, whereas on the other side, 18,200-18,500 zone on the higher side can be seen, experts said. Given the trend, this is just a normal retreat.
After a cautious beginning as investors awaited the Fed’s rate announcement, the Nifty remained largely rangebound. A little candle with a red body has formed on the daily chart. As long as the index continues over 18,000, sentiment will remain optimistic, according to Rupak De, Senior Technical Analyst at LKP Securities.
He believes that the index will likely stay in the 18,000–18,200 region in the near future.
Prior to weekly expiry, the Nifty50 saw maximum Call open interest at the 18,200 strike, which is anticipated to be a significant hurdle moving forward. This was followed by strikes between 18,100 and 18,300, with notable Call writing at 18,100 and 18,200 strikes.
- The 18,000 strike, which is likely to provide immediate support for the index, had the highest open interest on the put side, followed by the 17,900 and 17,800 strikes.
- “The open interest (OI) statistics for both the indices (Nifty50 and Bank Nifty) going into tomorrow’s expiry are mixed, with the Nifty OI data showing more Call open interest and the Bank Nifty OI data showing more Put writing.
- From 17,850 to 17,500 odd levels, there is strong demand for the Nifty index.
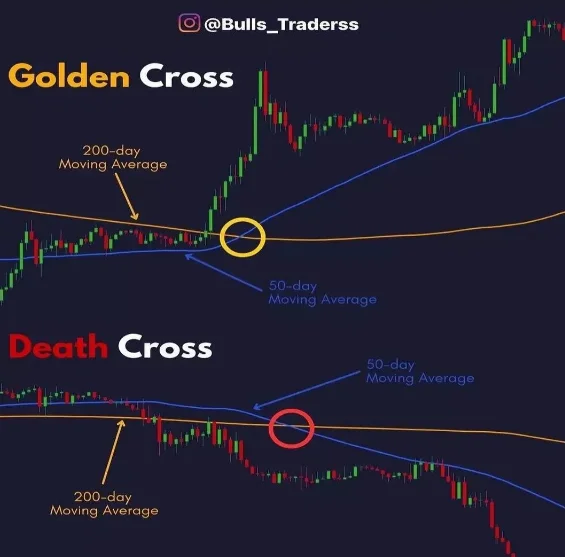
On a daily basis, the index has developed a respectable bullish candlestick pattern, and the momentum indicator MACD (moving average convergence divergence) has shown a great positive crossover, indicating that the trend is continuing upward even though there has been a little correction today.
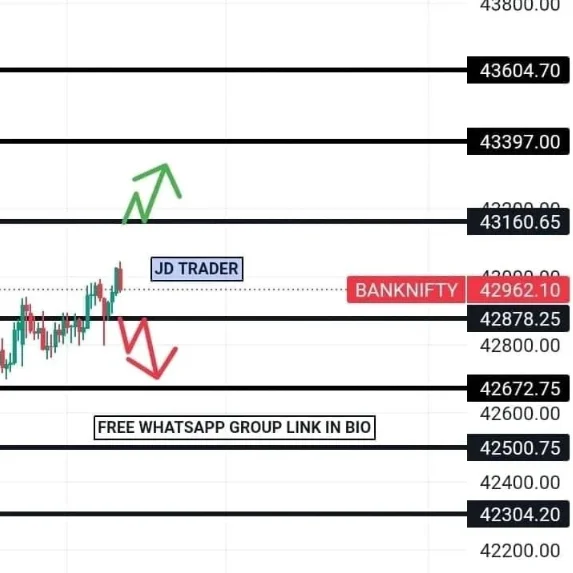
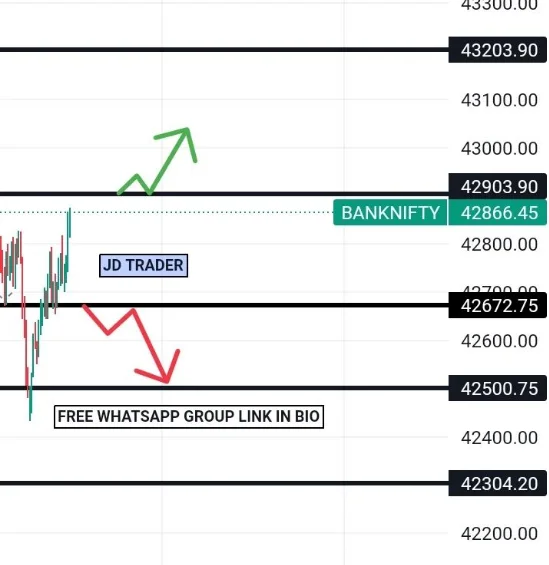
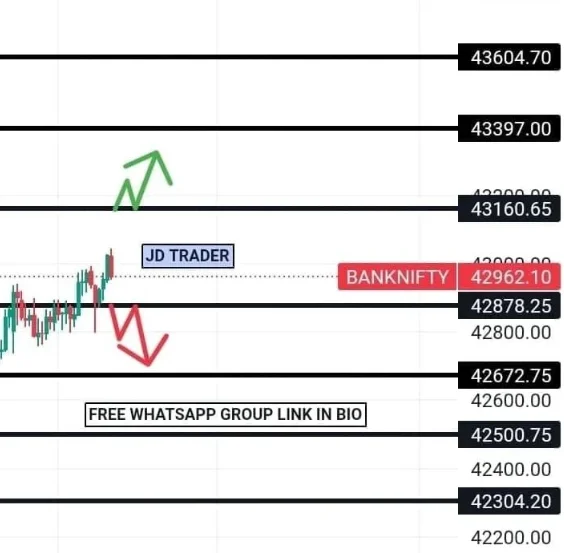
“At 43,150, immediate support is apparent. A move above 43,500, though, might spark a surge towards 44,000, he continued.