Learning sharks-Share Market Institute


Rajouri Garden  8595071711 7982037049  Noida 8920210950 , and  Paschim Vihar  7827445731  

Fee revision notice effective 1st April 2025; No change for students enrolled before 15th May 2025

Download “Key features of Budget 2024-2025here

What is SL in stock market?

SL (Stop Loss)

Typically, “SL” in the stock market refers to “Stop Loss.” A stop loss is an order made by a trader or investor to sell a stock at a certain price, so limiting potential losses on a position. The order is activated when the stock price reaches or drops below the specified stop price, and the stock is automatically sold to stop additional losses. Stop Loss orders are a risk management strategy that investors employ to safeguard their stock market investments.

  • Stop Loss: “SL” is frequently used to refer to “Stop Loss.” An order to purchase or sell a stock when it reaches a specific price is known as a stop loss order. To reduce their potential losses on a stock position, traders and investors employ it. The order is activated when the stock price reaches or drops below the specified stop price, and the stock is then sold (in the case of a stop-loss sell order) to stop additional losses.
  • Stock Symbol: “SL” may also serve as an acronym for a specific company’s stock symbol. Stock symbols are abbreviations or characters that are used only on stock markets to identify publicly traded corporations. Depending on the exchange and timeframe, “SL” might, for instance, stand in for the stock symbol for a corporation like Schlumberger Limited or Standard Life Aberdeen plc.
  • Singapore Exchange: “SL” could be a reference to the Singapore Exchange. A stock exchange where a variety of financial items, including stocks, are traded is this one. On the Singapore Exchange, stock symbols frequently end in “.SI.”

You would need to take into account the context in which it is used—or supply more information for clarification—to ascertain the precise meaning of “SL” in the stock market.

How SL work in stock market

In the stock market, a stop loss (SL) order is a risk management strategy used to reduce potential losses on a stock position. This is how it goes:

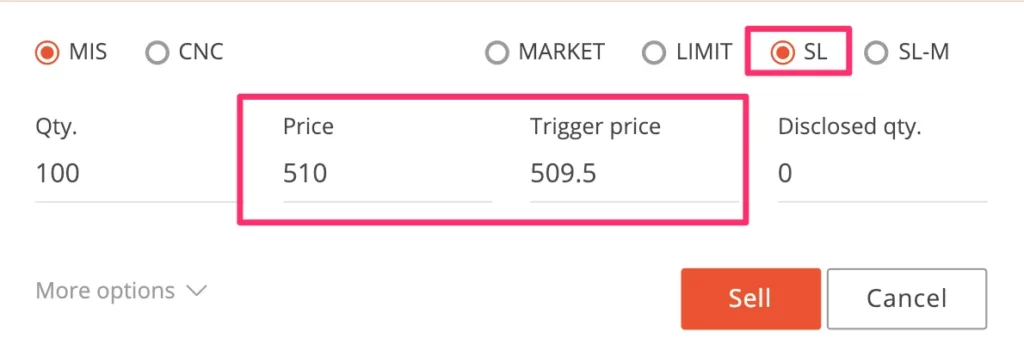
  1. Placing the Order: You may also place a Stop Loss order when you purchase a stock. In the event that the stock price swings against you, this order indicates a price at which you are prepared to sell it.
  2. Monitoring the Stock: After placing your Stop Loss order, you must keep an eye on the stock’s price. The Stop Loss order is activated if the stock’s price falls to or below your stop price.
  3. Order execution: When the Stop Loss order is activated, it transforms into a market order and will be carried out at the following market price. Because market prices might change, it’s possible that your order will be filled slightly above or below the stop price you chose.
  4. Flexibility: Prior to being activated, Stop Loss orders can be changed or cancelled at any moment. This enables you to modify your risk management plan or adjust to shifting market conditions.

Advantages and Disadvantages

Advantages

  • Risk control: Risk control is the main benefit of employing Stop Loss orders. They aid in limiting possible losses on a stock position and help you avoid suffering losses that are more than what you can bear.
  • Stop Loss orders: can aid traders and investors in exercising emotional restraint and preventing impulsive, emotional judgements. The temptation to stick onto a losing position in the hopes that it would turn around is diminished when one is aware that there is a fixed exit point.
  • Peace of Mind: Investors who use stop loss orders benefit from peace of mind since they know they have a plan in place to protect their money. This might lessen the tension and anxiety that come with stock market investing.
  • Automation: When the stop price is reached, Stop Loss orders, once issued, are automatically carried out. This is practical and guarantees that the order is filled even if you aren’t watching the market closely.

Disadvantages

  • Whipsawing: One significant disadvantage is the potential for whipsawing, which happens when a stock’s price briefly goes below the stop price and activates the order before quickly rising again. When the market quickly rebounds as a result, this may lead to selling at a loss.
  • Market Gaps: Stocks may exhibit price gaps, where the stock begins at a significantly different price than its prior close, in extremely volatile markets or following big news events. In such circumstances, stop loss orders might not be carried out at the targeted stop price.
  • Overconfidence: Putting too much faith in Stop Loss orders alone can make you feel insecure. Not all risks, such as overnight gaps or extreme market events, are covered by them.
  • Tight Stops: Using very close stop prices while setting stop loss orders might cause frequent order triggering owing to minute price changes, incurring exorbitant trading costs.
  • Missed Opportunities: Placing Stop Loss orders too close to the market price could cause a position to be prematurely closed out before it has had a chance to rebound. This may result in lost chances to gain possible benefits.
  • The use of stop loss orders: does not ensure that you will sell at the desired price, so keep this in mind. They become market orders after being activated and are carried out at the current market price, which may differ from the stop price.

Conclusion

In summary, stop loss orders are useful instruments for managing risk in the stock market, but they can have drawbacks. It’s crucial for traders and investors to use them wisely while taking into account their unique risk tolerance, market conditions, and the particular equities they are trading. Additionally, rather than serving as the only method of risk management, stop loss orders should be a part of a larger trading or investment plan.

FOR MORE INFO CLICK THIS SITE:https://learningsharks.in/

FOLLOW OUR PAGE:https://www.instagram.com/learningsharks/?hl=en

What is LMT in trading?

In trading, “LMT” frequently refers for “Limit Order.” When a trader wants to purchase or sell a securities at a certain price or higher, they submit a limit order to their broker. You can specify a specific price at which you are willing to buy or sell an asset when you utilise a limit order. The Limit Order is carried out if the market does reach or surpass the price you selected. If not, the order can be kept on hold until the market conditions match the price you indicated.

For instance, if you place a limit order to buy a stock at Rs.50, it won’t be filled until the market price reaches Rs.50 or drops below it. Your order will remain open until the conditions are satisfied or you cancel it even if the market price never hits Rs.50.

For traders who prefer to enter or exit positions at particular price levels rather than at the current market price, limit orders might be advantageous. The execution price can be somewhat controlled by them, but there is no assurance that the order will be completed if the market doesn’t reach the desired price.

LMT

How it works in Trading?

A Limit Order in trading is a particular kind of order that enables traders to buy or sell a financial asset at a defined price or a higher one (commonly abbreviated as “LMT”). This is how it goes:

The price at which you intend to buy or sell an asset is specified when a Limit Order is placed. As an illustration, you might establish a Limit Buy Order with a price of Rs.50 per share if you’re purchasing shares.

  • Market Situation: The order is open until the price is reached or exceeded by the market. If you place a limit buy order, it won’t be filled unless the market price falls to that level or less. If you place a limit sell order, it won’t go through unless the market price reaches that level or greater.
  • Execution: The Limit Order is triggered and carried out once the market price equals or exceeds the price you selected. The order doesn’t execute if the market never hits the price you set, thus it stays pending.
  • Partial Fills: A Limit Order may occasionally be partially completed. This happens when the market momentarily touches your chosen price, partially fills your order, and then drifts away from it. Until the market conditions are once more met, the remaining portion of your order can remain pending.

For traders, limit orders are useful for a number of reasons:

  • Price Control: The ability to precisely regulate the price at which you want to buy or sell an asset is provided by them.
  • Avoiding Unintended Trades:Limit orders help you avoid unintended trades by preventing them from being completed at prices that are vastly different from the level you planned. This can happen with Market Orders (where the trade is executed at the current market price).
  • Strategy Implementation: Limit Orders can be used by traders to carry out particular trading strategies, such as purchasing on dips or selling at resistance levels.

It’s crucial to remember that there is no assurance that a Limit Order will be carried out. Orders may not be filled if the market never reaches the price you selected. Market conditions, liquidity, and price volatility can all have an impact on how likely it is that an order will be executed. Based on their trading objectives and the state of the market, traders should carefully assess their techniques and order types.

Advantages and Disadvantages

Advantages

  1. Price regulate: The ability to precisely regulate the price at which traders buy or sell an asset is one of the main benefits of limit orders. This is especially helpful if you have a particular entry or exit point in mind.
  2. Avoid Slippage:Limit orders assist traders in preventing slippage, which happens when a trade is executed at a different price than anticipated. Because they are executed at the current market price, which is subject to quick change, market orders are more likely to have slippage.
  3. Trading strategically: Limit orders give traders the ability to put certain trading tactics into practise, such as purchasing on price reversals or selling at specified resistance levels. For traders who use technical analysis to locate important support, they are useful tools.
  4. Patience:Patience is needed when using limit orders because they don’t go into effect until the market reaches the desired price. As a result, impulsive trading and emotional decision-making may be avoided.

Disadvantages

  • No Guaranteed Execution:The fundamental disadvantage of Limit Orders is that there is no assurance that they will be executed. Your order is not filled if the market never reaches or exceeds the price you set. This can lead to lost trade chances.
  • Timing Risk: The market’s conditions might quickly change, and it’s possible that it won’t reach your target price before turning against you. Due to this timing risk, deals may be missed or executed in a less favourable way.
  • Partial Fills:Limit Orders may only be partially filled in choppy markets, leaving parts of your order unfulfilled. This may necessitate you manually adjusting your position, complicating your trading technique.
  • Market Gaps: Your Limit Order might not be executed at the anticipated price if the market suffers a substantial price gap as a result of news events or other circumstances. When trade continues, it can instead be filled at a less advantageous level.
  • Increased Costs: Limit orders may come with additional fees or wider spreads than Market Orders, which might raise the overall cost of your transactions, depending on your brokerage.

Conclusion

In conclusion, there are benefits and drawbacks to using limit orders in trading. They help traders avoid slippage and enable the execution of particular trading strategies by giving them exact control over the price at which they want to purchase or sell an asset. They also promote restraint and patience when trading.

The lack of guaranteed execution is Limit Orders’ fundamental flaw, though. The order remains pending if the market does not reach or exceed the set price, which could result in lost trading chances. Additional factors to take into account include partial fills, timing concerns, and the potential for orders to be filled at less advantageous prices during market gaps.

FOR MORE INFO CLICK THIS SITE:https://learningsharks.in/

FOLLOW OUR PAGE:https://www.instagram.com/learningsharks/?hl=en

What is the most powerful Forex indicator?

Since an indicator’s performance is influenced by a number of variables, including market conditions, trading technique, and personal preferences, there is no single “most powerful” Forex indicator. Forex traders employ a variety of indicators to aid in their analysis of the currency markets and decision-making. Several of the common indicators are:

Forex Traders
  • Moving Averages: Simple Moving Averages (SMA) and Exponential Moving Averages (EMA) are two types of moving averages that are frequently used to spot trends and possible entry or exit locations.
  • Relative Strength Index (RSI): RSI can be used by traders to spot probable reversals by determining whether an asset is overbought or oversold.
  • Moving Average Convergence Divergence (MACD): Moving Average Convergence Divergence (MACD) is a tool for spotting momentum shifts and potential trend reversals.
  • Bollinger Bands: A middle band (SMA) and upper and lower bands that stand in for standard deviations make up a Bollinger Band. They can be used to spot price reversals and volatility.
  • Fibonacci Retracement: Based on important Fibonacci ratios, Fibonacci retracement levels are utilised to determine probable support and resistance levels.
  • Stochastic Oscillator: The stochastic oscillator aids traders in spotting overbought and oversold levels as well as possible reversals.
  • Ichimoku Cloud: This indicator, known as the Ichimoku Cloud, offers a thorough analysis of support and resistance levels, trend direction, and momentum.
  • Parabolic SAR: The parabolic SAR method aids traders in spotting probable trend reversals.
  • Volume Indicators: Volume indicators can assist traders in determining the strength of a trend or potential reversals. One such indicator is On-Balance Volume (OBV).
  • Williams%R: Williams%R, like the RSI, aids in determining overbought and oversold levels.

FOR MORE INFO CLICK THIS SITE:https://learningsharks.in/

FOLLOW OUR PAGE:https://www.instagram.com/learningsharks/?hl=en

What are EV stocks in India?

EV stocks

“EV stocks” in India refer to stocks of companies that are active in the electric vehicle (EV) industry as of my most recent information update in September 2021. Electric vehicles are becoming more and more popular around the world as a more energy- and environmentally-friendly form of transportation. Investors with an interest in this industry might think about purchasing their stocks given that multiple companies have entered the EV market in India.

Several well-known Indian businesses active in the electric vehicle sector include:

  • Tata Motors: Tata Motors is a market player in the EV space and has launched electric vehicles under the “Tata Electric” brand.
  • Mahindra & Mahindra: With its electric models like the e2o and e-Verito, Mahindra has been a key player in the electric vehicle category.
  • Hero MotoCorp: Hero Electric, a division of Hero MotoCorp, is a significant player in the market for electric two-wheelers.
  • Bajaj Auto:With the Chetak Electric scooter, Bajaj Auto has joined the market for electric scooters.
  • Ather Energy: is a firm that specialises in electric scooters and has drawn notice for its cutting-edge technology and designs.
  • Ola Electric: A division of the ride-hailing startup Ola, Ola Electric seeks to manufacture electric two-wheelers.
  • Revolt Motors: Known for its electric motorcycles, Revolt Motors has also developed cutting-edge subscription-based pricing schemes.

Please be aware that the electric vehicle market is fast developing and that after my September 2021 update, the environment may have altered. Before making investment decisions, it’s critical to carry out in-depth study and take the most recent advancements and financial performance of these organisations into account. Investors interested in EV stocks in India may also benefit from speaking with a financial advisor or keeping an eye on the most recent information and trends in the Indian EV sector.

FOR MORE INFO CLICK THIS SITE:https://learningsharks.in/

FOLLOW OUR PAGE:https://www.instagram.com/learningsharks/?hl=en

What is meant by “Underlying Index” in Stocks?

The term “underlying index” is used in the context of equities and financial markets to describe a benchmark or reference index that forms the foundation for a number of financial products, including exchange-traded funds (ETFs), index funds, and derivatives. The underlying index serves as a performance indicator or the foundation for investment products, and it reflects a certain collection of stocks or other assets.

underlying index

This is how it goes:

  • Selection of Stocks: An underlying index often consists of a number of stocks or other assets that satisfy specific requirements. These requirements could be based on variables like market capitalisation, industry, location, or particular guidelines established by the index provider.
  • Weighting: Stocks included in the underlying index are frequently weighted using different approaches. Market capitalization weighting (bigger companies have a stronger influence) and equal weighting (all companies have an equal influence) are two common weighting techniques.
  • Benchmark for Performance: The underlying index acts as a standard against which the performance of the stocks or other assets it represents is measured. This benchmark is used by investors and fund managers to compare the performance of their assets to the overall market or a particular market segment.
  • Investment Products: To duplicate the performance of the underlying index, financial instruments like ETFs and index mutual funds are used. By owning a portfolio of identical stocks in the same ratios as the index, these investment products seek to replicate the performance of the index.

The S&P 500, for instance, is a well-known underlying index that gauges the performance of 500 of the biggest American publicly traded firms. Many financial instruments, like S&P 500 index funds and ETFs, are designed to mimic the performance of the underlying index.

In conclusion, the underlying index is an important part of the financial markets and investing worlds, acting as a benchmark for gauging performance and the foundation for a number of investment products.

How does it work in Stock Market?

The idea of a “underlying index” is crucial in the stock market in a number of ways, most importantly as a standard for evaluating the performance of stocks and as the foundation for investment products. Here is how the stock market operates:

  • Performance Evaluation: An underlying index, such as the Dow Jones Industrial Average or the S&P 500, reflects a particular collection of equities. Usually, these stocks are chosen in accordance with predetermined criteria, such as market capitalization, industry, or other elements. The performance of this index acts as a benchmark for assessing how a specific market sector or the entire market is performing.
  • Benchmark for Investment Performance: To evaluate the performance of their investment portfolios, fund managers and investors frequently utilise the underlying indices as benchmarks. To determine how well your assets are performing in comparison to the overall market, you can compare the returns of your stock portfolio or investment fund to those of the applicable underlying index.
  • Building Investment Products: The underlying index is also used to build exchange-traded funds (ETFs) and index mutual funds, among other financial products. By owning a portfolio of the same companies, often in the same proportions as the index, these investment vehicles seek to mimic the performance of the index. Instead of buying each stock that makes up the index individually, investors can purchase shares of these funds to gain exposure to the underlying index.
  • An S&P 500 ETF, as an illustration, would invest in the identical 500 stocks that make up the S&P 500 index. As a result, if you invest in this ETF, your returns ought to closely track the S&P 500’s performance.
  • Trading and derivatives: Some investors base their trading plans and derivatives contracts on the underlying indices. For example, it is possible to relate the performance of certain indices to options and futures contracts. Trading allows for hedging and risk management techniques as traders can speculate on the potential direction of an index’s value.
  • Market Sentiment and Analysis: Analysis of the market’s emotions and trends is frequently based on the performance of the underlying indices, according to analysts and observers. It can be an indication of market optimism or pessimism and may affect investor behaviour if an index suffers big gains or losses.

Advantages and Disadvantages

Advantages

  1. Diversification: Buying index- or index-based goods gives you access to a wide range of markets. Because you are relying on the performance of a group of stocks rather than just one, diversification helps disperse risk.
  2. Benchmark for Performance: Underlying indices offer a standard against which investment portfolio performance can be measured. How well investors and fund managers are performing in comparison to the whole market can be determined.
  3. Index-based ETFs and mutual funds: often have high levels of liquidity, making it simple to acquire and sell shares at market rates. Investors that need to enter or leave positions rapidly may benefit from this liquidity.
  4. Low Costs: Since actively managed funds must constantly choose and research stocks, many index-based investing products have cheaper management fees.
  5. Transparency: Most underlying indexes’ composition and methodology are made available to the public, making it simpler for investors to understand what they are investing in.
  6. Index-based investment:is a type of passive investing that some investors prefer because of its simplicity and long-term orientation.

Disadvantages

  1. Lack of Active Management: Although index funds strive to match the index’s performance, they do not use active management techniques to exceed the market. This means that if particular index stocks perform exceptionally well, you can lose out on chances to earn bigger profits.
  2. Inclusion of Underperformers: Indices include all stocks that satisfy certain requirements, including underperformers. This implies that you are funding both the index’s winners and losers.
  3. Market Bubbles and collapses: When you invest in an index, you are exposed to the entire market, including any potential bubbles or collapses. During market downturns, this may result in large losses.
  4. Limited Customization: Options for customising investments based on indexes are scarce. It could be difficult to modify your portfolio to suit your needs if you have particular investment goals or preferences.
  5. Tracking Error: Index funds and ETFs may incur tracking errors despite their goal of replicating the index. This means that their returns may differ somewhat from the performance of the index as a whole because of things like fees and trading costs.
  6. Lack of Individual Stock Control: Index-based investments do not give investors the individual stock allocation and selection freedom they desire.

Conclusion

In conclusion, stock market underlying indices provide useful performance benchmarks and provide the foundation for a variety of investment products. These indexes are favoured by many investors because they provide benefits like diversification, affordability, and transparency. They do, however, have some limitations, including as limited control over choosing specific stocks and vulnerability to market downturns.

Your financial objectives, risk tolerance, and investment preferences should all be taken into consideration when deciding whether to use underlying indices in your investment plan. Making informed financial decisions that meet your requirements and aspirations requires careful analysis of both the benefits and drawbacks.

FOR MORE INFO CLICK THIS SITE:https://learningsharks.in/

FOLLOW OUR PAGE:https://www.instagram.com/learningsharks/?hl=en

Forex WhatsApp Group Link for October-2023

  • This is the place to look for Forex WhatsApp groups.
  • Are you an investor? If so, you may find the list of these WhatsApp groups for forex to be quite useful.
  • For those who are unfamiliar, forex trading essentially deals with foreign exchange. It entails exchanging money for purposes of trade, tourism, or business.
  • Trading forex has grown to be highly popular in recent years. However, trading currencies carries a high level of danger, therefore it’s critical to keep up with the most recent developments in the trading industry.
  • These carefully chosen forex WhatsApp groups will be very helpful to you while you engage in trading. It will keep you informed on all current events and offer advice on how to become a pro in it.

10+ Forex WhatsApp Group Link (Updated 2023)

Forex trading(Recommended)Join Now
Forex free signals Join Now
Free forex signalJoin Now
LYK FOREX ACADEMYJoin Now
Forex Hesit ‍Join Now
99℅ Forex SignalsJoin Now
 Forex Free Vip Signal Join Now
FOREX KING  Join Now
FxTrading@Mt4&Mt5Join Now
Forex Expert team ManagerJoin Now
Forex learning and signalJoin Now
FOREX trading groupJoin Now
Forex Trading WorldJoin Now
Forex And Binary Experts (03)Join Now
Forex Market Strategy Join Now
FOREX SINGLESJoin Now
Forex kingJoin Now
Forex SpecialistJoin Now
Forex blueJoin Now
Forex account managementJoin Now

FOR MORE INFO CLICK THIS SITE:https://learningsharks.in/

FOLLOW OUR PAGE:https://www.instagram.com/learningsharks/?hl=en

Stock Market WhatsApp Group Links for October-2023

WhatsApp group links for Stock Market for 2023
WhatsApp Group Links for Stock Market
  • Your hunt for the best WhatsApp groups for the stock market has ended.
  • Hey, now is the perfect time to invest in stocks! What better way to accomplish that than by joining a WhatsApp group for investors who share your interests?
  • Because you can learn from the group’s participants and receive real-time information on the stocks you’re interested in, this is a wonderful way to get started. Not to mention, investing with friends is a lot more enjoyable!
  • One of the best things you can do to increase your wealth is to join a WhatsApp group for the stock market. You get to learn from seasoned traders and investors while staying up to date on the most recent share market news and insights. You can impart advice and tactics to other groups.
  • So if you’re ready to take your finances up a notch, Here is the list of some best share market WhatsApp group links, and let’s make some money together!

20+ Best Stock Market WhatsApp Group (Updated 2023)

Stock Market(Recommended)Join Now
Stock MarketJoin Now
Banknifty MasterJoin Now
StockMarket Trading తెలుగJoin Now
Banknifty Nifty O&F Tyl Join Now
Capistocks FinanceJoin Now
Arpit Bank NiftyJoin Now
Stock Traders Join Now
Stock Market School 1 Join Now
Stock Market School 3 Join Now
Stock Market School 4 Join Now
Market Of WorldJoin Now
Share Market Join Now
Share Market TrainingJoin Now
Art Of Trading101Join Now
Stock Market InformationJoin Now
Stock_Market_Information_Join Now
Nifty & BN Index TradingJoin Now
Share MarketJoin Now
Stock Market Tips 01Join Now

FOR MORE INFO CLICK THIS SITE:https://learningsharks.in/

FOLLOW OUR PAGE:https://www.instagram.com/learningsharks/?hl=en

What is Dividend Paying Stocks?

Stocks that pay dividends are those that are held by publicly traded firms that pay dividends to their shareholders as a percentage of their earnings. Companies use these dividends to distribute their profits to their investors on a regular basis, such as quarterly, semi-annually, or annually.

Dividend Paying stock

The following are the main ideas to comprehend regarding dividend-paying stocks:

  • Income Distribution: By purchasing dividend-paying stocks, you take a stake in the business. The business allots a percentage of its profits to be distributed to shareholders as dividends in exchange for your investment. Investors can rely on these dividends as a reliable source of income.
  • Companies that Pay Dividends: Businesses that pay dividends typically have a longer track record and are more reliable. They frequently have a track record of steady profitability and cash flow, which appeals to investors looking for investments with lesser risk as well as those who are interested in income.
  • Dividend Yield: A crucial statistic for assessing dividend-paying equities is the dividend yield. In proportion to the stock’s current market price, it shows the annual dividend payment. Investors can use it to evaluate a stock’s income potential in relation to its price.
  • Types of Dividends:Different types of dividends exist, including cash dividends (direct cash payments to shareholders), stock dividends (more shares of stock granted to shareholders), and hybrid dividends (a combination of both). The most typical type of payout is cash.
  • Dividend Growth: Some businesses have a track record of gradually raising their dividend payouts. These stocks are referred to as “dividend growth” stocks, and investors who want their income stream to keep up with inflation and possibly increase over time favour them.
  • Dividend taxation: Depending on the nation and the specific circumstances of the investor, dividend taxation can vary. Dividend income may be subject to lower tax rates than other types of income in some jurisdictions.
  • Investor Considerations: When assessing dividend-paying equities, investors frequently take into account a company’s financial stability, dividend history, and dividend payout ratio (the proportion of earnings distributed as dividends). To guarantee that the business can keep paying dividends in the future, a sustainable dividend policy is essential.

Advantages and Disadvantages of Dividend Paying Stocks?

Advantages

  • Steady Income Stream: One of the main advantages is that they offer investors a consistent flow of income in the form of dividends. This may be especially interesting to retirees or investors looking for income.
  • Income Stability: Businesses that regularly pay dividends frequently have dependable and established business practises. Compared to growth companies, they are less likely to be extremely volatile, which might provide investors a sense of stability.
  • Performance in the Past: In the past, dividend-paying stocks have beaten non-dividend-paying stocks in the long run. Because of this, they may be a desirable alternative for investors seeking a mix of income and possible capital growth.
  • Tax advantages: Dividend income may be taxed at a lower rate than other investment income types like interest or capital gains in some jurisdictions. Investors may benefit tax-wise as a result of this.

Disadvantages

  • Lower Growth Potential: Compared to high-growth or tech stocks, dividend-paying equities, especially those from established businesses, may have less room for development. These stocks might not appeal as much to investors looking for large capital gains.
  • Interest Rate Sensitivity: Changes in interest rates may have an impact on dividend stocks. Dividend yields can seem less alluring when interest rates increase, which could result in a drop in stock prices.
  • Dividend reductions: Businesses may reduce or stop paying dividends, particularly in difficult economic or financial times. This may cause investors to lose money and have a negative effect on the stock’s price.
  • Limited Tax Efficiency: Dividend income is taxed more heavily in some nations than capital gains. Investors’ after-tax returns may be impacted by this, particularly those in higher tax bands.
  • Neglected Growth possibilities: Businesses that place a high priority on dividend payments may allot less money for investments in growth possibilities, which may reduce their capacity for long-term growth.
  • Stock Price Impact: A stock’s price often drops by about the dividend amount on the day it goes ex-dividend (the day after which a buyer no longer has the right to receive the following dividend payment). The value of the stock may briefly fluctuate as a result of this.

Conclusion

In conclusion, dividend-paying stocks are shares of well-established, financially secure businesses that regularly pay dividends to shareholders in the form of cash. These companies are frequently preferred by people looking for stability in their investing portfolio because they provide investors with a reliable source of income.

Investors thinking about dividend stocks should evaluate elements such the firm’s financial stability, dividend history, and dividend yield. Stocks that pay dividends can offer an alluring combination of income and, in some cases, long-term growth potential. They might not, however, provide as much capital gain as high-growth stocks.

Ultimately, a person’s financial objectives, risk tolerance, and investment strategy should all be taken into consideration when deciding whether to invest in dividend-paying companies. A portfolio’s diversification by including a variety of assets, such as dividend-paying companies, can assist in developing a well-balanced and comprehensive investment strategy.

FOR MORE INFO CLICK THIS SITE:https://learningsharks.in/

FOLLOW OUR PAGE:https://www.instagram.com/learningsharks/?hl=en

What is Positional Trading in the Indian Stock Market?

They aim to capitalize on larger market trends and movements rather than short-term price fluctuations.
positional trading

Buying or selling stocks or other financial instruments with the purpose of keeping them for a long time—typically from a few weeks to several months—is known as position trading in the Indian stock market. Investors that are less concerned with short-term price volatility and more confident in the long-term potential of the securities they trade frequently employ this method.

The following list includes salient qualities and characteristics of positional trading in the Indian stock market:

  • Longer Time Horizon: Positional traders have a longer time horizon for their investments than day traders or swing traders do. They seek to profit from the long-term price trend by basing their bets on fundamental analysis, technical analysis, or a mix of the two.
  • Fundamental Analysis: Positional traders frequently concentrate on fundamental analysis, which entails assessing a company’s financial standing, earnings potential, market trends, and other elements that may have an impact on the stock’s long-term performance. They frequently take into account elements like sales growth, earnings reports, and competitive positioning.
  • Technical Analysis: Some traders who take positions also use technical analysis, which entails examining past price patterns and charts to find potential entry and exit points. Trading decisions are based on technical indicators and chart patterns.
  • Risk management: To safeguard their investments over the long run, positional traders frequently use risk management techniques. In order to reduce possible losses, this may involve placing stop-loss orders, diversifying their portfolio, and adjusting position sizes.
  • Less Frequent Trading: Positional traders make fewer deals over a longer period of time than day traders, who make many trades in a single day. This lowers transaction costs and enables them to concentrate on fewer, carefully thought-out investments.
  • Market Trends:Positional traders frequently try to capitalise on significant market trends. In an effort to benefit from larger market moves, they might purchase equities during bullish (raising) trends or sell them during bearish (falling) trends.
  • Patience:Patience is a crucial quality for positional traders. They are prepared to put up with short-term market swings and maintain their positions until their investing thesis is proven correct.
  • Exit Strategy: Positional traders have an established exit strategy. When a predetermined profit target is attained, when certain technical or fundamental requirements are satisfied, or if the trade is not going according to plan, they may elect to sell their positions.
  • Research and Analysis: Thorough research and analysis are essential for successful position trading. The most recent news, economic trends, and company-specific events that may affect their positions must be kept up with by traders.
  • Tax considerations: Depending on variables like the holding term and the applicable tax system, positional trading may or may not be taxed differently in India. Traders need to be aware of how their trades will affect their taxes.

Positional trading is a tactic that works well for people who have a longer time horizon for their investments and who have the analytical skills and decision-making capacity to make wise bets. To be successful in positional trading on the Indian stock market, traders must have a clearly defined trading plan and risk management technique.

FOR MORE INFO CLICK THIS SITE:https://learningsharks.in/

FOLLOW OUR PAGE:https://www.instagram.com/learningsharks/?hl=en

Which is the Best Pattern for Intraday Trading?

Purchasing and selling securities listed in a stock exchange on the same day is known as intraday trading.
Intraday Trading

Since the efficiency of a trading pattern depends on a number of variables, including market conditions, the particular asset being traded, as well as a trader’s trading style and risk tolerance, there is no one-size-fits-all “best” pattern for intraday trading. However, intraday traders frequently follow a few standard patterns. Some of them are as follows:

  • Support and Resistance Levels: The concept of support and resistance levels is essential to technical analysis. A major support level is the price at which an asset tends to find purchasing interest, and a key resistance level is the price at which selling interest tends to occur. Intraday traders frequently search for chances to purchase close to support and sell close to resistance.
  • Moving Averages: Simple moving averages (SMA) and exponential moving averages (EMA) are two types of moving averages that are used to spot trends and potential turning points. Short-term and long-term moving average crossovers might indicate opportunities for buying or selling.
  • Candlestick Patterns: Candlestick patterns, such as doji, engulfing patterns, and hammers, can reveal information about the mood of the market and future reversals. These patterns are frequently combined with other indicators by traders.
  • Chart motifs:
  1. The Head and Shoulders pattern may indicate a change in trend. It consists of a head peak in the middle of two shoulder peaks.
  2. Double Tops and Double Bottoms: These patterns appear when the price tests a certain level twice without breaking it, and they are indicators of probable trend reversals.
  • Bollinger Bands: A moving average and two standard deviation bands make up the Bollinger Bands. They aid traders in spotting possible price volatility as well as overbought or oversold positions.
  • Relative Strength Index (RSI): RSI gauges the force and quickness of price changes. It is used by traders to spot overbought (conditions over 70) and oversold (conditions below 30), which might indicate probable reversals.
  • Fibonacci Retracement Levels: Based on the Fibonacci sequence, traders utilise Fibonacci retracement levels to pinpoint probable support and resistance levels. To identify entry and exit places, use these levels as a guide.
  • Volume Analysis: Tracking trade activity can reveal information about how strongly prices fluctuate. Unusual volume levels or decreases can indicate possible trend changes.
  • Strategies for Breakouts and Pullbacks: Traders frequently search for breakout patterns when the price departs from a range of consolidation. They might then wait for a pullback before making a trade in the breakout’s direction.
  • Scalping Strategies: Scalpers try to make money off of modest price changes that happen very quickly. For quick trades, they frequently employ technical indicators like moving averages, stochastic oscillators, and tick charts.

It’s important to keep in mind that there are substantial dangers associated with intraday trading and that no pattern or approach is failsafe. Technical analysis is frequently used by successful intraday traders in conjunction with risk management, a clear trading strategy, and discipline. Additionally, they consistently learn from their experiences and improve their methods in response to shifting market situations.

Any intraday trading strategy should be well understood, practised in a risk-free setting, and possibly even discussed with seasoned traders or financial experts before being put into action. Additionally, to guard against potential losses in intraday trading, risk management is crucial. This includes placing stop-loss orders and controlling position sizes.

FOR MORE INFO CLICK THIS SITE:https://learningsharks.in/

FOLLOW OUR PAGE:https://www.instagram.com/learningsharks/?hl=en