
Selling pressure is present for Indian IT companies in today’s trading session before TCS begins the quarter’s earnings season on Wednesday.
Quarter 4 Preview
The tech sector is getting ready to report its fourth-quarter financial results for FY23. TCS will open the season first, followed by rivals Infosys and HCL Tech. Later in the month, other people will do the same. A seasonally bad quarter is anticipated for the industry, with modest sales and margin expansion.
In light of the upheaval in the banking systems, advice and BFSI verticals are among the important things to watch.On April 12, TCS will be the first to release its Q4 results, and on April 13, Infosys will do the same. Results from Cyient, HCLTech, L&T Technology Services, Tech Mahindra, and Wipro will be presented on April 20, April 26, and April 27, respectively.
The fourth quarter of the year is often difficult for IT companies due to fewer working days and some additional furloughs in January, according to ICICI Direct analysts’ preview research study. On the one hand, global IT giant Accenture continued to report strong bookings in the outsourcing business (a proxy for Indian IT companies), while on the other, we witnessed fast-paced events unfolding in the global BFSI space (30-38% revenue mix for top three IT players). Q4 of this year has been eventful for the IT sector.
Technical Analysis
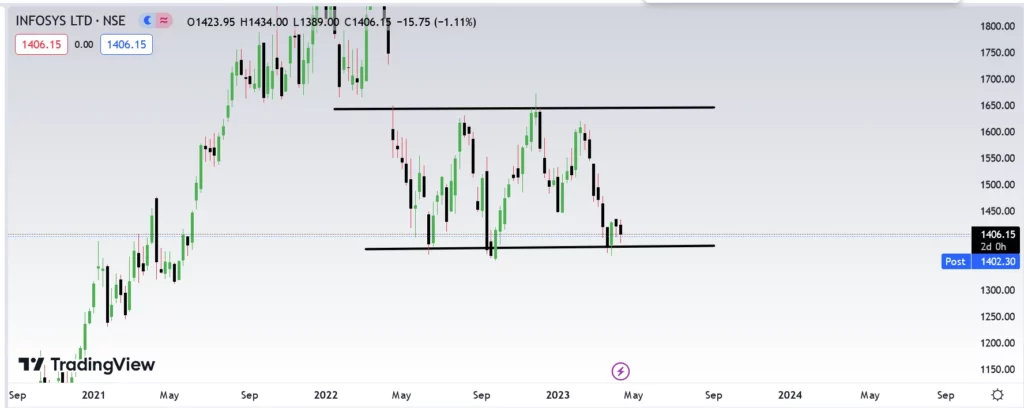
Investors have gradually accepted lower prices in order to exit Infosys Limited, and the stock is currently in a medium-long-term falling trend channel. This shows that investors are becoming more pessimistic and that Infosys Limited will continue to deteriorate. The moving average indicator has given the stock a warning that it will continue to decline.
The price is approaching the 1450 rupee barrier level, which could cause a negative reaction. However, a breakthrough of 1450 rupees in the upside direction would be encouraging. In the past, the volume has been low at price peaks and strong at price troughs. This validates the pattern.
Let us look at the Fundamentals
Profit & Loss
Consolidated Figures in Rs. Crores / View StandalonePRODUCT SEGMENTS
| Mar 2011 | Mar 2012 | Mar 2013 | Mar 2014 | Mar 2015 | Mar 2016 | Mar 2017 | Mar 2018 | Mar 2019 | Mar 2020 | Mar 2021 | Mar 2022 | TTM | |
|---|---|---|---|---|---|---|---|---|---|---|---|---|---|
| Sales + | 27,501 | 33,734 | 40,352 | 50,133 | 53,319 | 62,441 | 68,484 | 70,522 | 82,675 | 90,791 | 100,472 | 121,641 | 141,602 |
| Expenses + | 18,531 | 23,007 | 28,814 | 36,743 | 38,436 | 45,362 | 49,880 | 51,700 | 62,505 | 68,524 | 72,583 | 90,150 | 107,623 |
| Operating Profit | 8,970 | 10,727 | 11,538 | 13,390 | 14,883 | 17,079 | 18,604 | 18,822 | 20,170 | 22,267 | 27,889 | 31,491 | 33,979 |
| OPM % | 33% | 32% | 29% | 27% | 28% | 27% | 27% | 27% | 24% | 25% | 28% | 26% | 24% |
| Other Income + | 1,211 | 1,904 | 2,365 | 2,664 | 3,430 | 3,120 | 3,050 | 3,311 | 2,882 | 2,803 | 2,201 | 2,295 | 2,666 |
| Interest | 2 | 4 | 5 | 9 | 12 | 0 | 0 | 0 | 0 | 170 | 195 | 200 | 252 |
| Depreciation | 854 | 928 | 1,099 | 1,317 | 1,017 | 1,459 | 1,703 | 1,863 | 2,011 | 2,893 | 3,267 | 3,476 | 3,994 |
| Profit before tax | 9,325 | 11,699 | 12,799 | 14,728 | 17,284 | 18,740 | 19,951 | 20,270 | 21,041 | 22,007 | 26,628 | 30,110 | 32,399 |
| Tax % | 27% | 29% | 26% | 28% | 28% | 28% | 28% | 21% | 27% | 24% | 27% | 26% | |
| Net Profit | 6,835 | 8,332 | 9,429 | 10,656 | 12,372 | 13,489 | 14,353 | 16,029 | 15,410 | 16,639 | 19,423 | 22,146 | 23,669 |
| EPS in Rs | 14.88 | 18.14 | 20.52 | 23.31 | 26.93 | 29.36 | 31.24 | 36.69 | 35.26 | 38.96 | 45.42 | 52.56 | 56.27 |
| Dividend Payout % | 50% | 32% | 25% | 34% | 55% | 41% | 41% | 59% | 60% | 45% | 59% | 59% |
| Compounded Sales Growth | |
|---|---|
| 10 Years: | 14% |
| 5 Years: | 12% |
| 3 Years: | 14% |
| TTM: | 22% |
| Compounded Profit Growth | |
|---|---|
| 10 Years: | 10% |
| 5 Years: | 9% |
| 3 Years: | 13% |
| TTM: | 10% |
| Stock Price CAGR | |
|---|---|
| 10 Years: | 17% |
| 5 Years: | 20% |
| 3 Years: | 31% |
| 1 Year: | -19% |
| Return on Equity | |
|---|---|
| 10 Years: | 25% |
| 5 Years: | 26% |
| 3 Years: | 27% |
| Last Year: | 29% |
Balance Sheet
Consolidated Figures in Rs. Crores / View StandaloneCORPORATE ACTIONS
| Mar 2011 | Mar 2012 | Mar 2013 | Mar 2014 | Mar 2015 | Mar 2016 | Mar 2017 | Mar 2018 | Mar 2019 | Mar 2020 | Mar 2021 | Mar 2022 | Dec 2022 | |
|---|---|---|---|---|---|---|---|---|---|---|---|---|---|
| Share Capital + | 286 | 286 | 286 | 286 | 572 | 1,144 | 1,144 | 1,088 | 2,170 | 2,122 | 2,124 | 2,098 | 2,086 |
| Reserves | 25,690 | 31,046 | 37,708 | 44,244 | 50,164 | 60,600 | 67,838 | 63,835 | 62,778 | 63,328 | 74,227 | 73,252 | 72,206 |
| Borrowings + | 0 | 0 | 0 | 0 | 0 | 0 | 0 | 0 | 0 | 4,633 | 5,325 | 5,474 | 7,720 |
| Other Liabilities + | 5,317 | 7,025 | 8,281 | 12,436 | 15,553 | 13,354 | 14,166 | 14,426 | 19,118 | 21,717 | 25,835 | 35,905 | 43,954 |
| Total Liabilities | 31,293 | 38,357 | 46,275 | 56,966 | 66,289 | 75,098 | 83,148 | 79,349 | 84,066 | 91,800 | 107,511 | 116,729 | 125,966 |
| Fixed Assets + | 5,235 | 5,555 | 7,139 | 8,378 | 11,346 | 13,386 | 14,179 | 12,574 | 15,710 | 23,789 | 25,505 | 25,800 | 28,980 |
| CWIP | 264 | 590 | 1,140 | 961 | 776 | 960 | 1,365 | 1,606 | 1,388 | 954 | 922 | 416 | 0 |
| Investments | 144 | 372 | 2,116 | 4,331 | 2,270 | 1,892 | 16,423 | 12,163 | 11,261 | 8,792 | 14,205 | 20,324 | 21,116 |
| Other Assets + | 25,650 | 31,840 | 35,880 | 43,296 | 51,897 | 58,860 | 51,181 | 53,006 | 55,707 | 58,265 | 66,879 | 70,189 | 75,870 |
| Total Assets | 31,293 | 38,357 | 46,275 | 56,966 | 66,289 | 75,098 | 83,148 | 79,349 | 84,066 | 91,800 | 107,511 | 116,729 | 125,966 |
Disclaimer: The information mentioned above is merely an opinion and should only be treated for educational purposes. If you have any questions or feedback about this article, you can write us back. To reach out, you can use our contact us page.Support@learningsharks.in