As a result of both companies reporting their highest-ever sales in the fourth quarter of FY23, the shares of real estate companies Godrej Properties and Sobha increased 8% and 5%, respectively, in Monday’s trading.
Godrej Properties’ financial year 2022–2023 bookings increased by 56% to Rs 12,232 crore during the three months ending March 2023, totaling Rs 4,051 crore in bookings.
Sales Performance
In terms of area, its sales volumes for the quarter increased by 19% from 4.42 million square feet to 5.25 million square feet. Sales volumes increased 40% over the course of the year, from 10.84 million square feet to 15.21 million.
This is the best quarterly and yearly sales performance ever for Godrej Properties. Along with the company’s sales, its cash receipts and project deliveries also reached a record level.
At 9.55 am, the price of Godrej Properties’ shares had increased by 8% to Rs 1,216 from the previous day’s closing price of Rs 1,125 a share. The stock, however, has decreased by more than 28% during the past year.
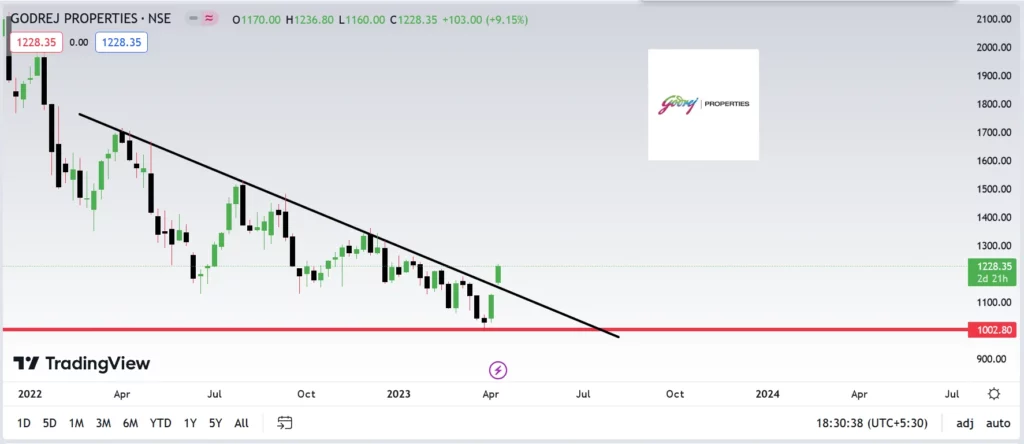
Technical Analysis
Jesus Properties opened at 1170.00 and closed at 1228.35, which is an 8.39% increase over the conclusion of the prior session. It fluctuated between 1160.00 and 1236.80.
With an average volume of 4325815, or 68.19% of the volumes from the previous session, the session was bullish.
The short-term trend has changed somewhat favorably, but it's too soon to draw any firm conclusions.
Even though the stock price has increased, the stock's mid-term trend is still negative and downward.
Long-term trends have changed somewhat for the better, but it's too soon to draw any firm conclusions.
Tomorrow’s support is at 1194.18, while its resistance is at 1270.98.
For the first 5 to 15 periods, these support and resistance points are valid.
Let us look at the Fundamnetals
Profit & Loss
Consolidated Figures in Rs. Crores / View Standalone
| Mar 2011 | Mar 2012 | Mar 2013 | Mar 2014 | Mar 2015 | Mar 2016 | Mar 2017 | Mar 2018 | Mar 2019 | Mar 2020 | Mar 2021 | Mar 2022 | TTM | |
|---|---|---|---|---|---|---|---|---|---|---|---|---|---|
| Sales + | 452 | 770 | 1,037 | 1,179 | 1,843 | 2,123 | 1,583 | 1,604 | 2,817 | 2,441 | 765 | 1,825 | 1,937 |
| Expenses + | 346 | 650 | 751 | 897 | 1,586 | 1,986 | 1,330 | 1,819 | 2,639 | 2,181 | 1,214 | 1,880 | 1,956 |
| Operating Profit | 105 | 120 | 286 | 283 | 257 | 137 | 253 | -216 | 178 | 260 | -449 | -56 | -19 |
| OPM % | 23% | 16% | 28% | 24% | 14% | 6% | 16% | -13% | 6% | 11% | -59% | -3% | -1% |
| Other Income + | 107 | 88 | 10 | 75 | 83 | 146 | 150 | 499 | 419 | 473 | 568 | 761 | 786 |
| Interest | 4 | 5 | 3 | 4 | 5 | 41 | 104 | 150 | 234 | 220 | 185 | 167 | 164 |
| Depreciation | 4 | 4 | 4 | 6 | 10 | 14 | 14 | 16 | 14 | 21 | 20 | 21 | 23 |
| Profit before tax | 204 | 199 | 289 | 347 | 326 | 228 | 284 | 117 | 348 | 493 | -86 | 516 | 580 |
| Tax % | 30% | 35% | 32% | 32% | 28% | 30% | 27% | 26% | 27% | 44% | -121% | 32% | |
| Net Profit | 143 | 129 | 197 | 236 | 236 | 160 | 207 | 87 | 253 | 274 | -189 | 351 | 425 |
| EPS in Rs | 7.34 | 4.92 | 6.95 | 8.00 | 9.58 | 7.33 | 9.56 | 4.01 | 11.04 | 10.73 | -6.81 | 12.68 | 15.10 |
| Dividend Payout % | 24% | 24% | 23% | 25% | 21% | 0% | 0% | 0% | 0% | 0% | 0% | 0% |
| Compounded Sales Growth | |
|---|---|
| 10 Years: | 9% |
| 5 Years: | 3% |
| 3 Years: | -13% |
| TTM: | 109% |
| Compounded Profit Growth | |
|---|---|
| 10 Years: | 15% |
| 5 Years: | 11% |
| 3 Years: | 15% |
| TTM: | 514% |
| Stock Price CAGR | |
|---|---|
| 10 Years: | 17% |
| 5 Years: | 11% |
| 3 Years: | 22% |
| 1 Year: | -26% |
| Return on Equity | |
|---|---|
| 10 Years: | 4% |
| 5 Years: | 2% |
| 3 Years: | 2% |
| Last Year: | 4 |
Balance Sheet
Consolidated Figures in Rs. Crores / View StandaloneCORPORATE ACTIONS
| Mar 2011 | Mar 2012 | Mar 2013 | Mar 2014 | Mar 2015 | Mar 2016 | Mar 2017 | Mar 2018 | Mar 2019 | Mar 2020 | Mar 2021 | Mar 2022 | Sep 2022 | |
|---|---|---|---|---|---|---|---|---|---|---|---|---|---|
| Share Capital + | 70 | 78 | 78 | 99 | 100 | 108 | 108 | 108 | 115 | 126 | 139 | 139 | 139 |
| Reserves | 842 | 1,365 | 1,351 | 1,694 | 1,747 | 1,657 | 1,896 | 1,102 | 2,354 | 4,682 | 8,181 | 8,536 | 8,639 |
| Borrowings + | 945 | 2,087 | 1,678 | 2,574 | 3,486 | 3,123 | 3,980 | 3,703 | 3,516 | 3,715 | 4,593 | 5,196 | 5,382 |
| Other Liabilities + | 361 | 1,179 | 1,572 | 1,779 | 2,030 | 1,691 | 1,197 | 3,358 | 2,107 | 1,567 | 3,333 | 3,932 | 4,885 |
| Total Liabilities | 2,218 | 4,709 | 4,679 | 6,147 | 7,363 | 6,578 | 7,181 | 8,271 | 8,092 | 10,090 | 16,245 | 17,804 | 19,045 |
| Fixed Assets + | 46 | 46 | 51 | 64 | 117 | 107 | 102 | 113 | 97 | 113 | 174 | 183 | 188 |
| CWIP | 1 | 19 | 36 | 62 | 73 | 1 | 0 | 71 | 100 | 163 | 229 | 340 | 428 |
| Investments | 0 | 0 | 0 | 0 | 0 | 664 | 760 | 1,454 | 2,637 | 3,571 | 5,243 | 4,883 | 4,489 |
| Other Assets + | 2,170 | 4,644 | 4,593 | 6,021 | 7,173 | 5,807 | 6,319 | 6,633 | 5,259 | 6,243 | 10,599 | 12,397 | 13,940 |
| Total Assets | 2,218 | 4,709 | 4,679 | 6,147 | 7,363 | 6,578 | 7,181 | 8,271 | 8,092 | 10,090 | 16,245 | 17,804 | 19,045 |
Disclaimer : The information mentioned above is merely an opinion and should only be treated for educational purposes. If you have any questions or feedback about this article, you can write us back. To reach out, you can use our contact us page Support@learningsharks.in