Background of Bear Call ladder
Basics of stock market
• Induction
• Bull call spread
• Bull put spread
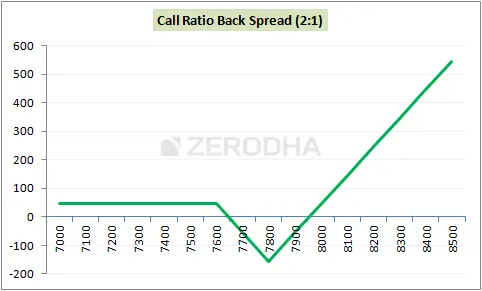
• Call ratio Back Spread
• Bear call ladder
• Synthetic long & Arbitrage
• Bear put spread
• Bear call spread
• put ratio back spread
• Long straddle
• Short straddle
• Max pain & PCR ratio
• Iron condor
4.1 – Background of Bear Call ladder
You shouldn’t be misled into thinking that the “Bear” in “Bear Call Ladder” refers to a bearish strategy. Since the Bear Call Ladder is a variation on the Call ratio back spread, you should use it only if you are unabashedly bullish on the stock or index.
In fact, In a Bear Call Ladder, selling an “in the money” call option covers the cost of buying call options. Additionally, the Bear Call Ladder is typically configured for a “net credit,” where the cash flow is always superior to the cash flow of the call ratio back spread. But keep in mind that while both of these strategies exhibit comparable payoff structures, their risk structures differ just a little.

4.2 – Strategy Notes
The Bear Call Ladder is a 3 leg option strategy, usually setup for a “net credit”, and it involves –
Selling 1 ITM call option
Buying 1 ATM call option
Buying 1 OTM call
This setup, which uses a 1:1:1 ratio, is known as the Bear Call Ladder. The bear Call Ladder must be executed in a ratio of 1:1:1, meaning that for each ITM Call Option sold, an ATM Call Option and an OTM Call Option must be purchased. Other combinations, such as 2:2:2 or 3:3:3, are possible.
Let’s use an example where the Nifty Spot is at 7790 and you predict it will reach 8100 by expiration. This is unmistakably a market bullish outlook. To put the Bear Call Ladder into practice:
Sell 1 ITM Call option
Buy 1 ATM Call option
Buy 1 OTM Call option
Ensure that
The Call options have the same expiration date.
has the same underlying foundation.
The ratio stays the same.
The trade setup is as follows:
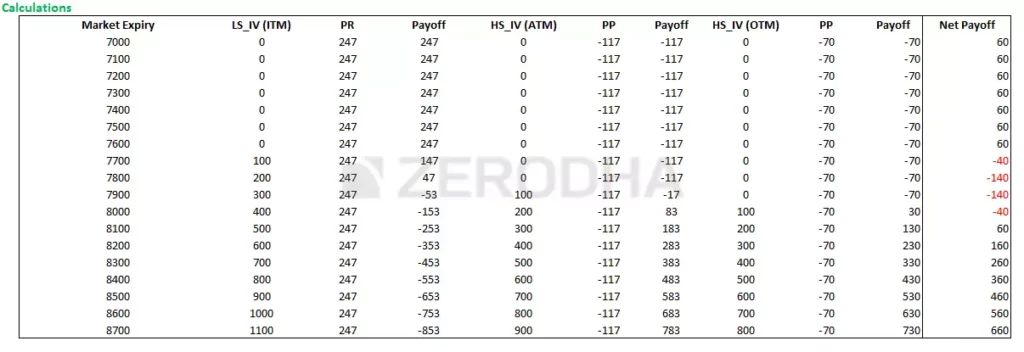
The premium received for this 7600 CE, one lot short, is Rs. 247.
The premium for this option is Rs. 117 for 7800 CE, one lot long.
The premium for this option is Rs. 70/- for 7900 CE, one lot long.
247 – 117 – 70 = 60 would be the net credit.
The bear call ladder is executed using these trades. Let’s examine what would happen to the strategies’ overall cash flow at various levels of expiry.
Please keep in mind that because the strategy payoff is quite flexible, we need to assess it at different levels of expiry.
Scenario 1 – Market expires at 7600 (below the lower strike price)
We know the intrinsic value of a call option (upon expiry) is –
Max [Spot – Strike, 0]
The 7600 would have an intrinsic value of
Max [7600 – 7600, 0]
= 0
Due to the fact that we sold this option, we are able to keep the premium received, which is Rs. 247.
The intrinsic value of the 7800 CE and 7900 CE would both be zero, so we would forfeit the premium payments of Rs. 117 and Rs. 70, respectively, that were made.
Net cash flow would be superior. Paid a premium and received
= 247 – 117 – 70
= 60
The market expires at 7660 in Scenario 2 (lower strike plus received net premium).
The 7600 CE would be worth – on an intrinsic level.
Spot – Strike Max [0]
The 7600’s intrinsic worth would be
Max [7660 – 7600, 0]
= 60
We will subtract 60 from 247 due to the 7600 CE’s shortness, keeping the balance.
= 247 – 60
= 187
The value of the 7800 and 7900 CE would expire, so we would forfeit the premiums paid—117 and 70, respectively.
The full strategic benefit would be:
= 187 – 117 – 70
= 0\
The Put Ratio Back Spread is used in these trades. Let’s examine what would happen to the strategies’ overall cash flow at various levels of expiry.
5.3 – Strategy Generalization
Based on the scenarios discussed above, we can draw a few conclusions:
Technically speaking, this is a ladder and not a spread. The first two option legs, however, produce a traditional “spread” in which we sell ITM and buy ATM. It is possible to interpret the spread as the difference between ITM and ITM options. It would be 200 in this instance (7800 – 7600).
Net Credit equals Premium collected from ITM CE minus Premium paid to ATM and OTM CE
Spread (difference between the ITM and ITM options) – Net Credit equals the maximum loss.
When ATM and OTM Strike, Max Loss occurs.
When the market declines, the reward equals Net Credit.
Lower Strike plus Net Credit equals Lower Breakeven.
Upper Breakeven is equal to the sum of the long strike, short strike, and net premium.
Take note of how the strategy loses money between 7660 and 8040 but ends up profiting greatly if the market rises above 8040. You still make a modest profit even if the market declines. However, if the market does not move at all, you will suffer greatly. Because of the Bear Call Ladder’s characteristics, I advise you to use it only when you are positive that the market will move in some way, regardless of the direction.
In my opinion, when the quarterly results are due, it is best to use stocks (rather than an index) to implement this strategy.
5.4 – Effect of Greeks
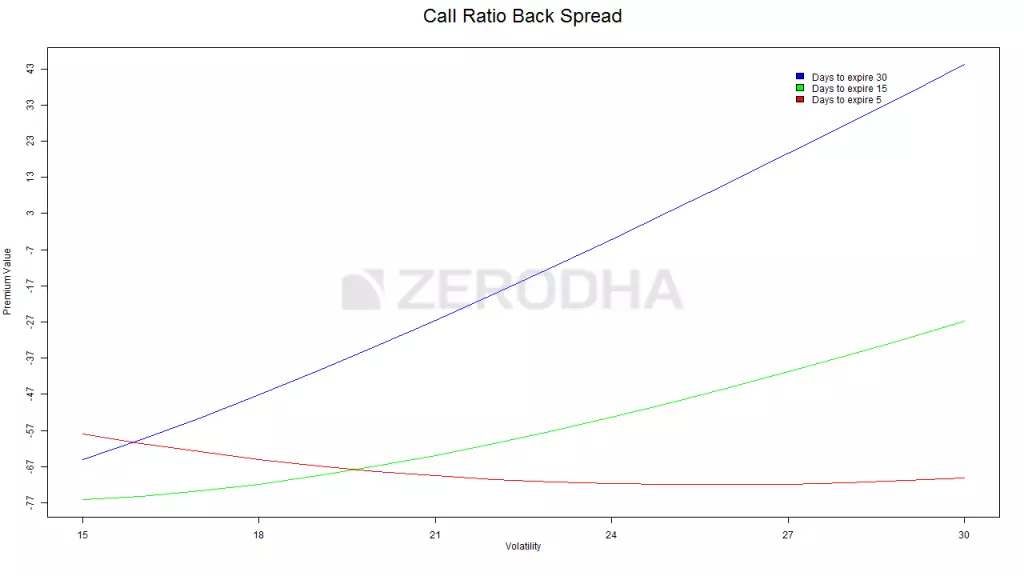
Firstly, Greeks have a similar impact on this strategy as they do on Call Ratio Back spread, particularly in terms of volatility. I’ve copied the discussion on volatility from the previous chapter for your convenience.
undoubtedly, Three colored lines show the relationship between the change in “net premium,” or the strategy payoff, and the change in volatility. These lines give us insight into how an increase in volatility affects the strategy while keeping the time until expiration in perspective.
Blue Line: According to this line, the Bear Call Ladder spread benefits from higher volatility when there are still 30 days until expiration. As we can see, when volatility rises from 15% to 30%, the strategy’s payoff increases from -67 to +43. This obviously implies that when there is enough time before expiration, in addition to being accurate about the direction of the stock or index, you also need to have a view of volatility. Due to this, even though I’m optimistic about the stock, I
would be hesitant to use this strategy at the beginning of the series if volatility is higher than average (say more than double of the usual volatility reading)
Green line – This line suggests that, although not as much as in the preceding case, an increase in volatility is advantageous when there are roughly 15 days until expiration. As we can see, when volatility rises from 15% to 30%, the strategy payoff increases from -77 to -47.
Red line: This result is intriguing and illogical. The strategy is negatively impacted by an increase in volatility when there are only a few days left until expiration! Consider the possibility that a rise in volatility when there are few days left before expiration
As a result of the option’s OTM expiration, the premium drops. So, if you are bullish on a stock or index with a few days left until expiration and you anticipate that volatility will rise during this time, proceed with caution.
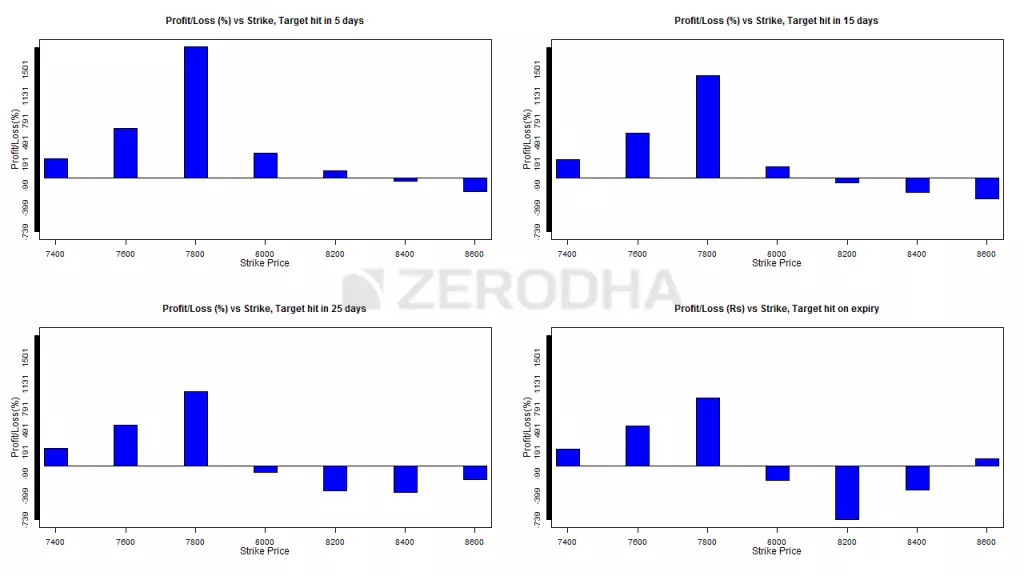
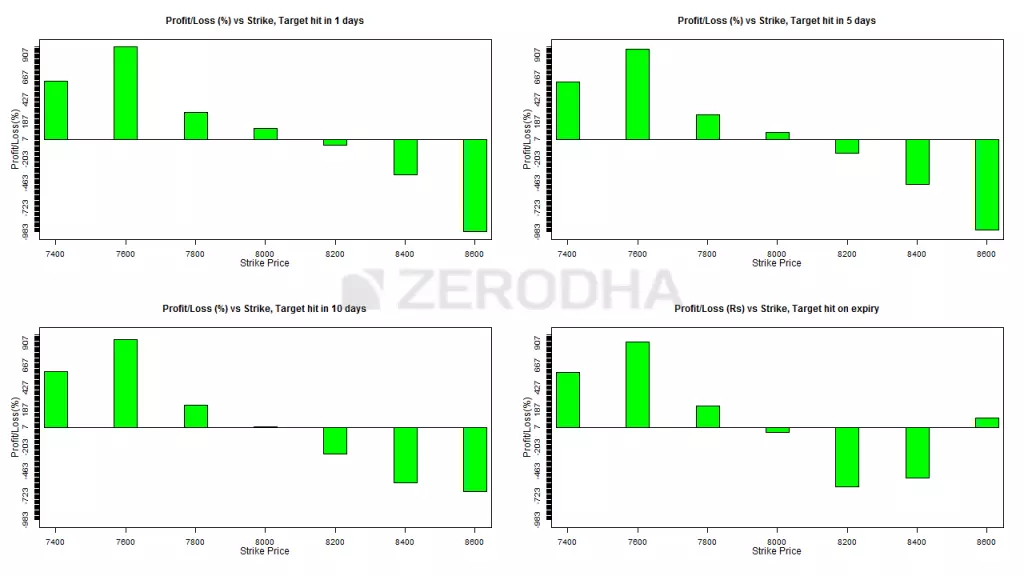
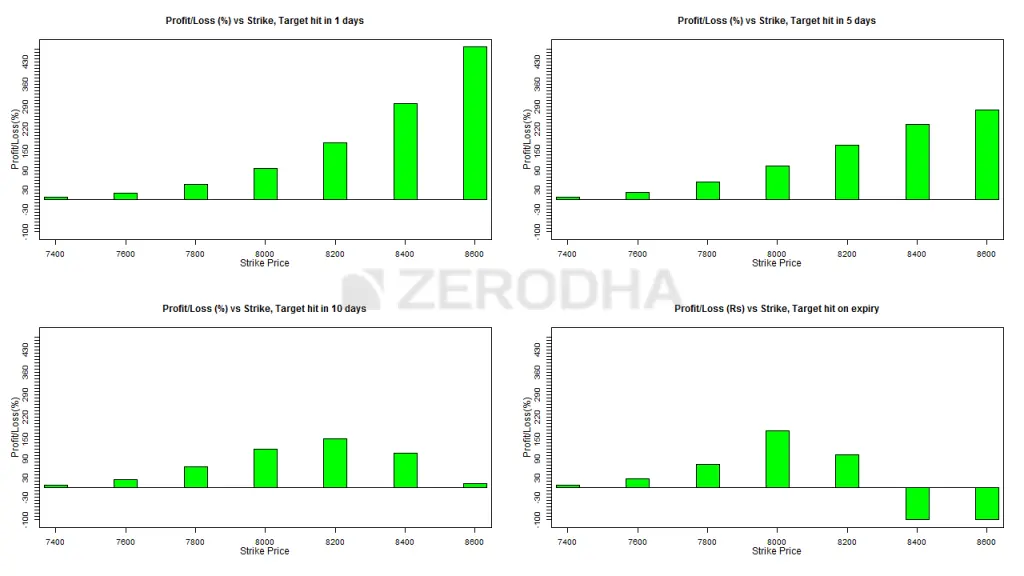
I assume you are already familiar with these graphs. The following graphs demonstrate the profitability of the strategy taking into account the time until expiration; as a result, these graphs assist the trader in choosing the appropriate strikes.
Clearly, The best strikes to choose are deep ITM and slightly ITM, i.e., 7600 (lower strike short) and 7900, if you expect the move during the second half of the series and you expect it to happen within a day (or within 5 days, graph 2). (higher strike long). Please take note that this is an ITM and ITM spread rather than the traditional combination of an ITM + OTM spread. In actuality, none of the other combinations work.
Graphs 3 (bottom right) and 4 (bottom left): The best strategy is to use these graphs if you anticipate a move during the second half of the series and that it will occur within 10 days (or on the expiry day, graph 4).Deep ITM and slightly ITM strikes, such as 7600 (lower strike short) and 7900, are the best options (higher strike long). This is in line with what graphs 1 and 2 indicate.
Please keep in mind that because the strategy payoff is quite flexible, we need to assess it at different levels of expiry.
At last, The blue line indicates that a rise in volatility with plenty of time left before expiration (30 days) is advantageous for the put ratio back spread. As we can see, when volatility rises from 15% to 30%, the strategy payoff increases from -57 to +10. This obviously implies that when there is enough time before expiration, in addition to being accurate about the direction of the stock or index, you also need to have a view of volatility. Because of this, even though I am bearish on the stock, I might be hesitant to use this strategy at the beginning of the series if volatility is higher than average (say more than double the usual volatility reading)
For Visit: Click here for the directions.