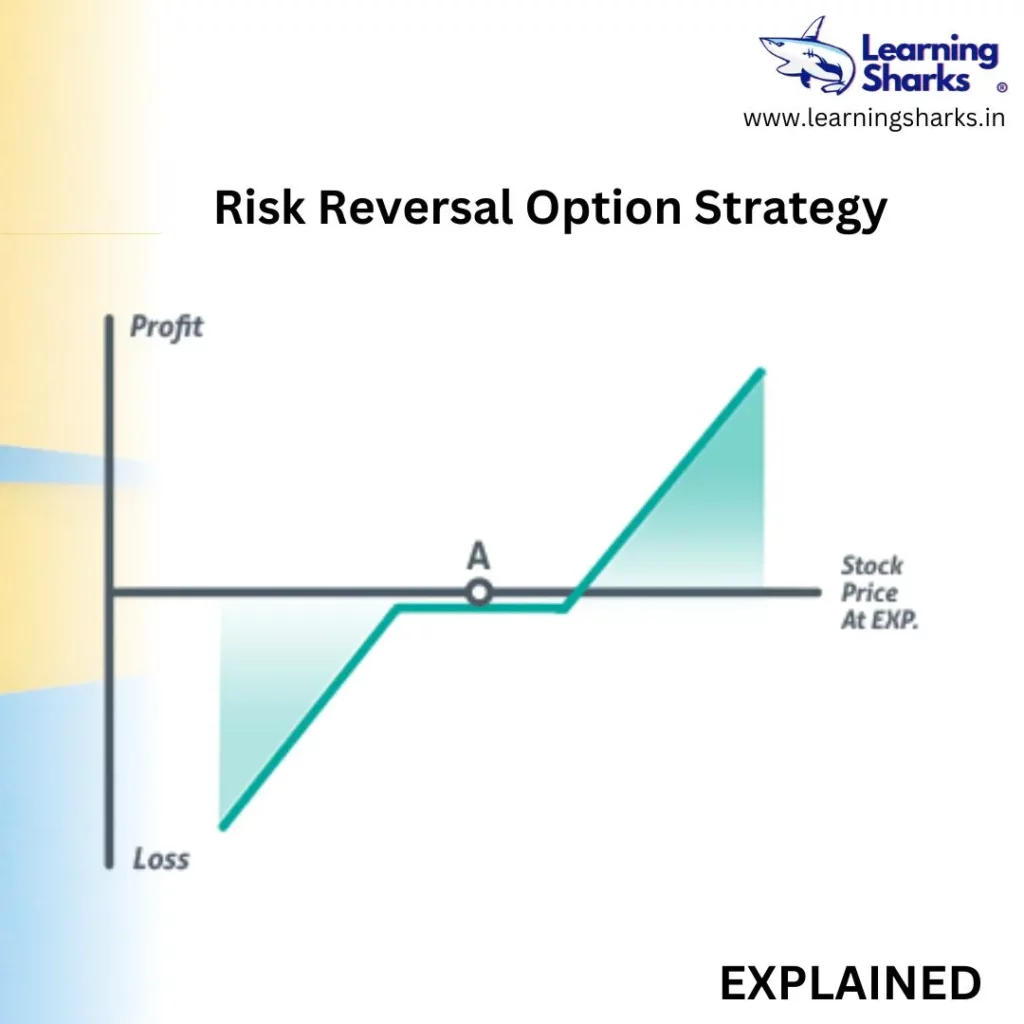
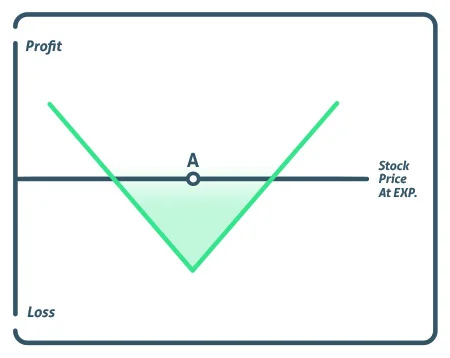
Purchasing a call and selling a put in the same month and at the same strike price creates a synthetic long stock position. If the investor uses this method and holds the position until expiration, they will purchase the shares at strike price A. The investor will want to exercise the call option if the stock price rises over strike price A, and the investor will be assigned on the put if the stock falls below strike price A, so they will ultimately own the stock at price A.
Most investors, however, do not want to keep the position until expiration because it resembles a long stock position.
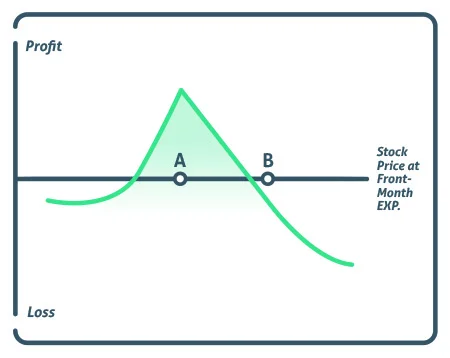
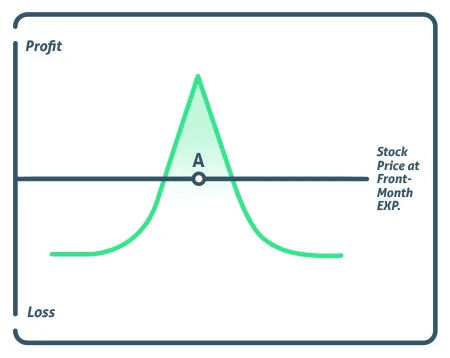
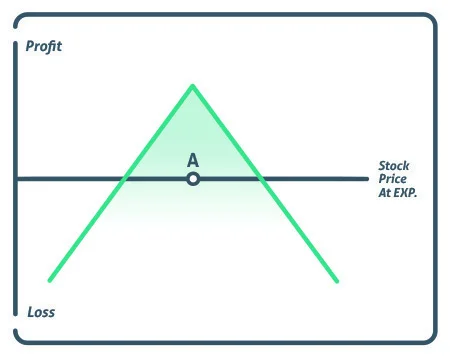
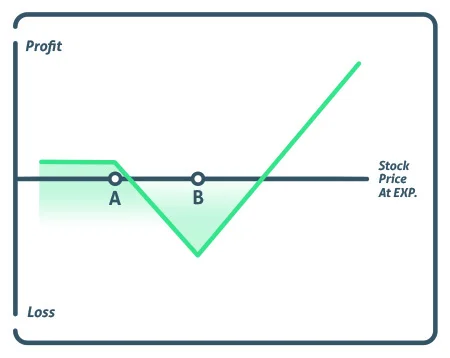
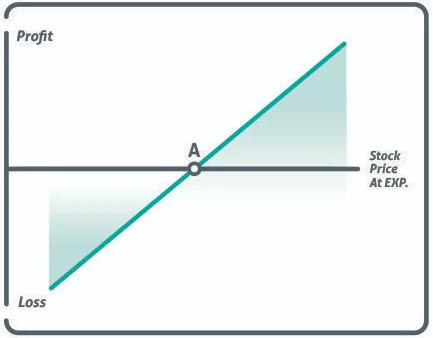
Profit/Loss
The potential profit is limitless because the investor can keep making money as long as the stock trades at a higher price by owning the shares.
As the price of the stock declines, losses continue to accumulate and the maximum loss is likewise limitless, at least down to zero.
Breakeven
Regardless of whether it was purchased for a credit or a debit, the synthetic long stock has a single breakeven point that is computed differently.
The breakeven point would be determined by deducting the premium received from the strike price if the synthetic long stock had been purchased with credit.
The breakeven point would be determined by multiplying the purchase price of the synthetic long stock by the strike price if it were acquired on a debit.
Example
A trader might purchase a call with a strike price of 100 and sell a put with a strike price of 100 for the following exchange rate if XYZ is trading at Rs 100 and is anticipated to trade higher over the following three months:
- Purchase one (Rs 4) XYZ 100-strike price call.
- For Rs 3.50, sell 1 XYZ 100-strike price put.
- Total premium = a debit of Rs 0.50
The investor will profit Rs 5.00 on the stock if it goes up to Rs 105 at expiration, but because they invested Rs 0.50 on the synthetic long stock, their net gain will only be Rs 4.50.
A 100-strike price put will be assigned to the trader, who will then purchase the shares for Rs 100 if the stock trades lower than Rs 95 at expiration. This would indicate that they suffered a Rs 5.00 loss on the put, but because they paid Rs 0.50 for the synthetic long stock, their overall loss would be Rs 5.50.
Conclusion
The only justification for purchasing a synthetic long stock option would be to have the same position as a stock without paying the high stock prices. Of course, the trader’s investment bank and margin requirements play a role in this. Because they don’t want their money to be tied down, most investors don’t hold their positions until they expire, which is why they initially utilised a synthetic long stock option call.
Due to the fact that this form of strategy is long one option and short another, it is not extremely sensitive to fluctuations in implied volatility.
FOLLOW OUR WEBSITE FOR CHART PATTERNS: https://learningsharks.in/chart-patterns/
FOLLOW OUR PAGE:https://www.instagram.com/learningsharks/