Learning sharks-Share Market Institute


Rajouri Garden  8595071711 7982037049  Noida 8920210950 , and  Paschim Vihar  7827445731  

Fee revision notice effective 1st April 2025; No change for students enrolled before 15th May 2025

Download “Key features of Budget 2024-2025here

Which is the Best Pattern for Intraday Trading?

Purchasing and selling securities listed in a stock exchange on the same day is known as intraday trading.
Intraday Trading

Since the efficiency of a trading pattern depends on a number of variables, including market conditions, the particular asset being traded, as well as a trader’s trading style and risk tolerance, there is no one-size-fits-all “best” pattern for intraday trading. However, intraday traders frequently follow a few standard patterns. Some of them are as follows:

  • Support and Resistance Levels: The concept of support and resistance levels is essential to technical analysis. A major support level is the price at which an asset tends to find purchasing interest, and a key resistance level is the price at which selling interest tends to occur. Intraday traders frequently search for chances to purchase close to support and sell close to resistance.
  • Moving Averages: Simple moving averages (SMA) and exponential moving averages (EMA) are two types of moving averages that are used to spot trends and potential turning points. Short-term and long-term moving average crossovers might indicate opportunities for buying or selling.
  • Candlestick Patterns: Candlestick patterns, such as doji, engulfing patterns, and hammers, can reveal information about the mood of the market and future reversals. These patterns are frequently combined with other indicators by traders.
  • Chart motifs:
  1. The Head and Shoulders pattern may indicate a change in trend. It consists of a head peak in the middle of two shoulder peaks.
  2. Double Tops and Double Bottoms: These patterns appear when the price tests a certain level twice without breaking it, and they are indicators of probable trend reversals.
  • Bollinger Bands: A moving average and two standard deviation bands make up the Bollinger Bands. They aid traders in spotting possible price volatility as well as overbought or oversold positions.
  • Relative Strength Index (RSI): RSI gauges the force and quickness of price changes. It is used by traders to spot overbought (conditions over 70) and oversold (conditions below 30), which might indicate probable reversals.
  • Fibonacci Retracement Levels: Based on the Fibonacci sequence, traders utilise Fibonacci retracement levels to pinpoint probable support and resistance levels. To identify entry and exit places, use these levels as a guide.
  • Volume Analysis: Tracking trade activity can reveal information about how strongly prices fluctuate. Unusual volume levels or decreases can indicate possible trend changes.
  • Strategies for Breakouts and Pullbacks: Traders frequently search for breakout patterns when the price departs from a range of consolidation. They might then wait for a pullback before making a trade in the breakout’s direction.
  • Scalping Strategies: Scalpers try to make money off of modest price changes that happen very quickly. For quick trades, they frequently employ technical indicators like moving averages, stochastic oscillators, and tick charts.

It’s important to keep in mind that there are substantial dangers associated with intraday trading and that no pattern or approach is failsafe. Technical analysis is frequently used by successful intraday traders in conjunction with risk management, a clear trading strategy, and discipline. Additionally, they consistently learn from their experiences and improve their methods in response to shifting market situations.

Any intraday trading strategy should be well understood, practised in a risk-free setting, and possibly even discussed with seasoned traders or financial experts before being put into action. Additionally, to guard against potential losses in intraday trading, risk management is crucial. This includes placing stop-loss orders and controlling position sizes.

FOR MORE INFO CLICK THIS SITE:https://learningsharks.in/

FOLLOW OUR PAGE:https://www.instagram.com/learningsharks/?hl=en

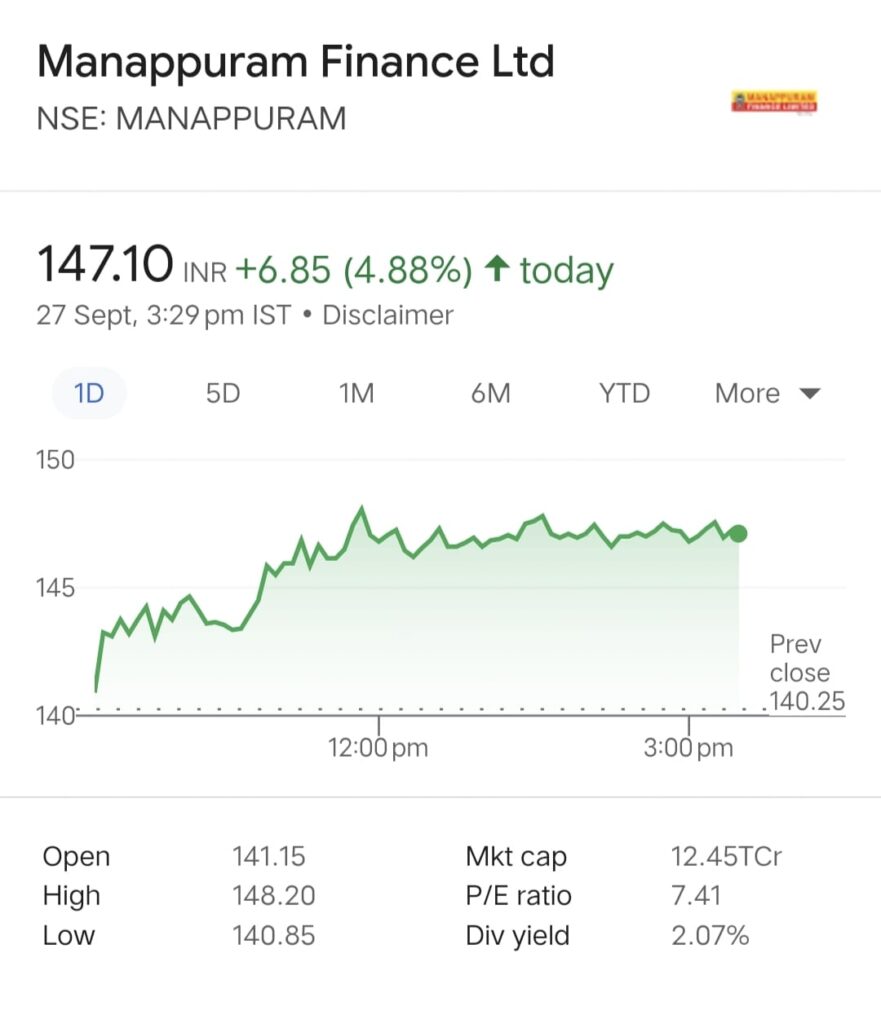
Manappuram Finance shares jump 6% as HC asks ED;

Manappuram Finance: In response to the most recent development, the stock increased by 5.55% to reach a high of Rs 148.20 on the BSE. The Thrissur District’s Valapad police station is where the FIR was submitted.

Following the fresh development, the stock rose 5.55 per cent to hit a high of Rs 148.20 on BSE. The FIR was filed at Valapad police Station, Thrissur District.
According to Manappuram Finance, the Kerala High Court ordered the Enforcement Directorate to deliver all original paperwork for the properties that had been frozen.
  • After the Kerala High Court of Kerala dismissed a FIR against Manappuram Finance’s managing director and CEO VP Nandakumar and ordered the Enforcement Directorate to return and release all the original documents of the properties frozen in accordance with an order it issued under Section 17 (1-A) of the Prevention of Money Laundering Act, the company’s shares increased by almost 6% on Wednesday.
  • Recall that the ED has charged Manappuram Finance with illegally collecting public deposits of Rs 150 crore without the central bank’s consent. Additionally, it was thought to have engaged in substantial cash transactions without adhering to KYC guidelines.

The stock increased 5.55 percent in response to the recent news to reach a high of Rs 148.20 on the BSE. The Thrissur District’s Valapad police station is where the FIR was submitted.

  • “The Hon’ble High Court of Kerala on September 12, 2023, directed the Enforcement Directorate to return and release all original documents of the properties frozen pursuant to order dated May 4, 2022 issued by the Enforcement Directorate under Section 17 (1-A) in light of the quashing of the FIR and ECIR and in the absence of any further FIR being registered.

The organization conducted various searches at locations connected to Manappuram Finance’s registered office in Thrissur, Kerala.

CONCLUSION

FOR MORE INFO CLICK THIS SITE:https://learningsharks.in/

FOLLOW OUR PAGE:https://www.instagram.com/learningsharks/?hl=en

Understanding Market Psychology

The issue was managed by HDFC Bank, Motilal Oswal Investment Advisors and Nuvama Wealth Management, while Bigshare Services was the registrar to the issue.

Introduction

Success in the finance industry depends not only on deciphering the complex inner workings of the human mind but also on skillful data analysis. Market psychology, also known as investor sentiment, is crucial in determining how financial markets behave. We delve deeply into the nuances of market psychology in this comprehensive guide, illuminating its many facets and outlining tactics to successfully negotiate this dynamic environment.

Unraveling Market Psychology

The collective thoughts, feelings, and attitudes of market participants that influence their purchasing and selling decisions are known as market psychology. It affects market trends, asset prices, and frequently results in irrational behavior that defies accepted economic theory. Anyone aspiring to success in the financial world must have a solid understanding of market psychology.

The Role of Fear and Greed

  • Fear: One of the primary emotions in the financial markets, fear frequently prompts investors to sell quickly during market downturns, causing panic and sharp price declines.
  • Greed: The lure of quick gains can tempt people to invest carelessly, pushing asset prices up, frequently to unsustainable levels.

Behavioral Biases

Human psychology is fraught with biases that can have a profound impact on investment decisions. These biases include:

  • Confirmation Bias: Investors seek information that confirms their existing beliefs, even if it is not rational.
  • Herd Mentality: Many investors adopt a herd mentality, frequently basing their decisions more on what other people are doing than on rational analysis.
  • Loss Aversion: People frequently exhibit risk-averse behavior because they strongly prefer to avoid losses to achieving equivalent gains.

Market Cycles

Market psychology is closely linked to market cycles. Understanding these cycles can provide valuable insights into investor sentiment and help anticipate market moves. The typical market cycle includes:

  1. Bull Market: A bull market is characterized by optimism and rising prices and is supported by the hope that the good times will last.
  2. Bear Market: A bear market is the opposite of a bull market and is characterized by pessimism and declining prices, which are frequently fueled by fear and uncertainty.
  3. Sideways Market: This is a period of indecision in which investors are unsure of the market’s future direction.

Strategies for Navigating Market Psychology

Diversification

One of the most effective strategies to mitigate the impact of market psychology is diversification. By spreading investments across different asset classes, industries, and geographic regions, investors can reduce the risk of heavy losses during market downturns.

Risk Management

Implementing sound risk management strategies, such as setting stop-loss orders and having a clear exit plan, can help investors avoid impulsive decisions driven by fear or greed.

Contrarian Investing

Contrarian investors deliberately go against the crowd, buying when others are selling and selling when others are buying. This strategy aims to capitalize on the irrational behavior of the majority.

Education and Analysis

Arming oneself with knowledge and data-driven analysis is a powerful antidote to the irrational aspects of market psychology. Understanding market fundamentals and conducting thorough research can help investors make more informed decisions.

The Psychology of Trading

Market psychology is particularly prominent in the trading industry. Traders frequently have to make snap judgments in a highly emotional setting. One must control their own emotions, practice self-control, and remain disciplined while trading to succeed.

Emotion Management

Emotions like fear and greed can be disastrous for traders. It’s crucial to learn to manage these emotions and not let them drive impulsive actions.

Technical and Fundamental Analysis

Both technical and fundamental analysis can provide traders with a rational basis for their decisions. Technical analysis looks at historical price data, while fundamental analysis examines the underlying financial health of an asset.

Conclusion

Market psychology is a multifaceted aspect of financial markets that can significantly impact investment decisions. It’s essential for investors and traders to recognize these psychological factors and develop strategies to navigate them successfully. By understanding the dynamics of market psychology, one can make more informed decisions, ultimately leading to better outcomes in the world of finance.

FOR MORE INFO CLICK THIS SITE:https://learningsharks.in/

FOLLOW OUR PAGE:https://www.instagram.com/learningsharks/?hl=en

What factors affect the Nifty 50 index trading?

It represents the performance of the 50 largest and most liquid Indian companies from various sectors. Here's a general guide on how to trade in the Nifty:
nifty

The National Stock Exchange of India’s (NSE) Nifty 50 index is a significant benchmark index, and a number of factors affect its movements. The following are some of the primary variables that may have an impact on Nifty 50 index trading:

  • Economic Data: The Nifty 50 index can be significantly impacted by economic indicators including GDP growth, inflation rates, industrial production, and employment data. Positive economic data frequently fuels market optimism and could raise the score.
  • Corporate Earnings: An important consideration is the Nifty 50 firms’ financial performance. Positive index effects might result from strong corporate earnings releases since they can boost investor confidence and stock prices.
  • Interest Rates: The Reserve Bank of India’s (RBI) monetary policy choices, such as adjustments to interest rates, can have an impact on the cost of borrowing and investment choices. Stock prices may decrease in response to interest rate increases, while stock prices may increase in response to interest rate decreases.
  • Inflation: Inflation reduces consumer purchasing power and may have an effect on business profitability. Concerns about cost increases brought on by high inflation rates could have a detrimental impact on the Nifty 50 index.
  • Institutional Investors: from Outside India: Institutional investors from outside India (FIIs) are a major player in the Indian equities markets. Their purchasing or selling actions may significantly affect the Nifty 50 index.
  • Global Market patterns: The Nifty 50 index can be affected by factors such as investor sentiment, geopolitical events, and patterns in major global stock markets.
  • Currency exchange rates: Changes in exchange rates may have an impact on Indian exports and imports, which may have an impact on business revenues and profitability and ultimately have an impact on the Nifty 50 index.
  • Government Policies: The Indian government’s policy choices and changes may have a direct or indirect impact on a number of sectors and industries, including those that make up the Nifty 50.
  • Market Sentiment: The Nifty 50 index may briefly fluctuate depending on investor and market psychology. Bullish sentiment and good news typically push prices up, while bad news might push prices lower.
  • Global Commodity Prices: Particularly in industries like energy, manufacturing, and metals, the expenses and profitability of businesses can be impacted by changes in the price of important commodities like oil and metals.
  • Corporate Events: The index may be impacted by corporate events such as mergers and acquisitions, stock splits, dividend declarations, and changes in management of Nifty 50 businesses.
  • Technical Analysis: Chart patterns, trading activity, and moving averages can all have an impact on short-term trading decisions and contribute to changes in the price of the Nifty 50 index.
  • Market conditions and liquidity: can affect trading in the Nifty 50 index, particularly during times of extreme volatility. Market liquidity includes the number of buyers and sellers.

It’s important to note that the Nifty 50 index is a representation of the broader Indian stock market and is composed of 50 large-cap stocks from various sectors. As such, it is influenced by a combination of domestic and international factors, making it a complex and dynamic index to analyze and trade. Traders and investors often use a combination of fundamental and technical analysis to make informed decisions in the Indian equity markets.

FOR MORE INFO CLICK THIS SITE:https://learningsharks.in/

FOLLOW OUR PAGE:https://www.instagram.com/learningsharks/?hl=en

What are Stock Option Planning and Strategies?

In order to attain specified objectives, control risks, and maximise profits, stock option planning and strategies involve the use of stock options as part of a person’s or a business’s financial planning. The right to buy (call option) or sell (put option) a defined number of shares of stock at a fixed price (strike price) within a predetermined period of time (expiration date) is provided by stock options, but not the duty to do so. Here are some planning and strategy examples for common stock options:

ESOs, or employee stock options:

  • Employers provide stock options to employees as a form of pay through employee stock option plans (ESOPs). ESOPs can be utilised to recruit and keep top personnel while coordinating employee goals with business success.
  • Vesting Schedules for Stock Options: Businesses frequently impose vesting schedules, requiring workers to work for the company for a predetermined amount of time before they can exercise their options. This encourages worker loyalty.
  • Employees have the option of exercising their stock options and keeping the shares, which could result in long-term stock price growth.
  • Employees may exercise their options and sell the shares right away in order to make a profit. Employees can manage risk and gain from this tactic.

Strategies for Investor Stock Options:

  • With covered call writing, stockholders can sell call options on their holdings and profit from the premium they receive. The option expires worthless and the investor keeps the premium if the stock price stays below the strike price.
  • Put options can be bought by investors to shield their stock holdings from potential downward risk. The put option can reduce losses if the stock’s price decreases.
  • Buy call and put options with the same expiration date but different strike prices as part of the straddle and strangle strategies. They are employed when investors expect high levels of price volatility but are unsure of the movement’s direction.
  • Spreads that profit from either bullish (call spreads) or bearish (put spreads) market movements can be made using options. With these tactics, options with various strike prices and/or expiration dates are bought and sold.

Tax Preparation:

  • Exercise at a Tax-Effective Time: The timing of stock option exercise might have tax repercussions. It can be smart to schedule your exercise when your tax liability is smaller.
  • The tax treatment of various stock option types, such as Incentive Stock Options (ISOs) and Non-Qualified Stock Options (NSOs), varies. Planning for taxes requires an understanding of these distinctions.

Risk Administration:

  • Hedging Techniques: Using options, investors can protect their current stock positions from unfavourable price changes. For instance, purchasing put options might shield you from future losses.

Leverage and Speculation:

  • Trading Options: Traders can utilise options for speculative purposes by placing bets based on predictions of future changes in stock price. Leverage is a feature of options that enables traders to take control of a greater position with a lower outlay.

Earnings Generation:

  • Selling Cash-Secured Puts: Investors may sell put options with the goal of acquiring the underlying shares at a reduced price in the event that the option is executed. This tactic creates income and may result in the purchase of stocks at a discount.

Estate Management:

  • Giving Stock Options: Giving stock options to family members is one estate planning strategy that can be used to transfer wealth while minimising tax responsibilities.

Stock options can be complicated financial tools, therefore their use should be carefully assessed in light of a person’s financial objectives, level of risk tolerance, and tax situation. When adopting stock option planning and tactics, it is frequently advisable to speak with a financial counsellor or tax expert. Additionally, depending on the market environment and a person’s unique situation, other techniques may be used.

FOR MORE INFO CLICK THIS SITE:https://learningsharks.in/

FOLLOW OUR PAGE:https://www.instagram.com/learningsharks/?hl=en
Federal Bank, HDFC Bank, Axis Bank: What Rahul Sharma of JM

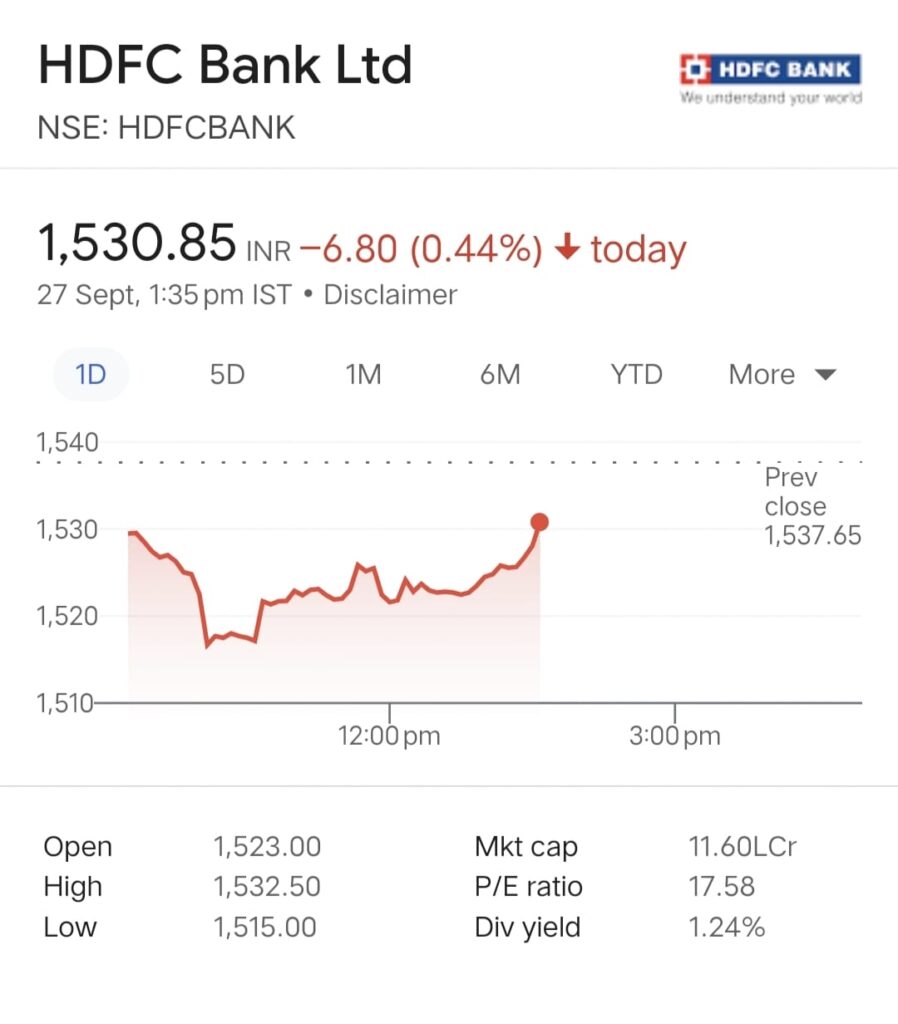
“If I were to set a target, Rs 1,450 is a level at which we should anticipate the stock to be. For the time being, unless Rs 1,600 is successfully handled, it is more of a’sell on rise’ stock, Sharma said BT TV.

Meanwhile, Indian equity benchmarks fell sharply in early deals today, dragged by banks and financials. On the other hand, broader market (mid- and small-cap) shares were positive.
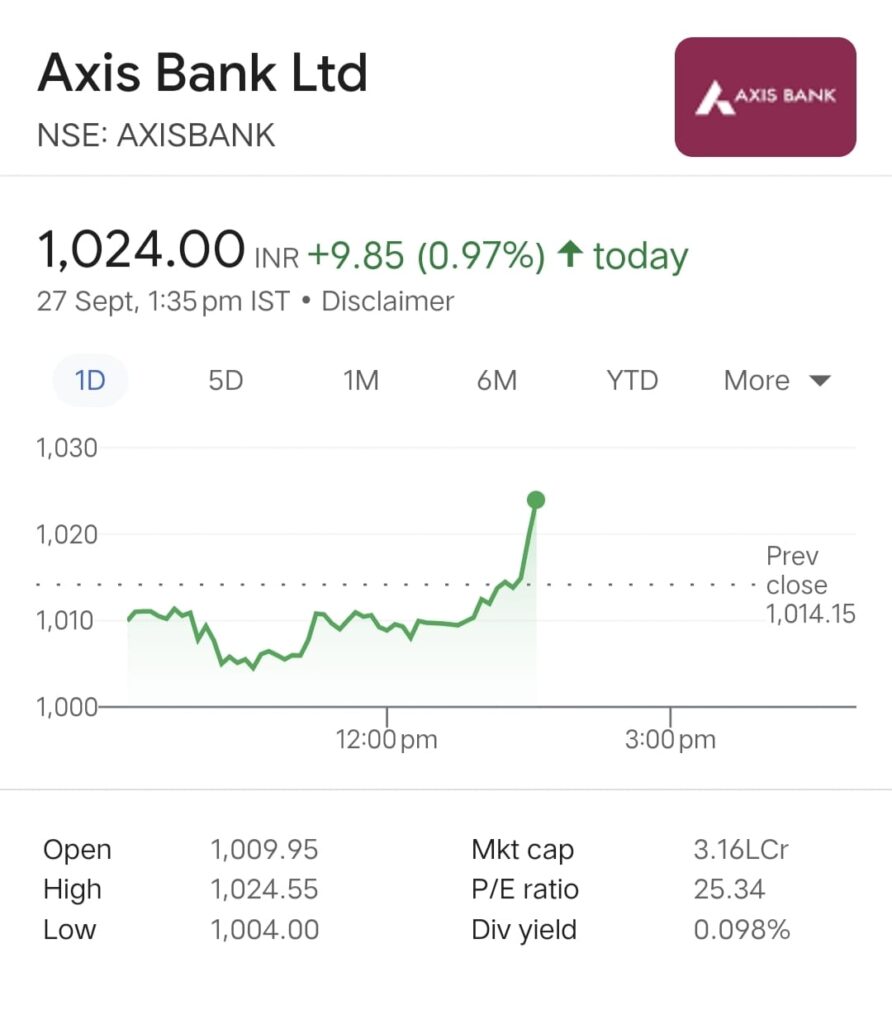
Today’s top stock picks: Sharma claimed that for Axis Bank, a little breakthrough might occur over Rs 1,027.
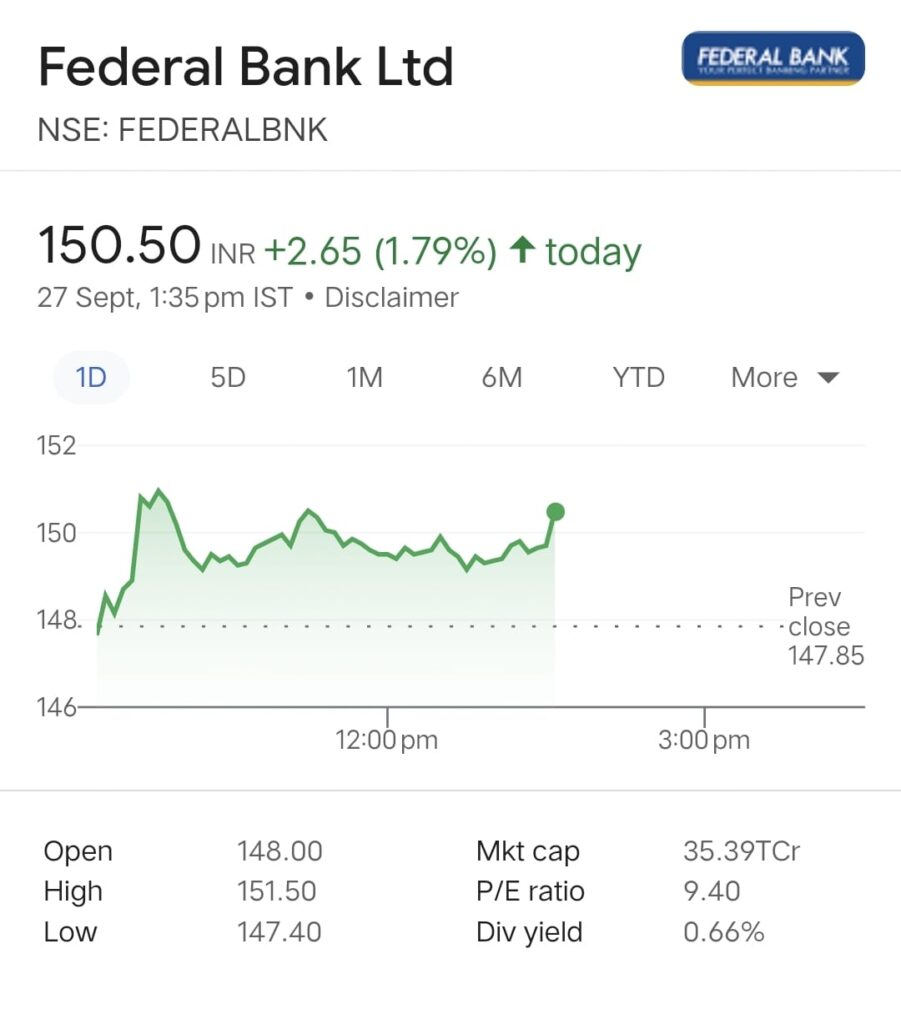
  • On Wednesday, Federal Bank was chosen by Rahul Sharma, Director & Head of T&D Research at JM Financial, as one of his top stock selections. Sharma told BT TV that despite the Nifty Bank fall, the stock has displayed exceptionally strong resilience.
  • “We anticipate Federal Bank Ltd. testing the Rs. 160 mark soon, and one can buy the counter with a stop loss of Rs. 145. Once Nifty Bank gets going, the relative strength the company has shown should convert into momentum, he said.

The market analyst responded to a question concerning HDFC Bank by stating that the stock is currently trading below both the short-term and long-term moving averages.

  • The market analyst stated in answer to a question regarding Aditya Birla Fashion and Retail Ltd. that the counter today had an upswing with respectable volumes. Long-term investors may consider holding this stock, and Rs. 174 should serve as support, Sharma noted.
  • According to preliminary stock market statistics, domestic institutional investors (DIIs) purchased shares worth Rs 714 crore during the previous session, while foreign institutional investors (FIIs) sold shares worth Rs 693 crore on a net basis.

In terms of individual stocks, ICICI Bank was the worst performer in the Nifty group as the stock fell 1.38 percent to close at Rs 935.6. As much as 1.37 percent was lost by HDFC Bank Ltd., Tata Steel Ltd., Eicher Motors Ltd., and Bajaj Finance Ltd.

CONCLUSION

FOR MORE INFO CLICK THIS SITE:https://learningsharks.in/

FOLLOW OUR PAGE:https://www.instagram.com/learningsharks/?hl=en

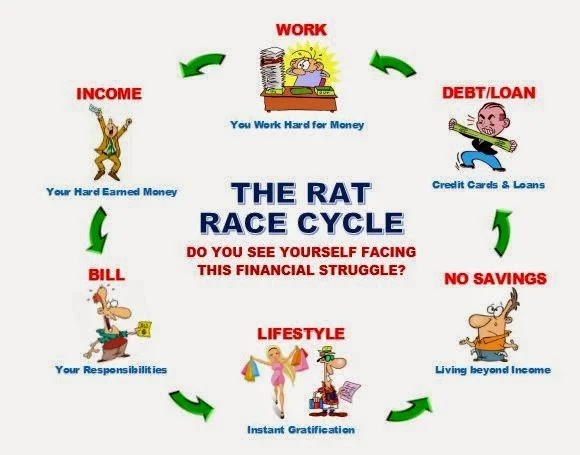
Are We Becoming A Part of The Rat Race?

From the time we are young, our lives are pretty unpredictable. We want the toy that a friend has but our parents can’t afford it. When we are in college, our pocket money isn’t enough to cover our expenses. When we start getting paid, our salaries are so low that we have to move to a completely different city. We split the rent bill with a roommate for a subpar apartment that you don’t even like.

Then, all of a sudden, the day comes when you start receiving the handsome salary you’ve always wanted, and you realize that you need the priciest phone, the car of your dreams, or the home of your dreams to appear successful to those around you. Eventually, you get the things you’ve always wanted. But soon you realize that despite having all the material possessions you wanted, you are still unhappy with your life because they did nothing to make it better. In fact, you needed more stuff the more money you earned.Because it was never enough and never will be enough, you couldn’t be satisfied even with a promotion or pay raise.

The truth is that we are all involved in a rat race, and the problem with this race is that there is no end in sight. And because there is no end, you don’t even notice that no one is waiting for you with a gold medal at the other end. The cycle of consumption simply never ends, and the longer you engage in it, the more natural it becomes. You gradually begin to forget that things weren’t always this way.

Now comes the million dollar question. How Do I Get Off the Wheel?

Being aware of the rat race is the first step in escaping it. It’s simple to convince yourself that having a large mortgage and a high car payment will make you happy when you’re just trying to keep up, but it’s more crucial to understand that your stressors are entirely self-inflicted.

The good news is that since you managed to get yourself on the wheel, you can now remove yourself from it.

Consider altering your workweek.

The 9-to-6 grind is the only way to succeed in the rat race, but it’s not the most effective way to save money. Consider allocating at least 15% of your time to activities that improve your quality of life and 40% of your time to developing new platforms (instead of maintaining existing ones) rather than concentrating on how to achieve immediate results.

What if, on the other hand, you worked on a fresh long-term project on Tuesday and Thursday while completing your daily priorities on Monday, Wednesday, and Friday? How about taking a few days off? I know it sounds crazy, but switching up your routine can help you stop driving.

Pay yourself a little attention.

A rat who has been spinning the wheel for a while will tell you that although his income is ten times higher now than it was previously, his standard of living has not increased. His income disappears more quickly the harder he works and the more he spends. You must pay yourself first and put some money away to build up for the future if you want to break free from this vicious cycle.

Strictly adhere to this (only purchase items that improve your quality of life).

We are frequently drawn into the rat race by our culture of consumption. We are taught from a young age that the ideal Indian dream consists of a four-bedroom bungalow with a lovely garden, but did you actually buy a home or did you simply find work as a maid or gardener?

Your possessions start to control you at a certain point. Make sure that whatever you spend your money on improves your quality of life.

Last but not the least (Lead by example).

For the first time in a long time, you may look around and discover that there aren’t many people nearby. Your energy may have even been depleted by the rat race.

You must first show proof of the idea in your own life before you can assist others in escaping the rat race. Try allowing them to work on their passion projects during the week and encouraging them to make an investment in themselves. After all, you worked so hard to get off the wheel yourself; you don’t want a bunch of people running on it for you!You’ll be able to move freely and take in your surroundings without getting dizzy once you’ve left the rat race.

(Keep in mind that life is about the journey rather than the final destination and that you don’t want to spend it running in circles)

FOR MORE INFO CLICK THIS SITE:https://learningsharks.in/

FOLLOW OUR PAGE:https://www.instagram.com/learningsharks/?hl=en

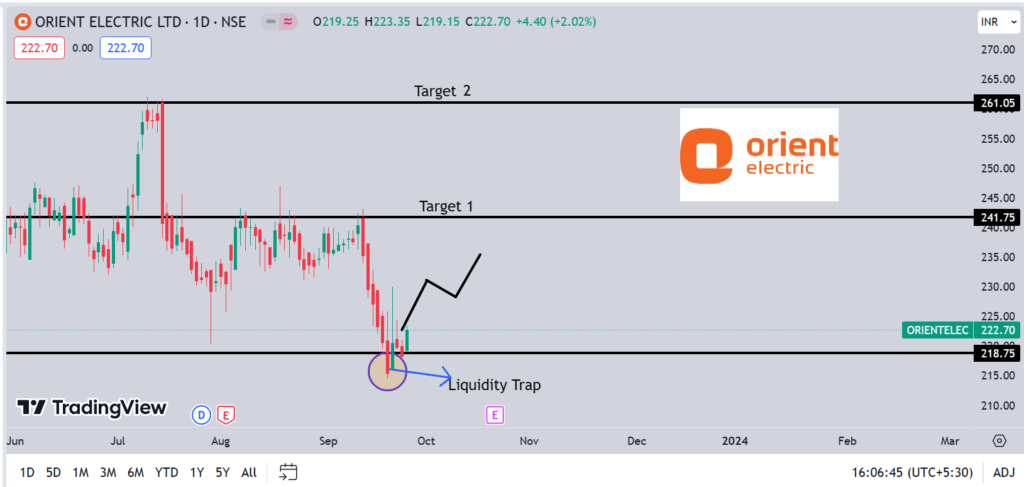
Orient Electric Share price Analysis- Buy, Sell or Hold

For the fiscal ended March 2023, the firm reported a 67.13% rise in profit to Rs 167.71 crore against a profit of Rs 100.35 crore in the previous fiscal.

An Indian company called Orient Electric Limited provides electrical solutions for everyday life. The company’s main business activities include the production, acquisition, and marketing of switchgear, lighting, and other electrical consumer durables. The company has production facilities in Kolkata, Noida, and Faridabad. Lighting and Switchgear and Electrical Consumer Durables make up the company’s two business segments. Our experts advice that one can buy orient electric shares at Rs220 with a target of 240 and 260.

Technical Analysis

Let us look at the Fundamentals

Profit & Loss

Figures in Rs. CroresPRODUCT SEGMENTS

Mar 2017Mar 2018Mar 2019Mar 2020Mar 2021Mar 2022Mar 2023TTM
Sales +2121,6001,8642,0622,0332,4482,5292,613
Expenses +1881,4611,7211,8851,8132,2172,3782,456
Operating Profit24139143177220231151157
OPM %11%9%8%9%11%9%6%6%
Other Income +1384662724
Interest324232621202223
Depreciation220234043475455
Profit before tax2098105114162170102103
Tax %41%35%34%31%26%25%26%
Net Profit +126469791201277677
EPS in Rs3.023.273.715.645.973.563.60
Dividend Payout %0%33%31%31%35%34%42%
Compounded Sales Growth
10 Years:%
5 Years:10%
3 Years:7%
TTM:-1%
Compounded Profit Growth
10 Years:%
5 Years:3%
3 Years:-1%
TTM:-46%
Stock Price CAGR
10 Years:%
5 Years:10%
3 Years:7%
1 Year:-19%
Return on Equity
10 Years:%
5 Years:23%
3 Years:22%
Last Year:13%

Balance Sheet

Figures in Rs. CroresCORPORATE ACTIONS

Mar 2017Mar 2018Mar 2019Mar 2020Mar 2021Mar 2022Mar 2023
Share Capital +21212121212121
Reserves192242285338434520563
Borrowings +211186135155616897
Other Liabilities +338359447446645579583
Total Liabilities7408088899601,1621,1871,265
Fixed Assets +109106117190186212226
CWIP0541011386
Investments0000000
Other Assets +630698768760965972953
Total Assets7408088899601,1621,1871,265
Disclaimer : The information mentioned above is merely an opinion and should only be treated for educational purposes. If you have any questions or feedback about this article, you can write us back. To reach out, you can use our contact us page.

What is PCR? How does it work in daily Intraday Trade?

“Put-Call Ratio” is what PCR stands for when referring to intraday trading. It is a well-liked technical indicator that investors and traders use, particularly in the options market, to evaluate market mood and probable future price moves. By comparing the total number of put options traded against the total number of call options traded on a particular underlying asset, such as a stock or an index, the put-call ratio is determined.

PCR (Put-Call Ratio)

The Put-Call Ratio in daily intraday trading operates as follows:

1.How to Determine the Put-Call Ratio: Typically, one of two methods is used to determine the put-call ratio:

  • Volume-based PCR: In this technique, the overall trading volume of call options is contrasted with the total trading volume of put options. The volume-based PCR would be 0.5 (1,000/2,000) if 1,000 put options and 2,000 call options were traded as an example.
  • Open Interest-based PCR: This technique makes use of the total open interest, or the amount of active put and call option contracts. The open interest-based PCR for 5,000 open put contracts and 10,000 open call contracts would be 0.5 (5,000/10,000).

2. Understanding PCR Results:

  • PCR 1: A PCR below 1 shows that there are more open call contracts or traded call options than there are put options. As traders are more likely to purchase call options in expectation of price increases, this may indicate a bullish sentiment.
  • PCR > 1: A PCR above 1 suggests that there are more open put contracts than there are traded put options. Given that traders are buying put options as protection against probable price falls, this may indicate a negative sentiment.
  • PCR = 1: A PCR of 1 indicates a balanced market mood, with the quantity of call and put options traded being equal.

3. Intraday Trading using PCR:

  • The Put-Call Ratio is frequently used by intraday traders as a contrarian indicator. A market may be overbought if the PCR is exceedingly low (showing extreme bullishness), in which case a correction may be just around the corner. On the other hand, a very high PCR (signalling extreme bearishness) can indicate an oversold market, in which case a rebound might be anticipated.
  • The Put-Call Ratio is a trading tool used to confirm other technical or fundamental indications. For instance, the bearish case for a stock may be strengthened if it exhibits technical negative patterns and has a high PCR.
  • Risk management: PCR can also be used by intraday traders to control risk. Traders may modify their holdings or employ protective measures like purchasing put options or tightening stop-loss levels in response to a rising PCR, which might indicate an increase in negative sentiment.
  • Timing considerations made by intraday traders may take PCR into account. For instance, a trader would seek for opportunities to enter short positions for a potential reversal if the PCR is unusually low and the market is exhibiting symptoms of fatigue in an upswing.

It’s crucial to remember that even though the Put-Call Ratio might offer insightful information on market sentiment, it shouldn’t be used in isolation. In order to make informed intraday trading decisions, traders often utilise it in conjunction with other technical and fundamental indicators. Additionally, PCR values may be interpreted differently based on the particular market circumstances and the underlying item being traded.

FOR MORE INFO CLICK THIS SITE:https://learningsharks.in/

FOLLOW OUR PAGE:https://www.instagram.com/learningsharks/?hl=en

What are the factors affecting the Foreign Exchange Market?

Numerous variables can affect the exchange rates between different currencies in the foreign exchange (forex or FX) market. Macroeconomic and geopolitical factors can be broadly categorised into two primary groups.

Foreign Exchange Market
  • Interest rates: are determined by central banks and have an impact on how appealing a currency is. Higher interest rates frequently draw foreign investment, which raises demand for the currency and may support its value.
  • Economic Indicators: A number of economic indicators, including GDP growth, employment data, inflation rates, and manufacturing data, can have an impact on currency values and market mood. A stronger currency is frequently a result of excellent economic performance.
  • Political Stability: The general economic and political climate of a nation can have an impact on investor confidence. Stronger currencies are typically seen in nations with stable governments and economy.
  • Trading and investing speculation:can cause short-term swings in exchange rates since traders and investors frequently make predictions about currency movements.
  • Central bank interventions: To affect exchange rates, central banks can buy or sell their own currency on the forex market. The value of currencies may be significantly affected by these measures.
  • Market Attitude: In the foreign exchange markets, trader attitude and market psychology are quite important. Exchange rates can vary quickly as a result of news, events, and rumours.
  • Trade Balance: A nation’s currency may be affected by its trade balance, which is the difference between its exports and imports. A currency can be strengthened by a trade surplus (more exports than imports), but a currency can be weakened by a trade deficit.
  • Geopolitical Events: Political occurrences like elections, wars, and trade disputes can wreak havoc on currency values and cause uncertainty. For instance, the British Pound was significantly impacted by Brexit.
  • Market Liquidity: Depending on the time of day and trading sessions, the forex market’s liquidity can change. Volatility may rise as a result of low liquidity.
  • Market SentimentTraders frequently respond in irrational ways to news, rumours, and events, causing sharp changes in sentiment and currency values.
  • Natural disasters: Natural disasters can affect a nation’s currency by upsetting its infrastructure and economy.
  • Monetary Policy: The monetary policy choices made by central banks, such as adjustments to interest rates or the implementation of quantitative easing plans, can directly affect the prices of currencies.
  • Global Economic Conditions: More general aspects of the global economy, such as the state of the financial markets and the state of the world economy, can have an impact on currency fluctuations.

FOR MORE INFO CLICK THIS SITE:https://learningsharks.in/

FOLLOW OUR PAGE:https://www.instagram.com/learningsharks/?hl=en