Learning sharks-Share Market Institute


Rajouri Garden  8595071711 7982037049  Noida 8920210950 , and  Paschim Vihar  7827445731  

Fee revision notice effective 1st April 2025; No change for students enrolled before 15th May 2025

Download “Key features of Budget 2024-2025here

Stock Market Return

Topics Covered

  1. What Is the Average Stock Market Return?
  2. S&P 500 Average Return: 5-year, 10-year, 20-year, 30-year
  3. S&P 500 Average Return: 5-year, 10-year, 20-year, 30-year
  4. Average Market Return for the Last 5 Years
  5. Average Market Return for the Last 10 Years
  6. Average Market Return for the Last 20 Years
  7. Average Market Return for the Last 30 Years
  8. What Is a Stock Market Return?
  9. Factors That Impact the Stock Market
  10. Measuring Growth in the Stock Market
  11. What Is a Good Yearly Return on Stocks?
  12. Why the S&P 500 Average Return Isn’t Always Average
  13. Dot-Com Bubble
  14. Financial Crisis of 2008
  15. Market Recovery
  16. Future Stock Market Growth Predictions
  17. CONCLUSION

What Is the Average Stock Market Return?

Learning sharks stock market Institute

It’s critical for investors to comprehend typical stock returns and the potential implications for long-term portfolio growth. Based on the S&P 500, the overall average stock market return is about 10% each year; however, when inflation is taken into consideration, the actual return is more in the range of 6% to 7%.


It’s unusual for the stock market’s annual average return to be 10%. Only eight times in the nearly 100 years of data (1926 to 2021) was the average annual stock market return between 8% and 12%. Real stock market returns can be either larger or significantly lower.


This ongoing crisis in the stock market has a bright side. There is a potential that someone who loses thousands of dollars in the stock market will eventually make it up. To avoid losing money when the market has a terrible week, many experts advise hanging onto investments rather than switching to other stocks.


Yes, the investment might be a long-term endeavor. But how much profit can investors anticipate in a typical year or decade?


Before retiring, a lot of people want to know how much they stand to gain or lose. Every stock market investor should consider the stock market return, which is the amount they gain or lose over time.

S&P 500 Average Return: 5-year, 10-year, 20-year, 30-year

Typically, people don’t make stock market investments for only one year. Instead, they make long-term investments in the hopes that the investments they purchase today will be worth more when they decide to sell them in the future. To better comprehend stock price movement, it may be more beneficial to look at the average stock market return over the past 10, 20, and 30 years.


We may begin to obtain a sense of the typical market returns going back 5, 10, 20, and 30 years by looking at the S&P 500. Here are the last three decades’ average stock market returns, as determined by MoneyChimp.

Average Market Return for the Last 5 Years

The average stock market return over the last five years was 17.04% (13.64% when adjusted for inflation), according to S&P annual returns from 2017 to 2021. That exceeds the ordinary stock market average return of 10% by a wide margin. This number may have been even greater if the market hadn’t experienced early-2020 pandemic-related volatility.

Average Market Return for the Last 10 Years

Looking at the S&P 500 from 2012 through 2021, the average yearly return has been higher than the 10-year average return of 10%, at 14.83% (12.37% when adjusted for inflation).


The stock market underwent ups and downs over the course of the decade, but only 2015 and 2018 saw losses, and even those losses weren’t significant at 0.73% and 6.24%, respectively.

Average Market Return for the Last 20 Years

The average stock market return for the past 20 years, measured in terms of the S&P 500 from 2002 to 2021, is 8.91% (6.40% when adjusted for inflation).


During the first decade of 2000, the United States saw some significant lows and notable highs.


The market was performing extraordinarily well at the beginning of 2000, but from late 2000 to 2002, the dot-com bust caused losses for three straight years. The era following 9/11 in 2001 wasn’t helpful.


The financial crisis caused significant losses in 2008. The fact that the 20-year average stock market return is lower than the annual average is not at all surprising when these factors are taken into account.


Average Market Return for the Last 30 Years

The average return gets a little bit closer to the annual average of 10% when we add another decade to the mix. The average stock market return for the past 30 years, measured in terms of the S&P 500 from 1992 to 2021, is 9.89% (7.31% when adjusted for inflation).


The dot-com bubble in the late 1990s (before the crisis), which produced strong return rates for five straight years, can be partly blamed for this performance.

What Is a Stock Market Return?

A stock market return is a return on an investor’s investment in the form of a profit, dividend, or both. Knowing why the stock market varies might be useful in understanding stock market results.


According to a number of variables, including supply and demand, market mood, changes in revenue, and political difficulties, to mention a few, a company’s share price may rise or fall. The average rate of return on equities that a shareholder realizes can be influenced by all of these variables.


In a linked economy, seemingly unrelated financial issues, such as rising trade tariffs between two countries, can affect the valuation of some equities. Since the stock market is erratic, it can occasionally be affected by recent developments abroad and abrupt changes in the costs of commodities that are accessible to businesses and consumers in the US.


Investors may benefit from understanding the changes by using a specific stock as an example, such as an airline stock, and then applying what they learn to the entire stock market.


For instance, academics have claimed that listed firms’ market values decreased by $1.7 trillion as a result of the imposition of retaliatory tariffs on steel and aluminum imports from China to the US. Other analysts assert that over the course of a year, U.S.-China tariffs cost the typical American household $374.


Factors That Impact the Stock Market

The value of stocks and the typical return on investments for investors are influenced by a variety of factors.


Keeping with the airline example, some of the U.S. airline industry’s revenue comes from people choosing to pay for flights they do not necessarily need to take. The market may respond out of fear of future sales declines or worry about the rising cost of doing business when trade battles leave American consumers with less disposable income (i.e., certain taxed imports suddenly costing more). This is referred to as market sentimentality, and it can lower the value of a stock.


China retaliated by imposing tariffs on American goods after the U.S. raised import taxes on metals from China. A one-day loss of $1 trillion in the value of global stocks was caused by China’s 2019 declaration of retaliatory tariffs against the U.S., which would affect products like appliances, agricultural, construction, textiles, and rubber made in the United States.


The stock market as a whole may go up or down when the share values of numerous companies change concurrently. Shares of multiple large corporations may fall, and the public may lose confidence in the U.S. economy if a trade war impacts various companies’ foreign output or consumers’ capacity to spend domestically. Because of this, the market can decline. Some stocks may increase when import and export tariffs are removed because traders expect lower costs to be passed on to customers and enterprises.


Returns on the stock market are impacted by all of this volatility. People often inquire how much they will have gained (or lost) after a year, 10, 20, or 30 years when they wonder what their return will be. Despite the fact that each investor chooses their own companies and funds, looking at the average stock market return is a quick and easy approach to predict how much money they might make.

Measuring Growth in the Stock Market

How are stock market returns calculated? by examining the indexes. There are about 5,000 indexes that represent US stocks; an index is a collection of stocks that represents a segment of the stock market. The Dow Jones Industrial Average, Nasdaq Composite, and S&P 500 are the three most popular market indices, which investors may be familiar with.


The 500 largest publicly traded firms, including Microsoft, Apple, Amazon, Facebook, and Alphabet, are represented by the S&P 500 index. Its performance is seen as a good indicator of how the market is doing generally because it represents about 80% of the US stock market.


The S&P 500 is frequently used when discussing the stock market and the average stock market return.

What Is a Good Yearly Return on Stocks?

It’s crucial to be realistic when discussing the typical rate of return on equities and what you can anticipate. As previously stated, the typical stock market return tends to be around 10%, but when inflation is taken into account, returns are typically closer to 6%.


Using the 6% number as a starting point, an investor may decide to build a portfolio that is intended to provide returns at that rate. You’re more likely to see stock market returns that are in the average or normal range if you have investments in funds that follow the S&P 500. Anything above 6% may be viewed as the cherry on top.


An investor seeking above-average stock market returns may decide to develop their portfolio more aggressively, looking at actively managed funds or momentum trading, for example, in an effort to take advantage of higher return potential. However, those tactics may carry more risk, and as always, there is no assurance that an investor would outperform the market. Additionally, paying greater expense ratios or charges due to active trading may reduce investment gains.


An investor may experience consistent returns over time by employing a buy-and-hold strategy and continuing to invest through market ups and downs. For instance, with dollar-cost averaging, investments would be made regardless of how high or low stock prices rose or fell. They might not outperform the market in this manner, but they would be able to ride the waves of the market as stock market returns rose or fell.


An investor who adopts this mindset will be less likely to panic and sell when market turbulence arises. This is crucial since timing your exit or entry into the market incorrectly could have a major influence on your portfolio’s overall return profile.

Why the S&P 500 Average Return Isn’t Always Average

Because outliers can skew the yearly average, the annual average of 10% is not a good predictor of stock market returns for a given year. Outlier years are years where the return is significantly greater or lower than average.


When compared to the return over the previous 10 years, which was 14.83%, the average stock market return over the past 20 years, for instance, may look modest at 8.91%. But from 2000 to 2009, not every year was awful for the stock market. In actuality, the average return in 2003 was 26.38%, while in 2009, it was 23.45%. However, there were unfavourable outliers that had an impact on the 20-year average.

Dot-Com Bubble

Outliers in the stock market are perfectly illustrated by returns from 2000 to 2009. The dot-com bubble, which erupted in the late 1990s, saw a boom in the number of technology and web-based businesses. Investors began selling their shares in a frenzy in 2000 as a result of massive “sell” orders issued on their stocks by businesses like Cisco and Dell.


The market lost money every year for three years during this time, which is frequently referred to as the “dot-com bust.” Average yearly losses were 10.14 percent in 2000, 13.04 percent in 2001, and 23.3 percent in 2002.

Financial Crisis of 2008

The 2008 financial crisis is a further illustration of an outlier. For many years, banks have provided atypical loans to people with poor credit and low incomes so they can purchase homes. As more people purchased homes, housing costs skyrocketed. People were no longer able to afford their homes, which created difficulties for the lenders.


In September of that year, the Fed presented a bank bailout measure, but Congress rejected it, causing a market crash. Although the legislation was passed by Congress in October, the stock market damage was not immediately repaired. The market return was down a staggering 38.49% in 2008.

Market Recovery

The 2008 financial crisis and the dot-com crash are two prominent examples of outliers that have reduced stock returns more than typical. However, the stock market skyrocketed in the years that followed these unfavorable exceptions.


In late 2003, the dot-com bust-related panic and other tensions began to subside, and the market returned 26.38% for the year. Up until the 2008 financial crisis, annual average returns remained in an upward trend for four more years.


Following the 2008 market meltdown, the market recovered in 2009 with a return of 23.45% and then kept growing for the following six years. The first decline occurred in 2015, however, it only decreased by 0.73%.


Strong increases—even if they aren’t huge—and successive annual gains frequently come after sharp declines. When share prices began to fall in 2008, anyone who panicked and sold their stocks undoubtedly suffered significant financial losses. But by 2012, when market returns had finally improved enough to counterbalance how much the market had lost in 2008, individuals that hung onto their investments presumably saw an improvement in their incomes.


It may be wise to keep the big picture in mind when the stock market faces a negative aberration.

Future Stock Market Growth Predictions

When the stock market performs poorly, as it did during the dot-com crash and financial crisis, we may observe that it eventually recovers. The stock market will eventually slow down and suffer a loss if it performs very well. This can aid in balancing out investors’ average stock return.


According to the commonly established rule, if an investor’s rate of return is low right now, they can anticipate that it will be high in the future; if it is high right now, they can anticipate that it will be low. In the past, the market has maintained equilibrium and expanded favorably overall. Returns on the stock market rise around 70% of the time.


A stock market correction occurs when share prices reach their peak and subsequently decline by 10% or more. Investors can wager that the market will correct itself by dropping if it is doing well.


There is no way to guarantee a given stock market return at all, much less over a specific period of time, as all investments carry risk. It can be challenging to anticipate a stock’s performance with accuracy because many factors influence stock performance. And it is completely false to believe that investors can time the stock market to optimise gains.

CONCLUSION

Although the U.S. stock market returns 10% on average each year, there are certain limitations to that figure.


Realistically, when inflation is taken into consideration, that number is closer to 6% to 7%. Additionally, a 10% stock market return occurs only occasionally; the figure represents an average rather than the norm. Some years are higher than others, and vice versa.


Some investors might find it enjoyable to follow the stock market’s ups and downs. Others could have anxiety when attempting to decide when their stocks are at an all-time high or are going downhill. Each investor has their own unique style. Members can choose between active and automated investing with SoFi Invest® to choose the investing approach that suits them best.


For those who prefer a hands-on approach, active investing is for you. They are free to trade and check their stocks online as they like. A hands-off approach is preferred by those who use automated investing. The SoFi Invest® app allows them to enter their objectives, and SoFi handles the rest.

Stock Market Research

Learning sharks stock market Institute stocK

Topics Covered

  1. Bond Market vs. Stock Market: What’s the Difference?
  2. Bond Market vs. Stock Market: An Overview
  3. KEY TAKEAWAYS
  4. The Bond Market
  5. Where Bonds Are Traded
  6. Who Participates in the Bond Market?
  7. Bond Ratings
  8. The Stock Market
  9. The Prominent U.S. Stock Exchanges
  10. CONCLUSION

Bond Market vs. Stock Market: What's the Difference?

Bond Market vs. Stock Market: An Overview

Now is the moment to make an investment. So, how precisely are you planning to spend that cash? After all, before you begin to purchase assets such as stocks and bonds, a well-diversified portfolio approach is advised. In fact, stocks and bonds are two of the most traded asset classes, each of which can be purchased through a variety of platforms, marketplaces, or brokers. Additionally, there are significant, fundamental distinctions between stocks and bonds.

KEY TAKEAWAYS

  • Investors can trade equity securities (such as shares) issued by firms on a stock market.
  • Investors can purchase and sell debt instruments issued by governments or firms on the bond market.
  • Bonds are often sold over the counter rather than in a centralized place, while stocks typically trade on a variety of exchanges.
  • The two most well-known stock exchanges in the United States are Nasdaq and the New York Stock Exchange (NYSE).

The Bond Market

Investors transact (buy and sell) debt securities, most notably bonds, issued by firms or governments on the bond market. The debt or the credit market are other names for the bond market. All of the securities offered on the bond market are different kinds of debt. You are lending money for a predetermined time period and charging interest when you purchase a bond, credit, or debt security, just like a bank does to its borrowers.


Investors can receive a consistent, albeit small, stream of regular income from the bond market. Investors in certain securities, such as Treasury bonds issued by the federal government, get interest payments every two years. In order to save money for their children’s school, their retirement, or other long-term goals, many investors decide to include bonds in their portfolios.


Investors can learn more about bonds using a variety of research and analytical tools. One resource that breaks down the fundamentals of the market and the various kinds of securities accessible is Investopedia. The Bond Center on Yahoo! Finance, and Morningstar are further resources. They offer current information, news, research, analysis, and analysis. Through their brokerage accounts, investors can also access more particular information on bond offerings.

Where Bonds Are Traded

Because there is no central place for trading in the bond market, most bonds are sold over the counter (OTC). As a result, retail investors rarely engage in bond market activity. Large institutional investors like pension funds, foundations, and endowments, together with investment banks, hedge funds, and asset management companies, are some of those who do. Bonds can be purchased by individual investors through a bond fund that is overseen by an asset manager. Individual investors can now also access corporate bond issuance, Treasuries, munis, and CDs directly through several brokerages.


The primary market is where new securities are offered for sale, and the secondary market is where investors buy and sell securities they already own. These fixed-income securities include bonds, notes, and bills. Issuers can obtain the cash they require for projects or other necessary expenses by offering these securities on the bond market.

Who Participates in the Bond Market?

The following are the three principal parties active in the bond market:

Issuers: Whether corporations or various tiers of government, they are the organizations that create, list, and sell securities on the bond market. Consider the U.S. Treasury issues Treasury bonds, which are long-term investments with 10-year maturities and bi-annual interest payments for investors. investing in specific bond market segments, such as U.S. Treasury securities is regarded as less risky than stock market investments, which are more volatile.


Underwriters: In the financial industry, underwriters typically assess risks. An underwriter purchases securities from issuers in the bond market and resells them for a profit.


Buyers and sellers of bonds and other similar instruments are these companies. Through the purchase of bonds, the participant makes a loan for the duration of the security and is paid interest. The bond’s face value is returned to the participant when it matures.

Bond Ratings

Bond rating companies like Standard & Poor’s and Moody’s typically assign bonds an investment grade. This rating, which is represented by a letter grade, informs investors of the default risk associated with a bond. A bond with a rating of “AAA” or “A” is high-quality, but a bond with a rating of “A” or “BBB” is medium risk. Bonds rated BB or lower are regarded as high-risk investments.

The Stock Market

Investors can trade derivatives, such as options and futures, as well as equity securities, such as ordinary stocks, on a stock market. On stock exchanges, stocks are traded. Purchasing equity securities, sometimes known as stocks, entails purchasing a relatively modest ownership part of a business. Bondholders lend money with interest, but equity investors buy minor ownership in businesses in the hope that if the firm does well, the value of the shares they have bought would rise.


The main goal of the stock market is to bring buyers and sellers together in an atmosphere that is fair, regulated, and monitored so that they may carry out their transactions. This instills confidence in individuals involved that trading is carried out transparently and that prices are reasonable and honest.


The stock market is divided into two parts, just like the bond market. First-run stocks are only permitted on the primary market, where initial public offerings (IPOs) will be made. Underwriters, who determine the initial price for securities, help to facilitate this market. The secondary market, where the majority of trading occurs, is then opened up for equities.

The Prominent U.S. Stock Exchanges

The well-known stock exchanges in the United States include:

Nasdaq is a worldwide electronic exchange that lists the securities of local companies with modest market capitalizations. Although the majority of the index is made up of technology and financial equities, it also contains consumer goods and services, healthcare, and utilities. The benchmark index for the US technology sector is likewise based on this exchange.


According to the overall market value of the securities it lists, the New York Stock Exchange (NYSE) is the biggest exchange in the entire world. The NYSE is home to many of the biggest and oldest publicly traded businesses. The Intercontinental Exchange (ICE) most recently acquired the NYSE in 2013 after a series of mergers.


The Dow Jones Industrial Average (DJIA), one of the oldest and most closely followed indexes in the world, is made up of thirty of the largest businesses listed on the NYSE.


American Stock Exchange (AMEX), which the NYSE Euronext purchased in 2017 and rebranded as the NYSE American.


It was first recognized for trading and launching new goods and asset classes. Additionally, the exchange was the first to release an ETF. The exchange trades largely small-cap equities electronically.


The United States controls these markets. Commission for Securities and Exchange (SEC).

CONCLUSION

The stock market features central hubs or exchanges where stocks are traded, which is a key distinction between the bond and stock markets.


The other key difference between the stock and bond market is the risk involved in investing in each. Investors may be exposed to risks when it comes to stocks, including currency risk, liquidity risk, interest rate risk, and country or geopolitical risk (based on where a company conducts business or is based). These risks can have an impact on a company’s debt, cash on hand, and bottom line. As opposed to stocks, bonds are more vulnerable to hazards like inflation and interest rates


When interest rates rise, bond prices tend to fall. You might receive less than the purchase price if you have to sell your bond before it matures due to high-interest rates. If you buy a bond from a company that isn’t financially sound, you’re opening yourself up to credit risk. In a situation like this, the bond issuer finds itself vulnerable to default since it is unable to make the interest payments.


The S&P 500 and Dow Jones Industrial Average are two indexes that can be used to broadly measure stock market performance. Similar to this, investors can monitor the performance of bond portfolios by using bond indexes like the Barclays Capital Aggregate Bond Index.

.

How can you become a stock market expert

expert in Learning sharks Stock market.

Consistent reforms in the Indian stock market, particularly in the secondary market, have resulted in modern technology and online trading, transforming the stock exchange. In the face of current turmoil and pessimism, Indian capital markets are poised as a fast-growing emerging market economy.


The Indian stock market has undergone structural transformations over the years, and it now compares favourably with those in developed markets. The development of stock markets reflects the growth of the capital market. Positive indicators include a consistent 8-9 percent annual growth rate, a GDP of $11.04 trillion, rising foreign exchange reserves of over US$ 513 billion, and a thriving capital market with the popular ‘Sensex’ index surpassing the majestic 36,000 mark. The Indian stock markets are becoming a popular destination for foreign investors.


So, if you want to become a stock market expert and maximize your returns, the BSE Institute has a course for you. Please read on for more information.


Steps to becoming an expert investor

We are all aware that investing in equities is the key to accumulating long-term wealth and becoming wealthy. It is important to remember, however, that not all stocks are created equal. While mid- and small-caps have the potential to generate high returns, large caps provide portfolio stability. This is not to say that you should ignore any of these stocks.


As a result, it is critical that you benefit from the high growth offered by mid-and small-cap stocks while also enjoying the stability offered by large caps.


Be strict with your stop loss. It means that if you are losing money, you should cut your losses and exit the market. Similarly, if you are on a winning streak, putting a proper stop loss in place will protect your profits if the stock markets begin to fall.


Learn whenever you suffer a loss. We lose money in the market as a result of our errors. Find out what went wrong and make sure it doesn’t happen again.


Avoid greed. It is all too easy to invest in a bad stock simply because it is rising in value. You might be in a hurry to make some quick cash for a down payment on a home loan or a down payment on a new car about to hit the streets. However, be cautious and keep in mind that this price increase is the result of market manipulation rather than any genuine change in the company’s financial situation. Also, keep in mind that in order to reap the most benefits, you must remain invested in a good stock for the long term.


Avoid leveraging. Many people take out large loans from others in order to maximise their profits. Though this may work in some cases, it can also result in massive losses if the market cycle turns. This can cause financial and mental stress, as well as the destruction of family lives and, in extreme cases, suicide.


Don’t act if you are not sure which way the stock markets will move. In such cases, it is preferable to remain a spectator rather than participate in market activity.


Read a lot. There are numerous good books on investing available. Always keep your knowledge up to date. Follow the thoughts and opinions of respected investors such as Warren Buffet, Rakesh Jhunjhunwala, and others. It will broaden your knowledge and prepare you to deal with any market situation with ease.


Limit the number of stocks. Make sure your portfolio contains no more than 20 stocks. To protect your portfolio’s value, make sure these stocks are from companies that operate in a variety of industries.


Don’t use various investment strategies. If you are comfortable with the buy and hold strategy, apply it to all of your stocks. Otherwise, you may be perplexed about which strategy actually helps you make money.

Remain patient and disciplined, Whatever the market conditions If the markets are falling, don’t get out; instead, wait for the market to rise. Also, don’t keep investing in the stock just because it’s rising in value.


Choose stocks as per your risk profile instead of the returns they generate. Do not invest in small- and mid-cap stocks if you are not comfortable with their high volatility.


Harsha Engineers Limited IPO

News alert

Harsha Engineers International Ltd IPO

Don’t have a demat account accountSign up

IPO date14 Sep 2022 – 16 Sep 2022
Listing date26 Sep 2022
Price range314 – 330
Minimum order quantity45
(D)RHPView

The company Harsha Engineers Limited produces precision bearing cages. It provides a broad range of precision engineering products for various end-user industries and geographical markets.


Harsha Engineers is active in two industry sectors:


Bearing cages, intricate and unique precision stamped components, welded assemblies, brass castings, cages, and bronze bushings are all produced by the engineering company.


The company’s solar EPC (Engineering, Procurement, and Construction) division offers complete turnkey solutions for all solar photovoltaic needs.

Customers can purchase the company’s goods in over 25 nations across five continents: North America, Europe, Asia, South America, and Africa. And as of CY 2020, the company owned 5.2% of the market share and about 50% of the market share in the organised section of the Indian bearing cages industry.


Harsha Engineers hopes to raise up to Rs. 755 crores through the public offering. The issue consists of a new equity share issue of up to Rs. 455 crores and an offer for sale of equity shares worth Rs. 300 crores from current shareholders.

Financial Snapshot

Financial Year EndedRevenue (₹ Crores)PAT (₹ Crores)EPS (₹)
March 2019117.91-27.41-13.7
March 2020899.5121.9093.52
March 2021876.7345.4395.88
September 2021637.6343.7075.66

IPO Schedule

Issue Period14th September to 16th September 2022
Finalization of Allotment21st September 2022
Initiation of Refunds22nd September 2022
Credit of Shares23rd September 2022
Date of Listing26th September 2022
Mandate end date2nd October 2022
Anchor Investors Lock-In End Date16th October 2022

Key Points

Strengths

1. Comprehensive solution provider offering diversified suite of precision engineering products across geographies and end-user industries
2. Long standing relationships with leading clientele
3. Strategically located domestic and international production facilities and warehouses
4. Expertise in Tooling, design development and automation

Risks

1. Depend on a limited number of customer groups for a significant portion of its revenue from engineering business
2. Inability to maintain relationships with its network of agents for fulfilment of needs of the customers or deficiency in the service provided by such agents may adversely affect the business
3. Any failure to obtain, renew or comply with necessary regulatory approvals and licenses may adversely affect the operations
4. The company and certain of its subsidiaries have unsecured loans that may be recalled by the lenders at any time
5. It also has certain contingent liabilities, which, if they materialize, may adversely affect the financial condition

Highlights of the Harsh engineers international

Harsha Engineers International, Ahmedabad based company, is the largest manufacturer of precision bearing cages, in terms of revenue, in organized sector in India, and amongst the leading manufacturers of precision bearing cages in the world. The company manufactures complex and specialised precision stamped components, welded assemblies, brass castings and cages & bronze castings and bushings.


The company’s products cater to sectors including automotive, aviation & aerospace, railways, construction, mining, renewable energy, agriculture and other industrial sectors, and offers a wide range of bearing cages starting from 20 mm to 2,000 mm in diameter.


The company commands approximately 50% of the market share in the organised segment of the Indian bearing cages market and 5.2% of the market share in the global organised bearing cages market for brass, steel and polyamide cages in 2020.
It is also an EPC service provider in the solar photovoltaic industry and also provides operations and maintenance services in the solar sector with over 10 years of operating history in the solar EPC business.


The company has five manufacturing facilities with two of its principal facilities at Changodar and one at Moraiya, near Ahmedabad in Gujarat, and one manufacturing unit each at Changshu in China and Ghimbav Brasov in Romania, which allow access to its customers in over 25 countries in North America, Europe, Asia, South America and Africa.

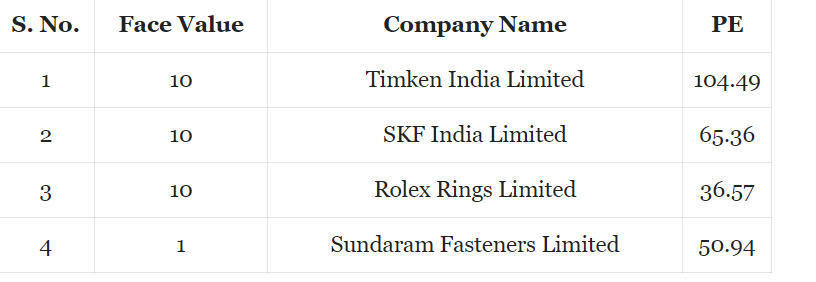
Competitive Analysis/ Market Peers

learning sharks stock market Institute

FAQS

The lot size of the Harsha Engineers IPO is 45 shares per lot. A retail investor can make a minimum investment of Rs. 14850 (1 Lots at Rs. 330) and a maximum of Rs. 1,93,050 (13 lots at Rs. 330).

The issue opens on 14TH September and closes on 16th September.

Promoters of Harsha Engineers include Sandeep Rajendra Shah, Harish Rangwala, Vishal Rangwala and Pilak Shah.

The IPO will be listed on 26TH September.

The proceeds from the issue will be used as follows:
1. Rs.270 crores for debt payment
2. Rs.77.95 crores for funding working capital requirements towards the purchase of machinery
3. Rs.7.12 crore for infrastructure repairs and renovation of the existing production facilities and general corporate proposes

The price band is set at Rs. 314 on the lower band and Rs. 330 on the upper band.

The Harsha Engineers IPO issue comprises of a fresh issue of equity shares worth Rs.455 crores, and an offer for sale (OFS) of up to Rs.300 crores by existing shareholders.

How do I apply to the Harsh engineers international?

You can apply for the Harsh engineers internationa IPO using any supported UPI app by following two steps:

  • Enter your bid on Kite
  • Accept UPI mandate on your phone

On acceptance of the mandate, the bid amount will get blocked in your bank account.

Where can I find the Harsh engineers international IPO's allotment status?

You can check the allotment status for the Harsh engineers internationa IPO on the website of the Registrar and Transfer agent.

Alternatively, you can also check the allotment status on the NSE website.

Stock Market Efficiency

Topics Covered

  1. What Is Market Efficiency?
  2. KEY TAKEAWAYS
  3. Market Efficiency Explained
  4. Differing Beliefs of an Efficient Market
  5. CONCLUSION

What Is Market Efficiency?

Stock Market Efficiency learning sharks

The degree to which market prices accurately reflect all available, pertinent information is referred to as market efficiency. There is no way to “beat” the market if markets are efficient since there are no assets that are undervalued or overvalued because all information is already factored into prices.


The phrase was coined by economist Eugene Fama in a 1970 paper, however, Fama admits that the phrase is a little deceptive because no one is really certain how to define or measure this concept of market efficiency. Despite these restrictions, the phrase is used to refer to the efficient market theory, which is what Fama is most famous for (EMH).


According to the EMH, it is impossible for an investor to outperform the market, and market anomalies shouldn’t exist since they would be quickly arbitraged away. For his contributions, Fama later received the Nobel Prize. Investors that embrace this notion frequently invest in index funds that follow the performance of the entire market and advocate for passive portfolio management.


The ability of markets to absorb information that gives buyers and sellers of securities the greatest number of opportunities to execute transactions without raising transaction costs is the essence of market efficiency. Academics and practitioners disagree sharply on whether or to what extent markets, including the U.S. stock market, are efficient.

KEY TAKEAWAYS

  • Market efficiency is the degree to which current prices accurately represent all pertinent and available information regarding the true worth of the underlying assets.
  • Since all information that is available to traders is already factored into the market price, a truly efficient market makes it impossible to outperform the market.
  • The market becomes more efficient as the quality and quantity of information rise, lowering prospects for arbitrage and above-market gains.

Market Efficiency Explained

Three levels of market efficiency exist. Because it is impossible to accurately estimate future prices based on historical price changes, market efficiency is weak. If current prices take into account all relevant information that is currently known, then all knowledge that can be learned from past prices is already taken into account by current prices. Future price changes can only result from the availability of fresh information, therefore.


According to this version of the hypothesis, it is not reasonable to anticipate that investing techniques like momentum or any rules based on technical analysis will consistently produce above-average market returns. This version of the hypothesis still leaves open the potential that by employing fundamental analysis, excess returns could be obtained.


The semi-strong form of market efficiency assumes that stocks quickly adjust to taking in new information that is made public, making it impossible for an investor to outperform the market by trading on that knowledge. Because any knowledge gleaned from the fundamental analysis will already be available and hence already incorporated into current pricing, it follows that neither technical analysis nor fundamental analysis would be trustworthy tactics to attain greater returns. To acquire a trading advantage, only private information that is not available to the general market will be relevant, and only to those who have it before the rest of the market does.


The strong form of market efficiency, which builds on and incorporates the weak form and the semi-strong form, claims that market prices reflect all information, both public and private. Assuming that stock prices represent all information, both public and private, no investor, including a company insider, would be able to gain an advantage over the average investor even if he had access to fresh insider knowledge.


Differing Beliefs of an Efficient Market

The strong, semi-strong, and weak forms of the EMH show the vast range of opinions held by academics and investors regarding the market’s actual efficiency. Strong form efficiency proponents concur with Fama, and they frequently include passive index investors. Active trading can produce anomalous profits through arbitrage, according to proponents of the weak version of the EMH, whereas semi-strong believers fall somewhere in the middle.


Value investors, for instance, are at the other end of the spectrum from Fama and his adherents and hold the opinion that stocks can become undervalued or priced below what they are really worth. By buying stocks when they are undervalued and selling them when their price increases to match or above their real worth, successful value investors can profit.


People who reject the idea of an efficient market emphasise the existence of active traders. There should be no incentive to become an active trader if there are no opportunities to make profits that outperform the market. Furthermore, because the EMH states that an efficient market has minimal transaction costs, the fees levied by active managers are considered as evidence that the EMH is incorrect.

CONCLUSION

Despite the fact that some investors support the EMH on both sides, there is concrete evidence that greater financial information dissemination has an impact on stock prices and improves market efficiency.


For instance, with the adoption of the Sarbanes-Oxley Act of 2002, which mandated increased financial openness for publicly traded corporations, equities market volatility decreased. Financial statements were discovered to be more credible, increasing the information’s dependability and boosting confidence in a security’s stated price. The reactions to earnings announcements are lessened since there are fewer surprises.


This alteration in volatility pattern demonstrates how the market became more effective after the Sarbanes-Oxley Act was passed and its information requirements. This supports the EMH by showing that enhancing the accuracy and dependability of financial accounts can reduce transaction costs.


Other instances of efficiency occur when alleged market irregularities become well-known and then vanish. For instance, in the past, when a stock was first added to an index like the S&P 500, its share price would increase significantly only because the stock was now a component of the index, regardless of any new developments in the company’s fundamentals. This index effect anomaly was extensively noticed and made public as a result, and it has since mostly vanished. Thus, as information improves, markets become more effective and anomalies become less common.

Difference between Stock Market and Stock Exchange

Difference between Stock Market and Stock Exchange

Stock vs market share

People typically invest in the financial sector in order to earn a little bit more money. As a result, they are unfamiliar with money market terminology. Terms like “share,” “stock,” and “equity” are challenging for a novice to comprehend. But not knowing anything clearly can be problematic.


Before starting to invest, an investor should be conversant with these words. It makes sense to invest intelligently if you understand what they mean. In this post, we will discuss the differences between the stock market and the share market. The distinction between the stock market and the share market may not always be clear to a novice investor. They experience blurred vision as a result. First, let’s dissect the phrases to determine their individual meanings.


Table of Contents   
1 What are shares?
2 What is stock?
3 What are the basic differences between stock and shares?
4 What is the impact on dividend and voting rights?
5 Conclusion
6 FAQs
Learning Sharks

What are shares?

People typically invest in the financial sector in order to earn a little bit more money. As a result, they are unfamiliar with money market terminology. Terms like “share,” “stock,” and “equity” are challenging for a novice to comprehend. But not knowing anything clearly can be problematic.Before starting to invest, an investor should be conversant with these words. It makes sense to invest intelligently if you understand what they mean. In this post, we will discuss the differences between the stock market and the share market. The distinction between the stock market and the share market may not always be clear to a novice investor. They experience blurred vision as a result. First, let’s dissect the phrases to determine their individual meanings.

learning sharks

What is stock?

When it comes to stocks, the word literally means a group or aggregate of something. Stocks are the collection or accumulation of a company’s shares, to put it in the context of a company’s holdings. Stocks reflect the percentage of a company that a person, whether an individual or not, owns. Although a firm can only issue a certain number of shares, an individual can own an unlimited number of shares in their portfolio. It can be a component of the person’s portfolio and be a part of one or more companies, as was previously described.


To further comprehend the idea of stocks, let’s use the aforementioned example once more.


For example 100 shares of Company A are held by Mr. X. There are 1000 shares in all that the corporation has issued. This indicates Mr. X. holds 10% of the company’s stock. Furthermore, if Mr. X also owns 200 shares of Company B, with a total of 4000 shares, he owns 5% of Company B, making his overall holdings in his portfolio 10% of Company A and 5% of Company B.


learning sharks

What are the basic differences between stock and shares?

After understanding the basic meaning of the two terms shares and stocks, let us not consider the basic differences between the two. 

CategoryStockShares
MeaningShares represent the ownership of the person in a particular company. Stocks represent the ownership or the share of the person in one or more companies. 
Original issueStocks do not form part of the original issue by any company. After the issue of shares, they are converted to stocks.Shares form part of the original issue by any company. 
Nominal valueStocks do not have a nominal value attached to themShares have a nominal value that is allotted to every share of the company. 
TransferStocks are a bundle of shares. Hence, it is possible to transfer them in fractions. or smaller portions. Shares of a company can be transferred in lots but not in fractions.
Maximum numberThere is no limit to the maximum stock that can be held by a person in their portfolio. Stocks can be from one or multiple companies hence, for investors, the sky’s the limit when it comes to accumulating stocks. When a company issues shares, they are in a definite quantity. Hence, there is a ceiling on the maximum number of shares of a company that can be held by any person whether (individual or not). 
Paid-up valueShares can be converted to stocks only when they are fully paid. Hence, stocks are always fully paid upShares, on the other hand, can be fully paid up or partly paid.
TypesStocks are usually of two broad categories – Common stock and preferred stock. These stocks can be further classified as a growth stock, value stock, income stock, blue-chip stocksShares can be of a private company or a public limited company. These shares are broadly categorized as common shares or equity shares and preference shares. Such shares can further be fully paid or partly paid shares. 
DenominationStocks held by an investor can be of different companies and hence can have different denominations Shares of a company have the same denomination irrespective of the times they are issued. The only change in the denomination of the shares is in the case of splitting of shares.
Learning sharks rights

What is the impact on dividend and voting rights?

Having stock in a corporation also entitles you to dividends and the ability to vote. A shareholder’s voting and dividend rights increase with the number of shares they own. The voting rights are typically not changed when these equities are converted to stocks. A private limited company may, however, issue various classes of shares for the general public and promoters, with each of the promoters’ shares potentially having a larger voting right than ordinary shares, or a private limited company may be converted to a listed corporation.

Conclusion

Shares and stocks refer to different things. However, one of these is frequently substituted for the other. It is nonetheless crucial to comprehend the fundamental distinctions between them in order to better grasp the markets and their intricacies, even though it typically does not lead to any significant misunderstanding or grave errors (particularly for small investors) in understanding an investment.

Learning sharks Stock market Institute

FAQS

What are the common ways to earn money in stock markets?

The most common ways of earning money from the stock markets are by selling the shares at a profit (capital gains) or through dividends declared by the company on the shares.

 What is the key to having a profitable portfolio?

The key to having a profitable portfolio is by investing in fundamentally strong stocks and having a diversified portfolio. Investors should also aim at a long-term investment horizon to reap maximum benefits.

What are blue-chip stocks?

Blue-chip stocks are the stocks of companies that are usually the market or segment leaders and have consistently performed well over decades.

What are preference shares?

Preference shares are a class of shares issued by the company that has a preferential right of dividend as well as at the time of liquidation of the company. These shares, however, do not have any voting rights.

Stock Market World Markets

Topics Covered

  1. WORLD MARKET NEWS
  • 1. An $83 billion investor stampede shows the scale of Europe’s woes
  • Oil prices surge 4% on supply cut threats, still set for a weekly drop
  • Gold gains as dollar dip staves off some pressure from rate hike prospects
  • Stocks rise as tech, growth shares lead; the 2-year US yields at 14-year highs

WORLD MARKET NEWS

Stock World Market

1. An $83 billion investor stampede shows the scale of Europe's woes

Europe’s woes have grown particularly acute in recent months as the region stares down the threat of a recession just as its central bank embarks on an aggressive campaign to tame inflation


A looming recession that could last longer than any experienced by Americans, war, and winter of energy restrictions. A suddenly hawkish ECB, too, oh yeah. Nobody knows how Europe will get out from under its pile of problems, and investors aren’t waiting around to find out.


According to figures cited by Deutsche Bank AG from EPFR Global, money managers pulled $3.4 billion from European stock funds in the week ending September 7, bringing the six-month total of outflows to $83 billion. Amundi SA, the biggest asset manager in the area, and BlackRock are two of those leaving. The year-end expectations for the Stoxx 600 and Euro Stoxx 50, respectively, were drastically reduced by analysts at Bank of America Corp. and JPMorgan Chase & Co.


Europe’s problems have gotten worse recently as the continent faces the possibility of a recession and its central bank launches an aggressive battle to control inflation. An energy crisis that could result in rationing this winter is being exacerbated by Russia’s weaponization of gas supply to the West.


It’s already causing financially constrained governments—some of which have a debt to GDP ratios of about 150%—to go deeper into their budgets in order to find hundreds of billions of dollars to pay for suggested price ceilings. The common currency continues to plunge to levels against the dollar that have not been seen in twenty years.


Given the oil crisis, “we’ve anticipated a recession in Europe for months, but we don’t think equities have fully priced this in,” said Wei Li, BlackRock’s global chief investment strategist based in London.


In fact, the MSCI World Index and the US benchmark are outperformed by Europe’s primary stock index in 2022, which benefits from a competitive export environment and a strong second-quarter results season.

Oil prices surge 4% on supply cut threats, still set for weekly drop

Reuters: NEW YORK On Friday, oil prices increased by around 4%, helped by actual and threatened supply cutbacks. However, futures showed a second weekly fall as the prospect of demand was hampered by aggressive interest rate hikes and China’s COVID-19 limitations.


A minor reduction in OPEC+ oil output plans revealed this week also helped to maintain prices. Russian President Vladimir Putin has threatened to restrict oil and gas supplies to Europe if price caps are implemented.


A barrel of Brent crude increased by $3.69, or 4.1%, to close at $92.84. The U.S. To reach a price of $86.79 per barrel, West Texas Intermediate (WTI) crude increased by $3.25, or 3.9%.


According to Stephen Brennock of oil broker PVM, “the West will have to deal with the possibility of losing Russian energy supplies and rising oil prices over the next months.”


Brent is down significantly from a rise in March close to its all-time high of $147 when Russia invaded Ukraine, pressured by concerns about a recession and demand.


In the wake of the invasion, the Group of Seven is looking for methods to restrict Russia’s significant oil export earnings. Russian oil should be subject to a price cap set at fair market value less any risk premium brought on by Moscow’s invasion of Ukraine, a U.S. official said. An official from the Treasury Department informed reporters on Friday.


Despite the recovery on Friday, both crude benchmarks were still expected to decline for the week, with Brent down roughly 0.2% for the week after briefly reaching its lowest level since January. WTI reported a 0.1% weekly drop.


According to Fed Governor Christopher Waller on Friday, if the US Federal Reserve can keep the unemployment rate at 5%, it can be aggressive in bringing down inflation, but after that, tradeoffs will become apparent.

While the economy “can take a blow,” the Fed should be aggressive with rate hikes, he said.


The White House is not currently exploring any releases from the U.S. Strategic Petroleum Reserve (SPR) beyond the 180 million barrels that President Joe Biden declared months ago, according to a U.S. Department of Energy official. The administration was debating whether or not to carry out additional SPR releases, Energy Secretary Jennifer Granholm earlier told Reuters.


The White House is delaying yet another SPR release, according to Price Futures Group analyst Phil Flynn. Looks like the market is no longer experiencing many of its prior worries.


According to energy services company Baker Hughes Co., the number of U.S. oil rigs dropped by five this week to 591, the lowest number since mid-June, as output growth has stalled despite relatively high energy prices.


Prices have also been impacted by the unexpected 75 basis point rate increase by the European Central Bank this week and additional COVID-19 lockdowns in China.


On Thursday, the majority of Chengdu’s more than 21 million residents were placed under lockdown, and authorities in other parts of China advised millions more people to avoid traveling over the impending holidays.


In the week ending September 6, the money managers reduced their net long positions in U.S. crude futures and options by 3,274 contracts, to 165,158. According to the Commodity Futures Trading Commission (CFTC),


(Editing by David Gregorio and Alistair Bell; reporting by Stephanie Kelly in New York; additional reporting by Alex Lawler in London, Sonali Paul in Melbourne, and Jeslyn Leah in Singapore)

Gold gains as dollar dip staves off some pressure from rate hike prospects

By 1:55 p.m., spot gold increased 0.5% to $1,716.30 per ounce. ET (1755 GMT), having earlier in the day reached its highest level since August 30. U.S. gold futures ended the day at $1,728.6 up 0.5%.


Gold increased on Friday as the possibility of further interest rate hikes seemed to be temporarily alleviated by the dollar’s decline.


By 1:55 p.m., spot gold increased 0.5% to $1,716.30 per ounce. ET (1755 GMT), having earlier in the day reached its highest level since August 30. U.S. gold futures ended the day at $1,728.6, up 0.5%.


The price of gold was expected to increase 0.3% for the week, marking its first weekly increase in four.


“Overnight, the U.S. dollar index significantly fell, which helped the gold and silver markets. Seeing some short-covering as well as the weekend approaches in the futures markets “Jim Wyckoff, a senior analyst at Kitco Metals, made a statement.


Dollar-priced bullion is now more affordable for foreign customers because the dollar has fallen to a more than one-week low against its competitors.


The decline in exchange-traded funds (ETFs) in the gold market and the weakening trading volumes on U.S. futures markets, however, indicate that the upward movement is unlikely to be sustained, according to independent analyst Ross Norman. [GOL/ETF]


Following recent hawkish remarks from Fed Chair Jerome Powell that solidified expectations of a significant rate hike, investors are now anticipating the release of August U.S. inflation data early next week.


According to Edward Moya, senior analyst at OANDA, “if consumer prices come in hotter than expected, gold might see selling pressure target the $1,680 level” and a sharp easing of pricing pressures might only offer moderate support for gold.


The opportunity cost of owning non-yielding bullion rises as interest rates rise.


This week, despite lower prices, demand for actual gold in some Asian centers remained strong. [GOL/AS]


The price of silver increased by 1.2% to $18.79 an ounce, indicating a weekly gain.


Palladium increased 2% to $2,182.18 an ounce and was on track to have its best week since July.


On track for its highest weekly increase since early June, platinum edged up 0.1% to $879.83 per ounce.

Stocks rise as tech, growth shares lead; the 2-year US yields at 14-year highs

The three major Wall Street indexes all finished the week up at least 1%, marking the first weekly rise in the previous four weeks.


Reuters: NEW YORK On Friday, global markets rose, led by technology and growth firms, and interest-rate-sensitive two-year U.S. Treasury rates reached levels not seen in 14 years as investors absorbed the idea that additional interest rate increases were required.


A day after the European Central Bank raised interest rates by a record 75 basis points on Thursday, signaling additional increases to combat inflation, the dollar dropped to a level not seen in more than one week, while the euro soared back over parity to a three-week high against the U.S. currency.


The three major Wall Street indexes all finished the week up at least 1%, marking the first weekly rise in the previous four weeks.


According to Jake Dollarhide, CEO of Longbow Asset Management in Tulsa, Oklahoma, “the market has finally accepted the projected 75-basis-point hike from the (Federal Reserve) this month after three weeks of a temper tantrum.”


According to Dollarhide, “people intellectually realize we have to change inflation, and that’s being done… and rates are still extraordinarily low.”


The Fed raising interest rates by 75 basis points this month is priced in at 87% likelihood by U.S. rate futures.


According to Fed Governor Christopher Waller, the U.S. central bank should raise rates quickly while the economy is still “capable of taking a hit.”


The remarks were made a day after Fed Chair Jerome Powell reiterated that the goal of the central bank is to address the rising pricing pressures.


Investors anticipate Tuesday’s release of significant August U.S. inflation data.


The Nasdaq Composite increased 250.18 points, or 2.11%, to 12,112.31, the S&P 500 increased 61.18 points, or 1.53%, to 4,067.36, and the Dow Jones Industrial Average increased 377.19 points, or 1.19%, to 32,151.71.


The global stock market index MSCI increased by 1.73% while the pan-European STOXX 600 index increased by 1.52%.


The yield curve for Treasury bonds was further inverted. Some people interpret the inversion as a warning that a recession is likely to occur within the next one to two years. The highest two-year yield since November 2007 was 3.575%. 


The most recent benchmark 10-year note yield was 3.321%. They are maintaining below the 11-year high of 3.498% hit on June 14 while having increased from a four-month low of 2.516% on August 2.


Germany’s two-year bond yield had reached a two-day peak not seen since 2011.


In terms of currencies, the dollar index retreated following recent strong advances, falling as low as 108.35 and ending down 0.5% at 108.96. Also posting its first weekly decrease in four weeks was the dollar index.


According to Greg Anderson, global head of FX strategy at BMO Capital Markets in New York, “markets are getting a bit apprehensive about levels, really historic levels, so the market chose not to push the dollar’s strength at this point and lightened up bets.”


This week, the dollar index surged to a more than 20-year high while the greenback reached 24-year highs against the yen and sterling.


Up to 1.2%, the euro increased to a three-week high of $1.0114. At $1.0045, it was last up 0.5%.


Sterling last traded at $1.1588 in other currencies, up 0.77% on the day.


After the pound hit a 35-year low against the dollar earlier this week, the death of Queen Elizabeth on Thursday has added to the uncertainty in Britain. [GBP/]


Following the passing of the queen, the Bank of England decided to postpone its decision on interest rates for a week, to September 22.


Additionally, cryptocurrencies advanced, with bitcoin rising 10.1% to $21,263.


A barrel of Brent crude increased by $3.69, or 4.1%, to close at $92.84. West Texas Intermediate (WTI) crude for the United States increased $3.25 or 3.9% to close at $86.79 per barrel.


(Additional reporting by Carolyn Cohn in London, Gertrude Chavez-Dreyfuss in New York, William Mallard in Will Dunham, and Louise Heavens in editing.)

Stock Market Whatsapp groups

Hello Friends! Welcome to WhatsappGroupJoinsLink, my website. I’m back with the most recent and up-to-date WhatsApp Groups in our WhatsApp Group Joins Link. You will find all types of Whatsapp Group Links here.


If you’re looking for Indian Stock Market Whatsapp Group Links, you’ve come to the right place. You will find all types of Active Indian Stock Market groups on this page.

Indian Stock Market Whatsapp Group Links Rules

  • Only the Indian Stock Exchange is permitted.
  • Always show respect to others.
  • Without admin permission, do not change the group name or icon.
  • Abuse no one in the group.
  • Spam links are not permitted.
  • These groups are open to all Whatsapp users.
  • Don’t post any personal information in these groups.

Indian Stock Market WhatsApp Group Links to Join


Stock Market WhatsApp Group

Stock Market Learning WhatsApp Group

More Indian Stock Market Whatsapp Groups will be available soon…

Share Market Working Days

Topics Covered

  1. Share Market Timings in India
  2. Pre-opening session
  3. Section 1: From 09:00 AM to 09:08 AM
  4. Section 2: From 09:08 AM to 09:12 AM
  5. Section 3: From 09:12 AM to 09:15 AM
  6. Normal session
  7. Post-closing session
  8. Section 1: From 03:30 PM to 03:40 PM
  9. Section 2: From 03:40 PM to 04:00 PM
  10. Muhurat trading
  11. Muhurat trading
  12.  Conclusion

Share Market Timings in India

Stock Market Timings

To effectively trade or invest in the financial markets, you need to have the right knowledge about the stock market timings in India. All over the country, the share market timings are the same. Therefore, once you get to know what the stock market timings are, you can buy, sell, or invest in shares from any part of the country during that time. These timings are also the same whether you want to trade on any of the two major stock exchanges in India, namely the BSE and the NSE.


The regular market trading hours are from 09:15 AM and close at 03:30 PM. There’s a pre-opening session before 09:15 AM and a post-closing session after 03:30 PM.

Pre-opening session

Pre-opening sessions typically last from 9:00 AM to 9:00 AM. It is further broken down into three parts. For a brief period, you may submit orders to purchase or sell shares during one of these timeslots. The pre-opening session’s specifics are listed below.

Section 1: From 09:00 AM to 09:08 AM

You may submit orders to purchase or sell various shares on the stock market during these eight minutes. Any orders you may have placed can also be changed or canceled. The orders placed during this portion of the pre-opening session are given preference in the order queue when the regular trading session starts at 09:15 AM.

Section 2: From 09:08 AM to 09:12 AM

You are not permitted to make any changes to or cancel any orders during these four minutes. In order to execute price matching, this section is required. Demand and supply are compared when prices are matched. At market opening at 09:15 AM, it aids in determining the final values at which various shares will be traded.

Section 3: From 09:12 AM to 09:15 AM

This three-minute period serves as a sort of transition between the pre-opening session and regular trading hours. It acts as a buffer to make entering the main trading session easier. Once more, you cannot place, amend, or cancel any orders within these three minutes.

Normal session

The continuous trading session takes place throughout this time, which is from 09:15 AM and 3:30 PM. You are free to trade throughout this session, place orders to buy or sell stocks and change or cancel those orders at any time. A bilateral order matching technique is used during this window. It follows that each sell order is matched with a buy order that was placed at the same stock price, and vice versa, with each buy order and each sell order.

Post-closing session

This session starts at 3:30 PM, after the regular trading session ends. There are two parts to the post-closing session, which lasts until 4:00 PM.

Section 1: From 03:30 PM to 03:40 PM

The weighted average of the stock prices transacted between 03:00 and 03:30 is used to calculate the closing prices of equities during these ten minutes. The weighted average values of all the securities that are listed in an index, such as the Sensex or the Nifty, are taken into account when calculating the closing prices of those indices.

Section 2: From 03:40 PM to 04:00 PM

Orders for purchases and sales are still accepted throughout this 20-minute period. However, orders are only confirmed if there are enough buyers and sellers in the market.

Muhurat trading

In India, all weekends and significant public/national holidays are observed by a closed stock market, as promptly announced by exchanges. However, the stock market is open for an hour as part of a Muhurat trading session on Samvat, the day after Diwali each year. The pre-opening session, regular session, and post-closing session are further components of muhurat trading. Since Diwali is regarded as an auspicious day, this trading hour occurs every Samvat. The NSE and BSE websites provide notice of the new time and date for this session each year.


To trade or invest in the markets, you must be informed of the NSE and BSE stock market timings in India. All you need to begin your journey in the stock market is a trading account and an offline or online Demat account in order to trade or invest in the markets. With any Indian registered brokers, you can open an online Demat and trading account. When registering with any of the brokers, you must go through a proper KYC.

What are Aftermarket Orders?

After the post-closing session, no transactions can take place. However, traders or investors can place aftermarket orders for shares of chosen companies. The same would be allocated at the opening market price the following trading day. 

Conclusion

Being aware of the stock market timings is vital to earning profits, especially if you pursue intraday trading. All you need is an online Demat account and trading account to get started on your journey of trading or investing in the share market. You can open an online Demat and trading account with any one of the many depository participants in India, like IIFL.

Adani closes in on Bezos with a 1,000% stock surge

3rd Asian richest person learning sharks( Stock market )

First, he became the wealthiest person in Asia. Then his fortune surpassed Warren Buffett’s and Bill Gates’s. Now he’s fast approaching a level of wealth only rivaled by Jeff Bezos and Elon Musk. Gautam Adani’s rise has been nothing short of remarkable by any standard.


During a year when many fortunes around the world have crumbled, his net worth has nearly doubled, rising from $64. 8 billion to $141. 4 billion, making him the world’s third-richest person, according to Forbes.


His surging fortune is due in part to the jump in oil and natural gas prices, which has lifted the MSCI World/Energy Index to a 36% total return in 2022, compared with an 18. 4% loss for the broader gauge of global stocks.


Despite this, Adani’s companies have outperformed the rest of the industry, with some share prices more than doubling this year. Adani Green Energy NSE 0.39% and Adani Total Gas NSE 0.05% are valued at more than 750 times earnings, while Adani Enterprises NSE 0.50% and Adani Transmission NSE -0.27 are valued at more than 400 times earnings.


In comparison, Musk’s Tesla and Bezos’s Amazon have P/E ratios of around 100, while Mukesh Ambani’s Reliance NSE 1.08% trades at 28 times. Adani has shifted his conglomerate’s focus to what Prime Minister Narendra Modi sees as critical to India’s long-term economic goals. An Adani Group representative declined to comment on this story.


According to the stock market, Adani’s moves have been enormously successful. Since 2020, shares in some of his companies have increased by more than 1,000%. In comparison, Sensex has gained approximately 44%.


Gautam Adani is the first Asian to become the world’s third-richest person


According to the Bloomberg Billionaires Index, Indian business tycoon Gautam Adani, chairman of the Adani Group, has surpassed France’s Bernard Arnault, CEO of Louis Vuitton, to become the world’s third-richest person.


Adani, 60, has surpassed the wealth of Louis Vuitton chairman Arnault and is now just behind business magnate Elon Musk and Jeff Bezos in the ranking, with a total net worth of USD 137.4 billion.


It’s the first time an Asian has cracked the top three; even fellow citizens Mukesh Ambani and China’s Jack Ma have never made it that far. According to the most recent index data, Ambani is ranked 11th, with a total worth of USD 91.9 billion.


The index is a daily ranking of the world’s wealthiest individuals. The calculations are explained in detail on each billionaire’s profile page in the net worth analysis. The figures are updated at the end of each New York trading day.


Elon Musk’s and Jeff Bezos’ net worths are currently USD 251 billion and USD 153 billion, respectively.


Adani has spent the last few years diversifying his coal-to-ports empire, investing in everything from data centers to cement, media, and alumina. The group now owns India’s largest private-sector port and airport operator, the country’s largest city-gas distributor, and coal miner. While environmentalists have criticised its Carmichael mine in Australia, it pledged in November to invest $70 billion in green energy to become the world’s largest renewable-energy producer.


However, concerns are growing about the exponential growth. Adani’s acquisition spree has been primarily funded by debt, and his empire is “deeply over-leveraged,” according to CreditSights in a report released this week/in August. This could lead to a default in the worst-case scenario, according to the Fitch Group unit.


Some lawmakers and market observers have also expressed concern about Adani Group companies’ opaque shareholder structures and a lack of analyst coverage. Nonetheless, the tycoon’s shares have soared – some by more than 1,000% since 2020, with valuations reaching 750 times earnings – as he has focused on areas that Prime Minister Narendra Modi believes are critical to India’s long-term goals.


The shift to green energy and infrastructure has attracted investments from firms such as Warburg Pincus and TotalEnergies SE, propelling Adani into the ranks previously held by US tech titans. The recent surge in coal prices has accelerated his rise.


Overall, Adani has increased his fortune by $60.9 billion in 2022 alone, five times more than anyone else. He surpassed Ambani as the richest Asian in February, became a billionaire in April, and last month surpassed Microsoft Corp.’s Bill Gates as the world’s fourth-richest person.


Adani was able to surpass some of the world’s wealthiest US billionaires, in part because they have recently increased their philanthropy. Gates announced in July that he would be transferring $20 billion to the Bill and Melinda Gates Foundation, While Warren Buffett has already donated more than $35 billion to the charity.

After Reliance Industries and the Tata Group, the Adani Group is India’s third largest conglomerate.


In the future, it intends to enter the telecom space and expand its green hydrogen and airports businesses significantly.


The Group recently announced plans to build a 4.1 mtpa integrated alumina refinery and a 30 mtpa iron ore beneficiation plant in Odisha, which could cost more than Rs 580 billion.


Adani Enterprises, Adani Green Energy, Adani Ports and Special Economic Zone, Adani Power, Adani Total Gas, and Adani Transmission are all listed Adani group companies.