Learning sharks-Share Market Institute


Rajouri Garden  8595071711 7982037049  Noida 8920210950 , and  Paschim Vihar  7827445731  

Fee revision notice effective 1st Jan 2026; No change for students enrolled before 15th Jan 2026

Download “Key features of Budget 2024-2025here

Anlon Technology Solutions: Share price gives 150% return on debut- Fire Rescue Company

The stock increased by another 5% to Rs 263.65 during its first trading session on Tuesday, bringing the overall gains to 166% over the stated issue price of Rs 100.

It offers services such as airport rescue and fire fighting vehicles, high-rise building rescue, evacuation, and fire-fighting equipment, industrial fire engines, runway rubber removal, and paint removal machines, runway sweeping, and bay cleaning, among others.

Anlon Technology Solutions, the newest Dalal Street debutant, gave its investors a strong listing pop of 150% on Tuesday. Even in the SME market, it is one of the best listing pops in the near future.

Anlon Technology Solutions, which made its debut on the NSE’s SME platform, reached a settlement price of Rs 250 per share on Tuesday, increasing by 150% over its initial offering price of Rs 100 per share.

The stock increased by another 5% to Rs 263.65 during its first trading session on Tuesday, bringing the overall gains to 166% over the stated issue price of Rs 100.

Anlon Technology Solutions’ initial public offering (IPO) was open for subscription between December 29, 2022, and January 2, 2023. The company sold its shares for between Rs 95 and Rs 100 each in order to raise Rs 15 crore.

Let’s look at the fundamentals of the stock.

Profit & Loss

Figures in Rs. Crores

Mar 2020Mar 2021Mar 2022
Sales +13.6914.3519.34
Expenses +12.6713.0715.23
Operating Profit1.021.284.11
OPM %7.45%8.92%21.25%
Other Income +0.130.090.25
Interest0.070.140.75
Depreciation0.130.190.20
Profit before tax0.951.043.41
Tax %28.42%29.81%28.74%
Net Profit0.690.742.43
EPS in Rs690.00740.002,430.00
Dividend Payout %0.00%0.00%0.00%

Balance Sheet

Figures in Rs. CroresCORPORATE ACTIONS

Mar 2020Mar 2021Mar 2022
Share Capital +0.010.010.01
Reserves1.712.454.88
Borrowings +0.181.615.81
Other Liabilities +9.1511.4610.27
Total Liabilities11.0515.5320.97
Fixed Assets +1.731.593.87
CWIP0.000.000.00
Investments0.000.000.00
Other Assets +9.3213.9417.10
Total Assets11.0515.5320.97
The balance sheet of Anlon technology

The issue received a whopping 428.6 subscriptions, with the non-institutional bidder allocation receiving 883.58 subscriptions and the retail bidder quota receiving 447.06 subscriptions. It was reserved 54.53 times for institutions that met the criteria.

Each lot in the issue cost Rs 1.2 lakh and had a fixed lot size of 1,200 shares. Each lot at listing cost Rs 3 lakh, giving the investors who received the share allocation a profit of Rs 1.8 lakh.

Conclusion

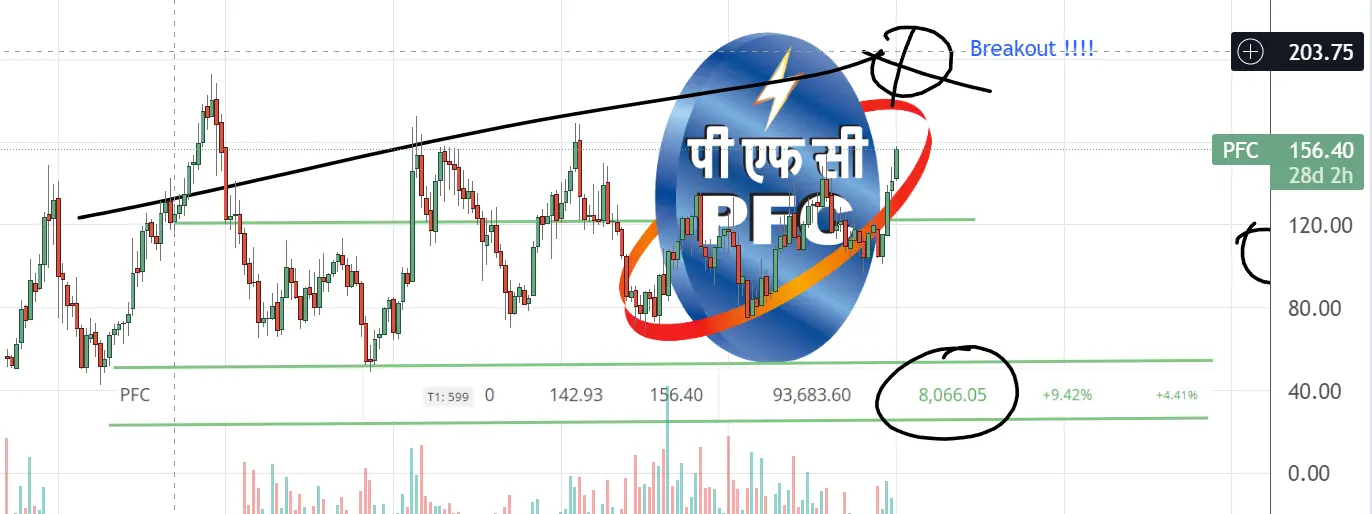
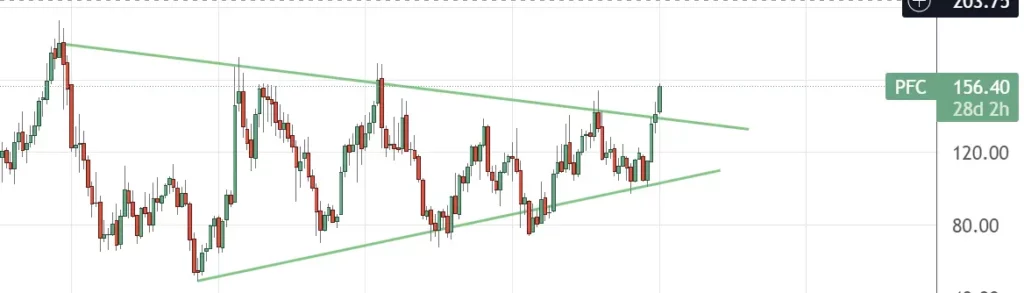
Overall, the company seems to be doing good in terms of profitability. One can make this stock a part of their portfolio for the long term. However, it is advised to wait for the stock to find it support and resistance.

This is purely for educational purposes. If you are interested in the stock market courses, you can visit our courses page.

#anlontechnologyshareprice #latestshareprice #stockmarket #sharemarket

Hindustan Copper- Mining company l Entry price l Latest Hind copper share price

stock market chart patterns

As of 12:423 IST on the NSE, Hindustan Copper Ltd. is trading at Rs 123.70, up 3.33% on the day. The stock has lost 30% in the last year but has recovered from the price. Sensex Today Live 59763.31 | Nifty Live 17825.1 – Indian Share Market Live, Stock Market News | Learning sharks

Let’s look at the technicals of the stock, The stock seems to be breaking the resistance level of Rs117 with the target up to Rs 162 a piece.

The stock seems to be coming out of its symmetrical triangle pattern. This could push the price to a new high. While we are discussing the technicals of this stock. Let’s check out the fundamentals of this share price as well.

Profit & Loss

Standalone Figures in Rs. Crores / View Consolidated

Mar 2011Mar 2012Mar 2013Mar 2014Mar 2015Mar 2016Mar 2017Mar 2018Mar 2019Mar 2020Mar 2021Mar 2022TTM
Sales +1,1711,4851,3231,4891,0161,0721,2041,6701,8168321,7871,8221,650
Expenses +7889521,0209848889629811,3991,3101,0741,3761,3101,176
Operating Profit383534303505128110223271506-242411512474
OPM %33%36%23%34%13%10%18%16%28%-29%23%28%29%
Other Income +5385257102675227413757355060
Interest42621314266062643018
Depreciation97144151174113119142165253291295150177
Profit before tax335473404431804094122230-53887382339
Tax %33%32%12%33%16%5%34%35%37%-6%-26%2%
Net Profit22432335628668386280146-569110374344
EPS in Rs2.423.503.843.100.730.410.670.861.57-6.151.193.873.56
Dividend Payout %41%29%26%32%21%0%30%29%33%0%29%30%
Compounded Sales Growth
10 Years:2%
5 Years:9%
3 Years:0%
TTM:-8%
Compounded Profit Growth
10 Years:2%
5 Years:43%
3 Years:37%
TTM:86%
Stock Price CAGR
10 Years:-2%
5 Years:5%
3 Years:37%
1 Year:-9%
Return on Equity
10 Years:6%
5 Years:2%
3 Years:-2%
Last Year:25%

Shareholding Pattern

Numbers in percentages

Dec 2019Mar 2020Jun 2020Sep 2020Dec 2020Mar 2021Jun 2021Sep 2021Dec 2021Mar 2022Jun 2022Sep 2022
Promoters +76.0576.0576.0576.0576.0576.0572.7666.1466.1466.1466.1466.14
FIIs +0.200.190.140.120.410.711.141.070.260.310.671.32
DIIs +13.7013.6513.6413.5913.3112.6613.0217.0216.8016.4415.6115.95
Public +10.0610.1110.1810.2410.2410.5813.0815.7716.7917.1017.5816.59

CONCLUSION

Overall, the stock seems to be in the buying zone with targets of up to 20%. One can take an entry to fetch some profits. This is for educational purposes, not a buying call.

To know more about stock market courses, visit our course page

#stockmarket #hindcopper #hindustancopper #sharemarket #price

This finance holding company rose 5% today, should you invest in this? Click to read the Latest share news in 2023

stock market chart patterns

If you missed the previous buying call then check out this breakout. The finance holding company which rose 5% today is none other than one of the optimistic LT finance holdings limited companies

The CMP of the share is 91.80 INR+4.90 (5.64%)today. The stock has broken its resistance and is currently trading in the above resistance area. According to the technicals of the stock. L&T finance holdings is a buy with targets of up to 20%.

Let’s look at the technicals of this stock on the chart.

Overall, according to the Support resistance, and MACD. it’s a Buy. However, let’s look at the fundamentals of this stock too.

Profit & Loss

Consolidated Figures in Rs. Crores / View StandalonePRODUCT SEGMENTS

Mar 2011Mar 2012Mar 2013Mar 2014Mar 2015Mar 2016Mar 2017Mar 2018Mar 2019Mar 2020Mar 2021Mar 2022TTM
Sales +2,1143,0043,9905,2216,4567,4408,53210,21513,36514,10413,35311,93012,044
Expenses +4215391,0251,2301,6251,9792,7763,3083,3774,1605,4015,2335,152
Operating Profit1,6932,4642,9653,9914,8315,4615,7566,907
9,9447,9526,6976,892
OPM %80%82%74%76%75%73%67%68%75%70%60%56%57%
Other Income +-9-13419-51682649-4370836594703
Interest1,0211,7072,3303,0813,5774,1334,6355,4586,8827,5527,2305,7655,651
Depreciation5960658096836752508286103106
Profit before tax6046849898251,1751,2531,0791,4463,0522,6801,4721,4231,838
Tax %35%34%26%28%28%32%3%12%27%37%36%26%
Net Profit3914557305958558571,0481,2782,2321,7009491,0491,316
EPS in Rs2.163.462.824.043.974.835.119.066.903.934.335.40
Dividend Payout %0%0%18%22%16%16%13%16%9%11%0%12%
Profit and loss of L&t finance holding

Balance Sheet

Consolidated Figures in Rs. Crores / View StandaloneCORPORATE ACTIONS

Mar 2011Mar 2012Mar 2013Mar 2014Mar 2015Mar 2016Mar 2017Mar 2018Mar 2019Mar 2020Mar 2021Mar 2022Sep 2022
Share Capital +1,4171,7152,4672,7183,0842,9672,9691,9961,9992,0052,4692,4742,476
Reserves1,4743,0383,7534,1074,6565,3246,0209,41111,45012,68816,30417,47417,955
Borrowings +15,90121,07728,24735,85442,09151,61659,81175,24891,50793,93488,59285,23785,387
Other Liabilities +7841,1032,8523,1824,2755,1074,9241,1171,0949021,5821,6961,837
Total Liabilities19,57726,93336,57044,86152,74263,79972,51187,772106,050109,529108,947106,880107,655
Fixed Assets +4765201,1311,2281,1841,3131,2301,1511,1271,1001,138509530
CWIP183389140174222819396224220
Investments7327701,8432,7302,6493,5636,0125,3018,6415,9798,87211,91711,135
Other Assets +18,35025,61033,50740,76348,73658,90165,24281,30196,243102,38798,91294,43395,990
Total Assets19,57726,93336,57044,86152,74263,79972,51187,772106,050109,529108,947106,880107,655
A balance sheet of L&T finance holding

Shareholding Pattern

Numbers in percentages DEALS / TRADES

4 recently

Dec 2019Mar 2020Jun 2020Sep 2020Dec 2020Mar 2021Jun 2021Sep 2021Dec 2021Mar 2022Jun 2022Sep 2022
Promoters +63.8663.7263.7263.6763.6563.6263.5963.5363.5066.2666.2366.20
FIIs +12.4910.609.377.079.3610.608.798.257.866.916.616.75
DIIs +4.445.225.454.985.275.886.576.576.114.575.345.35
Public +19.2120.4621.4624.2821.7219.9121.0521.6622.5322.2621.8221.69
Shareholding pattern l&t finance holding pattern

CONCLUSION

Overall, the stock is under the buying zone. We recommend any new investors add this to their portfolio. However, this is an education opinion, not a professional call. If you wanna learn more about our stock market courses, then visit our courses section.

PFC share price – Breakout after 5 years with high volumes- Latest Post 2023

Pfc share analysis - Latest stock market post 2023

The stock has increased by 51% over the last six months, compared to the S&P BSE Sensex’s 8% gain. Power Finance Corporation (PFC) shares increased 5% intraday on the National Stock Exchange (NSE) on Tuesday amid high volumes, reaching a high of over five years at Rs 157.80. The share price of a publicly traded financial institution reached its highest level since May 2017.

Here’s our current position in PFC share corporation after the breakout from last week.

Let’s look at the Technical analysis of this stock and try to create some support and resistance 4 hours time frame.

PFC Share price 2023
PFC share price CMMP 156. Stock will eventually come down in a shorter time frame to retest the resistance price of 150.

PFC Share chart weekly

PFC Share price 2023 analysis

The stock has broken its resistance but will come back to restest it, so you can start accumulating this stock in smaller quantities. Now that we have looked at the Technical of the stocks. Let’s talk about the fundamentals of PFC corporation.

Profit & Loss

Consolidated Figures in Rs. Crores / View Standalone

Mar 2011Mar 2012Mar 2013Mar 2014Mar 2015Mar 2016Mar 2017Mar 2018Mar 2019Mar 2020Mar 2021Mar 2022TTM
Revenue10,17813,09217,31421,40724,98827,86127,58148,62454,10662,18971,65676,26275,897
Interest6,4268,59510,99513,05315,45616,65716,76830,28934,62740,84544,68444,70944,411
Expenses +1973513317481,1032,0425,5386,5831,6967,3327,1028,2157,881
Financing Profit3,5554,1465,9877,6078,4299,1625,27511,75217,78314,01219,87123,33823,605
Financing Margin %35%32%35%36%34%33%19%24%33%23%28%31%31%
Other Income +36512232525304294105467980
Depreciation566582041151524253542
Profit before tax3,5864,1465,9947,6248,4469,1675,26411,77917,86214,09319,89123,38223,643
Tax %26%26%26%28%29%33%58%25%29%33%21%20%
Net Profit2,6473,0594,4385,4626,0046,1842,2368,79712,6409,47715,71618,76818,999
EPS in Rs11.5311.5916.8120.6922.7423.428.4725.3437.5826.9844.5053.0853.55
Profit and loss of PFC corporation

Balance Sheet

Consolidated Figures in Rs. Crores / View StandaloneCORPORATE ACTIONS

Mar 2011Mar 2012Mar 2013Mar 2014Mar 2015Mar 2016Mar 2017Mar 2018Mar 2019Mar 2020Mar 2021Mar 2022Sep 2022
Share Capital +1,1481,3201,3201,3201,3201,3202,6402,6402,6402,6402,6402,6402,640
Reserves14,09319,47322,36026,20231,09134,70834,20537,19444,48146,76058,12769,03673,866
Borrowings +76,275110,126139,473159,215187,795200,660202,993441,151539,488596,561659,682660,476674,847
Other Liabilities +13,2104,7636,1787,5828,70510,53119,70041,54642,26048,56055,25758,84859,887
Total Liabilities104,725135,682169,330194,320228,912247,220259,537522,531628,869694,521775,707791,000811,240
Fixed Assets +75777572102198296161196238341719737
CWIP20012471051291992883365341
Investments272727275282,2303,1455,4934,6044,4043,4993,7745,103
Other Assets +104,622135,578169,229194,220228,280244,745255,990516,749623,871689,590771,530786,454805,359
Total Assets104,725135,682169,330194,320228,912247,220259,537522,531628,869694,521775,707791,000811,240
The balance sheet of PFC corporation

Shareholding Pattern

Numbers in percentages DEALS / TRADES

Dec 2019Mar 2020Jun 2020Sep 2020Dec 2020Mar 2021Jun 2021Sep 2021Dec 2021Mar 2022Jun 2022Sep 2022
Promoters +55.9955.9955.9955.9955.9955.9955.9955.9955.9955.9955.9955.99
FIIs +18.9018.9217.4516.8117.3717.3217.3517.8816.7116.7616.2116.82
DIIs +20.2620.4021.1220.6720.1819.5519.3713.6613.5813.5812.7417.22
Public +4.854.685.436.536.457.147.2812.4713.7213.6615.059.95
Shareholding pattern of PFC

Conclusion

Overall, the stock is a buying opportunity. One can expect 30-40% upside from this price in the coming 4-6 months. or even before. This is not a buying call, but purely for educational purposes. Learning sharks institute has taught over 100+ students, and if you are interested in learning how to find stocks like these. Read our courses here.

#sharemarket #pfcshare #stockmarket #technical analysis

Date: 03-01-2023

Writer: Vijay verma

Reliance to buy 51% stake in this Chocolate share – Read to know if you should Invest

Lotus Chocolate Company Ltd share price - Full technical and fundamental analysis 2023

Who knew reliance’s Mukesh Ambani was such a big fan of chocolate? He recently plans to buy 51% of Lotus chocolate for 74 crores. Read full to know whether you should invest in this stock.

Lotus chocolate’s current share price is 122.95 apiece. Today the stock opened and rushed 5% during the trading hours on the BSE exchange. Let’s look at the technical analysis of this stock.

Lotus chocolate share price technical analysis

The company looks fine on the daily and Monthly chart time frame, however, on the Monthly time frame it seems overbought already. You should be a little concerned if you are planning to invest for the next few months. In the short time frame, the technical seems fine.

Let’s look at the Fundamentals of the Lotus chocolate share

Balance Sheet

Figures in Rs. CroresCORPORATE ACTIONS

Mar 2011Mar 2012Mar 2013Mar 2014Mar 2015Mar 2016Mar 2017Mar 2018Mar 2019Mar 2020Mar 2021Mar 2022Sep 2022
Share Capital +20.2320.2320.2320.2320.2320.2320.2320.2320.2320.2320.2320.2320.23
Reserves-18.57-20.66-22.19-24.88-24.29-23.03-23.50-22.45-21.13-20.20-18.43-12.42-12.84
Borrowings +20.4517.3816.9119.8718.3229.3623.2916.9415.6314.3016.2013.608.30
Other Liabilities +13.5012.1016.3414.8915.6515.0613.1514.9313.7514.1111.6913.445.65
Total Liabilities28.2221.6623.9022.7222.5234.2325.7822.2621.0921.0522.3027.4621.34
Fixed Assets +4.363.925.746.095.795.795.523.422.772.121.491.601.75
CWIP2.002.000.330.030.050.000.000.010.010.010.010.000.00
Investments0.200.180.180.000.000.000.000.000.000.000.000.000.00
Other Assets +21.6615.5617.6516.6016.6828.4420.2618.8318.3118.9220.8025.8619.59
Total Assets28.2221.6623.9022.7222.5234.2325.7822.2621.0921.0522.3027.4621.34
Balance sheet of Lotus chocolate share

While the company has reduced its borrowings, its reserves are Negative. While we look at the profit and loss

Profit & Loss

Figures in Rs. Crores

Mar 2011Mar 2012Mar 2013Mar 2014Mar 2015Mar 2016Mar 2017Mar 2018Mar 2019Mar 2020Mar 2021Mar 2022TTM
Sales +38.6955.5146.4456.3060.7865.4066.4756.9265.6969.8947.8786.9785.94
Expenses +42.2555.6147.0757.9759.8662.6565.0454.2263.7568.3245.4880.6382.04
Operating Profit-3.56-0.10-0.63-1.670.922.751.432.701.941.572.396.343.90
OPM %-9.20%-0.18%-1.36%-2.97%1.51%4.20%2.15%4.74%2.95%2.25%4.99%7.29%4.54%
Other Income +0.080.310.140.060.590.190.130.020.070.050.110.20-0.24
Interest0.881.800.530.420.070.911.220.660.150.200.200.310.38
Depreciation0.510.500.510.660.730.770.800.800.650.650.620.220.18
Profit before tax-4.87-2.09-1.53-2.690.711.26-0.461.261.210.771.686.013.10
Tax %0.00%0.00%0.00%0.00%0.00%0.00%0.00%26.19%-9.92%-14.29%-5.36%0.00%
Net Profit-4.87-2.08-1.54-2.690.711.26-0.460.931.330.881.776.013.10
EPS in Rs-3.79-1.62-1.20-2.090.550.98-0.360.721.040.691.384.682.41
Dividend Payout %0.00%0.00%0.00%0.00%0.00%0.00%0.00%0.00%0.00%0.00%0.00%0.00%
Profit and loss of lotus chocolate share

The company has turned slightly profitable, and most of the shares are with the promoters themselves. Overall it is a decent buy. One can accumulate this share at this rate and average if it goes south.

If you wanna stay updated with these stock recommendations for educational purposes, stay connected with our website. Have a look at the share market courses here our institute has to offer.

#sharemarket #reliance #lotuschocolateshareprice #mukeshambani #latestpost2023

Jugal Choudhary is one of the Youngest Digital And Social Media marketers.

He’s also the founder of JC DIGITAL MARKETING. His blog helps and guides more about the blogging world and Its product schema ninja is a WordPress plugin that helps to get more sales and traffic to your website.

Jugal Choudhary – Founder of JC DIGITAL MARKETING

He’s also the founder of JC DIGITAL MARKETING. His blog helps and guides more about the blogging world and Its product schema ninja is a WordPress plugin that helps to get more sales and traffic to your website.

He’s having more than 5 years of experience at age 24 in SEO and digital marketing. He’s sharing his experience with his blog and he’s also taking interviews with the world’s best digital marketers. So You must check out his blog if you want to explore more about the blogging and digital marketing world.

Jugal Choudhary – One of the Youngest Founder

He Also Helps People To Grow their social media platforms, if you are interested in growing your presence on google, he is your guy. If you are considering marketing yourself on spaces such as Instagram Facebook Twitter Linked In Etc, you can reach out to him.

He also helps brands to grow their Instagram handle and promote their products with big influencers via invite collaborations. For their better reach of products

One of the youngest Digital Marketers in India who represents India among globally acclaimed professionals.

For more, you can him out on his Instagram id here

#Founder #Digitalmarketer #Jugalchoudhary

Certificate Verified.

Kabeer Bajaj - Student of Learning sharks Stock Market Student

Name of the Student: Kabier ( Kabeer) Bajaj

Student ID: LS109CE22

Academic Year: 2022-2023

Name of the course: Stock Market Crash course

Mentor: Vijay Verma

Result: Passed

Course Status: Completed.