Learning sharks-Share Market Institute


Rajouri Garden  8595071711 7982037049  Noida 8920210950 , and  Paschim Vihar  7827445731  

Fee revision notice effective 1st April 2025; No change for students enrolled before 15th May 2025

Download “Key features of Budget 2024-2025here

The Power of Volume Analysis in Financial Trading

Introduction

Knowledge and understanding of market trends and patterns are critical in the world of financial trading. Traders and investors are constantly looking for tools and techniques to help them understand the behavior of financial instruments. Volume analysis is one such powerful tool that allows traders to gain a deep understanding of market dynamics by analyzing the volume of trades executed over a given period. This article will delve into the concept of volume analysis and emphasize its importance in making informed trading decisions.

KEY TAKEAWAYS

  • Volume analysis is the process of examining relative or absolute changes in an asset’s trading volume in order to predict future price movements.
  • Volume can be used to gauge market strength, as rising markets with increasing volume are typically regarded as strong and healthy. When prices fall on increasing volume, the downward trend is gaining strength.
  • Volume is used in technical analysis by a variety of tools, including the positive volume index (PVI).

Understanding Volume Analysis

The study of trading activity, specifically the number of shares or contracts traded in a specific security or market, is referred to as volume analysis. It examines the volume of transactions rather than just price movements. Traders can gauge the strength and conviction behind market movements by examining trade volume, which can help them identify potential buying or selling opportunities.

The Role of Volume in Market Interpretation

1. Confirming Trends

Volume analysis can be used to confirm existing market trends. When a security’s price is rising or falling, it is critical to determine whether the trend is being supported by high or low trading volume. A significant increase in volume during an upward trend validates the trend’s strength, indicating a higher likelihood of continued price appreciation. A decrease in volume during an upward trend, on the other hand, may indicate a lack of conviction among market participants, potentially signaling a trend reversal.

2. Identifying Reversals

Volume analysis also aids traders in identifying potential trend reversals. Sudden increases in volume followed by a price reversal can indicate a shift in market sentiment. For example, if a stock has been in a downtrend and then experiences a significant increase in volume while the price begins to rise, this could be a sign of a trend reversal. Traders can spot such reversals and profit from them by closely monitoring volume patterns.

3. Assessing Market Strength

Volume analysis can provide insight into market strength and weakness. In an uptrend, rising prices and rising volume indicate a healthy market with strong demand. If, on the other hand, prices rise on low volume, it may indicate a lack of widespread interest and, as a result, a potentially fragile market condition. Traders can evaluate overall market sentiment and make informed decisions based on the perceived strength or weakness of the market by examining volume patterns.

Techniques for Volume Analysis

Traders use a variety of techniques and indicators to effectively use volume analysis in trading. Here are a few examples of commonly used methods:

  1. Bars of Volume
    On a price chart, volume bars are graphical representations of trading volume. They depict the volume traded during each time interval visually. Traders can quickly identify significant volume spikes or periods of low activity by observing the height and width of volume bars.
  2. OBV (On-Balance Volume)
    On-Balance Volume (OBV) is a market pressure indicator that combines price and volume to measure buying and selling pressure. It gives the volume a positive or negative value based on whether the price closes higher or lower than the previous period. The OBV line is used by traders to identify divergences and confirm trends.
  3. Volume Moving Averages
    Volume moving averages (VMAs) smooth out volume data by computing the average volume over a given time period. Traders frequently use VMAs to identify volume trends and determine whether current volume levels deviate from the average. This method aids in the detection of unusual volume patterns that may indicate significant market events.

Conclusion

Volume analysis is an essential tool in the arsenal of any successful trader. Traders can gain a better understanding of market dynamics, validate trends, identify reversals, and assess market strength by incorporating volume analysis techniques into their trading strategies. Volume analysis should not be used in isolation, but rather in conjunction with other technical analysis tools. Traders can improve their decision-making capabilities and potentially their trading performance by diligently applying and continuously refining volume analysis techniques.

FOR MORE INFO CLICK THIS SITE:https://learningsharks.in/

FOLLOW OUR PAGE:https://www.instagram.com/learningsharks/?hl=en

Understanding Smart Money: The Key to Financial Success

Introduction

Welcome to our in-depth guide to smart money, where we delve into the concept of smart money and its importance in achieving financial success. In this article, we will look at the strategies, principles, and insights that can help people make informed decisions about how to grow their wealth and secure a secure financial future.

What is Smart Money?

Funds or investments managed by experienced and knowledgeable investors or financial institutions are referred to as smart money. These people or organizations have valuable insights, market intelligence, and expertise that allows them to make sound investment decisions. Smart money investors, as opposed to retail investors, have access to resources and information that can help them outperform the market and generate significant returns on their investments.

KEY TAKEAWAYS

  • Institutional investors, market mavens, central banks, funds, and other financial professionals place smart money in the market.
  • Smart money is also the force that influences and moves financial markets, which is frequently led by central bank actions.
  • Smart money invests on a much larger scale than ordinary money.

The Benefits of Smart Money Investments

Investing in smart money opportunities can provide a number of benefits, including:

  1. Access to Expertise and Insights
    Individuals can benefit from the expertise and insights of seasoned professionals through smart money investments. These experts have a thorough understanding of the market and can spot lucrative investment opportunities that the average investor may miss.
  2. Diversification
    Diversifying funds across asset classes, industries, or geographical locations is common in smart money investments. This diversification helps to mitigate risks and lessens the impact of any single investment’s underperformance. Smart money investors can achieve a well-balanced portfolio that can withstand market volatility by spreading their investments across various sectors.
  3. Enhanced Returns
    Smart money investors have the potential to achieve higher returns on their investments than retail investors due to their knowledge and expertise. They have a competitive advantage because of their ability to identify undervalued assets, anticipate market trends, and capitalize on emerging opportunities.

Strategies Employed by Smart Money Investors

Smart money investors use a variety of strategies to maximize their returns while minimizing their risks. Among these strategies are:

1. Fundamental Analysis

To determine the fundamental value of a company or asset, smart money investors conduct extensive research and analysis. To determine the true value of an investment, they examine financial statements, industry trends, competitive positioning, and other relevant factors. Smart money investors can make informed investment decisions by identifying undervalued assets.

2. Following Market Trends

Smart money investors keep a close eye on market trends and developments. To identify potential opportunities, they examine patterns, shifts in investor sentiment, and economic indicators. Smart money investors can position themselves advantageously and make timely investment decisions by staying ahead of market trends.

3. Long-Term Perspective

When it comes to investing, smart money investors take a long-term approach. They recognize that short-term market fluctuations are to be expected and concentrate on the underlying value of their investments. This strategy enables them to weather market volatility and benefit from compounding returns over time.

Conclusion


To summarize, understanding and applying the concept of smart money can be a game changer for individuals seeking financial success. Individuals can improve their chances of achieving their financial goals by partnering with knowledgeable investors, gaining access to valuable insights, and implementing effective investment strategies. Remember that while smart money investments do not guarantee success, they do provide a solid foundation for informed decision-making and wealth accumulation.

FOR MORE INFO CLICK THIS SITE:https://learningsharks.in/

FOLLOW OUR PAGE:https://www.instagram.com/learningsharks/?hl=en

Money: The Essential System of Exchange

Introduction

Money is a fundamental concept that is extremely important in our modern society. As an exchange system, it facilitates transactions, promotes economic growth, and serves as a medium for wealth accumulation. In this in-depth article, we delve into the complexities of money, investigating its origins, functions, and types, as well as the role it plays in shaping our financial landscape.

KEY TAKEAWAYS

  • Money is a value system that allows for the exchange of goods.
  • The use of money eliminates the need for both parties to have something that the other wants or needs.
  • Historically, agricultural commodities such as grain or livestock were the first forms of money.
  • Most money systems today are based on standardized currencies controlled by central banks.
  • Some of the characteristics of money can also be found in digital cryptocurrencies.

Understanding the Origins of Money

Money emerged as a means of overcoming the limitations of barter systems. While bartering entails the direct exchange of goods and services, money introduced a standardized medium of exchange, simplifying transactions and increasing economic efficiency. Our forefathers saw the need for a universally accepted medium for representing value and facilitating trade across diverse communities.

Functions of Money

Money serves several essential functions within an economy, acting as:

  1. Exchange Medium
    Money serves as a medium of exchange, allowing people to trade goods and services without having to barter. It is a widely accepted instrument that facilitates smooth transactions between buyers and sellers.
  2. Accounting Unit
    Money serves as a standardized unit of measurement for assessing and comparing the worth of various goods and services. Money, by assigning prices to products, enables individuals to make informed decisions and efficiently allocate resources.
  3. Value Store
    Money’s primary function is to serve as a store of value, preserving wealth over time. Individuals can save and accumulate wealth by holding money, reducing the risks associated with storing value in perishable or non-portable assets.
  4. Deferred Payment Standard
    Money serves as a standard of deferred payment, allowing transactions involving credit or debt to take place. It enables loan, mortgage, and other financial obligations to be repaid, ensuring the smooth operation of financial systems.

Types of Money

Money exists in various forms, each serving specific purposes within the economy. Here are some of the most common types of money:

  1. Commodity Currency
    Commodity money is defined as objects with intrinsic value that can be used for both economic and non-economic purposes. Items such as precious metals, salt, and even shells have historically served as commodity money, representing value that extends beyond their use as a medium of exchange.
  2. Fiat currency
    Fiat money is a type of currency that only has value because the government declares it to be legal tender. It is not backed by a physical commodity, but rather by the population’s trust and confidence. Most countries now use fiat money as their official currency.
  3. Representative Cash
    Instruments such as banknotes and checks that represent a claim on a specific amount of commodity or fiat money are examples of representative money. This type of money facilitates transactions by providing a more convenient and portable alternative to carrying large amounts of cash.
  4. Electronic Money
    With the advancement of technology, digital money has become more prevalent. It includes a variety of electronic payment methods such as online banking, cryptocurrencies such as Bitcoin, and mobile payment systems such as Apple Pay or Google Pay. In our interconnected world, digital money provides convenience, security, and accessibility.

The Role of Money in the Economy

Money plays a pivotal role in shaping the economy, influencing factors such as:

  1. Economic Development
    Money drives economic growth by facilitating trade and allowing for the efficient allocation of resources. It promotes the overall development of societies by stimulating investment, encouraging innovation, and fostering entrepreneurial activities.
  2. Price Consistency
    Money affects individual purchasing power and price stability through the concept of inflation. Monetary policies are used by central banks to maintain price stability, ensuring that the value of money remains relatively constant over time.
  3. Intermediary Financial Services
    Money serves as a catalyst for financial intermediation, allowing banks and other financial institutions to make loans, extend credit, and provide investment opportunities. These intermediaries are critical in channeling funds from savers to borrowers, thereby facilitating economic activity.

Conclusion


To summarize, money is a necessary system of exchange that underpins our economic activities. Money shapes our financial landscape and influences economic growth, from its origins in overcoming the limitations of barter to its various functions and types. Understanding the complexities of money provides us with valuable insights into the mechanisms that drive our global economy.

FOR MORE INFO CLICK THIS SITE:https://learningsharks.in/

FOLLOW OUR PAGE:https://www.instagram.com/learningsharks/?hl=en

Understanding Fundamental Analysis for Successful Investing

fundamental analysis is a holistic approach to understanding and studying a business.
Fundamental Analysis

Introduction

Fundamental analysis (FA) determines the intrinsic value of a security by examining related economic and financial factors. Intrinsic value is the value of an investment based on the financial situation of the issuing company as well as current market and economic conditions.

Fundamental analysts research everything that has the potential to affect the value of a security, from macroeconomic factors like the state of the economy and industry conditions to microeconomic factors like the effectiveness of the company’s management.

The end goal is to arrive at a number that an investor can compare to the current price of a security to determine whether it is undervalued or overvalued by other investors.

What is Fundamental Analysis?

Fundamental analysis is a valuation technique that investors use to determine the intrinsic value of a company’s stock or financial asset. It entails assessing various aspects of the company’s financial performance, industry position, management team, competitive advantages, and economic outlook. Investors hope to identify undervalued or overvalued securities by scrutinizing these fundamental factors, allowing them to make well-informed investment decisions.

Key Elements of Fundamental Analysis

To conduct a thorough fundamental analysis, investors should consider several key elements:

  1. Financial Reports
    Financial statements, such as the income statement, balance sheet, and cash flow statement, contain critical information for assessing a company’s financial health. Investors can gain insights into a company’s profitability, liquidity, and solvency by examining revenue trends, profit margins, debt levels, and cash flow patterns.
  2. Advantage in the Market
    Evaluating a company’s competitive advantage is critical for determining its long-term viability and growth potential. Unique products or services, strong brand recognition, technological superiority, and economies of scale are all factors that can contribute to a long-term competitive advantage.
  3. Market Research
    Understanding the dynamics and trends of a particular industry is critical for assessing a company’s competitive position. To assess the company’s future success potential, consider factors such as market size, growth prospects, regulatory environment, and competitive landscape.
  4. Management Group
    The management team’s competence, experience, and integrity are critical to a company’s overall performance. Evaluating executives’ track record, strategic vision, and ability to navigate challenges can provide valuable insights into the company’s future prospects.

Implementing Fundamental Analysis

To effectively implement fundamental analysis, investors should take the following steps:

  1. Establish Investment Goals
    Investors must clearly define their investment objectives, including desired returns, risk tolerance, and investment horizon, before conducting any analysis. This step ensures that the fundamental analysis corresponds to the investor’s financial objectives.
  2. Locate Possible Investment Opportunities
    Investors can identify potential investment opportunities that align with their investment objectives by utilizing various research tools and resources. Screening for companies with strong fundamentals, solid financials, and promising growth prospects can aid in narrowing the list of potential investments.
  3. Conduct Extensive Research
    Once potential investment opportunities have been identified, in-depth research should be conducted to evaluate the fundamental factors of each company. This includes analyzing financial statements, researching industry reports, conducting competitive analysis, and evaluating the capabilities of the management team.
  4. Assessment
    Investors can calculate the intrinsic value of a company’s stock or asset based on the research findings. To arrive at a fair value estimate, various valuation techniques such as discounted cash flow (DCF) analysis, price-to-earnings (P/E) ratio, and price-to-book (P/B) ratio can be used.
  5. Risk Evaluation
    Assessing the risks of an investment is critical for mitigating potential downsides. To make informed decisions, factors such as industry risks, market volatility, regulatory changes, and company-specific risks should be carefully evaluated.
  6. Monitor and evaluate
    The process of fundamental analysis is ongoing. Investors should monitor their investments and review the fundamental factors on a regular basis to ensure they remain consistent with the initial investment thesis. This allows investors to adjust their portfolios in response to changing market conditions.

FOR MORE INFO CLICK THIS SITE:https://learningsharks.in/

FOLLOW OUR PAGE:https://www.instagram.com/learningsharks/?hl=en
What Is Technical Analysis?

Technical analysis attempts to predict future price movements, providing traders with the information needed to make a profit.
Technical Analysis

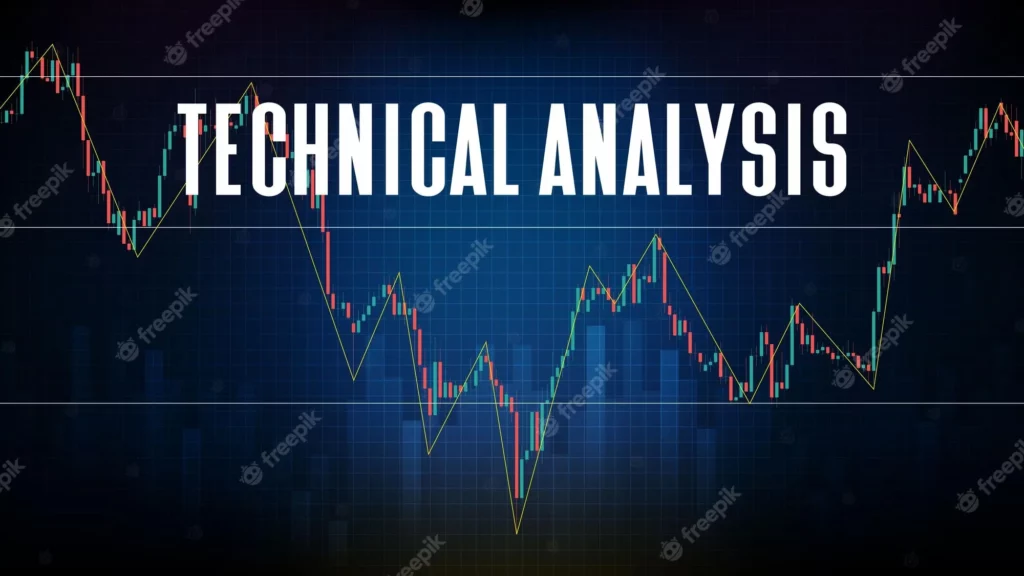
The study of historical market data, such as price and volume, is known as technical analysis. Technical analysts aim to predict future market behavior by using insights from market psychology, behavioral economics, and quantitative analysis. Chart patterns and technical (statistical) indicators are the two most common types of technical analysis.

KEY TAKEAWAYS

  • Technical analysis attempts to forecast future price movements, giving traders the information they need to profit.
  • Traders use technical analysis tools on charts to identify potential entry and exit points for trades.
  • The market has processed all available information, which is reflected in the price chart, which is an underlying assumption of technical analysis.

The Power of Candlestick Patterns

Candlestick patterns are one of the most effective technical analysis tools. These patterns can help identify potential trend reversals or continuations and provide valuable insights into market sentiment. Let’s look at some of the most important candlestick patterns:

  1. Engulfing Bullish Pattern
    When a small bearish candle is followed by a larger bullish candle that completely engulfs the previous candle’s range, the bullish engulfing pattern occurs. This pattern indicates a possible trend reversal from bearish to bullish and could indicate a buying opportunity.
  2. Harami Bearish Pattern
    When a large bullish candle is followed by a smaller bearish candle that is completely engulfed by the previous candle’s range, the bearish harami pattern is formed. This pattern suggests a possible trend reversal from bullish to bearish and may serve as a signal to sell or take profits.
  3. The Doji Pattern
    A candlestick pattern with a small body and long wicks on both ends is known as a doji. It represents market indecision and suggests that buyers and sellers are in equilibrium. A doji pattern can indicate a possible trend reversal, especially if it forms at critical support or resistance levels.

Trend Analysis and Moving Averages

Trend analysis is important in technical analysis because it helps traders determine the market’s direction. Moving averages are popular indicators for smoothing out price data and providing a more accurate picture of the underlying trend. Here are some examples of moving averages:

1. Simple Moving Average (SMA)

The simple moving average computes an asset’s average price over a given time period. The 50-day and 200-day moving averages are frequently used by traders to identify long-term trends. When the shorter-term moving average crosses above the longer-term moving average, a bullish signal is generated, indicating the possibility of an uptrend.

2. Exponential Moving Average (EMA)

The exponential moving average gives more weight to recent price data, making it more sensitive to market changes. Many traders prefer to use EMAs because they provide a more immediate indication of trend reversals. For short-term analysis, the 9-day and 21-day EMAs are commonly used.

Support and Resistance Levels

Technical analysis relies heavily on support and resistance levels. A price level at which buying pressure is strong enough to prevent the price from falling further is referred to as support. In contrast, resistance represents a price level where selling pressure is strong enough to prevent the price from rising further. Identifying these levels can assist traders in determining the best entry and exit points.

Using Technical Indicators

Technical indicators are calculated mathematically from price and volume data. They are used to gain more insight into market trends and to confirm or refute potential trading signals. Here are a few popular technical indicators:

  1. RSI (Relative Strength Index)
    The RSI is a momentum oscillator that measures price movement speed and change. It oscillates between 0 and 100, with values greater than 70 indicating overbought conditions and values less than 30 indicating oversold conditions. The RSI is frequently used by traders to identify potential trend reversals or divergences.
  2. MACD (Moving Average Convergence Divergence)
    The MACD is a momentum indicator that follows a trend and consists of two lines: the MACD line and the signal line. When the MACD line crosses above the signal line, a bullish signal is generated, indicating the possibility of an uptrend. When the MACD line crosses below the signal line, it generates a bearish signal, indicating the possibility of a downtrend.

Risk Management and Stop Loss Orders

Without proper risk management techniques, no trading strategy is complete. Stop loss orders can be used to limit potential losses and protect your capital. A stop loss order instructs the seller to sell a security when it reaches a predetermined price level. Set a stop loss to reduce the impact of unexpected market movements and protect your investment.

Conclusion

Finally, mastering the art of technical analysis is critical for profitable stock market trading. You can make better investment decisions if you understand candlestick patterns, trend analysis, support and resistance levels, technical indicators, and risk management techniques. Remember to practice and fine-tune your skills in real-world trading scenarios, as experience is essential in developing technical analysis proficiency.

FOR MORE INFO CLICK THIS SITE:https://learningsharks.in/

FOLLOW OUR PAGE:https://www.instagram.com/learningsharks/?hl=en
Comprehensive Guide to Effective Risk Management in the Stock Market

Risk management is the process of identifying, assessing and controlling financial, legal, strategic and security risks to an organization's capital and earnings.
Risk Management in Stock Market

Introduction

Risk management is critical in the stock market. The stock market is a naturally volatile environment in which risks can arise from a variety of sources, including market trends, economic conditions, company performance, and geopolitical events. As a result, investors must have a well-defined risk management strategy in place to help them mitigate potential losses and maximize returns.


Investors can make informed investment decisions and reduce the impact of market fluctuations on their portfolios by implementing risk management techniques. In this context, the purpose of this essay is to investigate the concept of risk management in the stock market, its significance, and the various strategies that investors can employ to effectively manage risk.

Understanding Risk in the Stock Market

Defining Risk

In the context of the stock market, risk refers to the possibility of loss or fluctuation in investment value. It is influenced by a variety of factors, including market volatility, economic conditions, company-specific events, and geopolitical influences. As an investor, you must recognize and assess these risks in order to protect your capital and maximize your returns.

Types of Risks in Stock Market Investing

  1. Market Risk: Market risk is caused by macroeconomic factors such as interest rates, inflation, and market conditions in general. It affects all securities and is impossible to completely eliminate. Diversification and asset allocation, on the other hand, can help to mitigate its impact.
  2. Company-Specific Risk: This type of risk is related to specific businesses and their operational, financial, or management issues. Poor earnings, legal disputes, or changes in leadership can all have a significant impact on a company’s stock price.
  3. Liquidity Risk: Liquidity risk refers to the difficulty of buying or selling shares without causing significant price changes. Liquidity risk is higher in stocks with low trading volumes and few market participants.
  4. Regulatory Risk: Changes in regulations or shifts in government policies can have a significant impact on stock prices. Investors must keep up to date on regulatory developments that may affect their investments.
  5. Currency Risk: Currency risk occurs when investing in foreign markets because fluctuations in exchange rates can affect investment returns. When considering international investments, it is critical to assess currency risk.

Key Strategies for Effective Risk Management

1. Diversify Your Portfolio

Diversification is a fundamental risk-management strategy that entails spreading investments across various asset classes, industries, and geographical regions. You can reduce the impact of individual stock or sector-specific risks by diversifying your portfolio. It is recommended that you diversify your investments across stocks, bonds, commodities, and other asset classes based on your risk tolerance and investment objectives.

2. Conduct Thorough Research

In the stock market, knowledge is power. Conduct extensive research on companies, industries, and market trends before investing. Financial statements, annual reports, news articles, and analyst opinions can all be used to gain insight into the potential risks and rewards of various investments. This information will help you make better decisions and reduce risks.

3. Set Realistic Financial Goals

Setting clear financial objectives is critical for effective risk management. Define your investment goals, time horizons, and risk tolerance. Setting realistic goals allows you to align your investment strategy and avoid unnecessary risks. Review and update your goals on a regular basis to account for changes in your financial situation and market conditions.

4. Implement Stop Loss Orders

Stop loss orders are effective risk management tools that sell a stock automatically if it reaches a predetermined price. They assist in limiting potential losses by executing trades when the market moves against you. Stop loss orders can give you peace of mind and protect your investments during market volatility.

5. Stay Informed and Adapt

The stock market is volatile, and staying up to date on market developments is critical. Subscribing to reputable financial news sources, following industry experts, and monitoring economic indicators are all good places to start. Furthermore, remain flexible in the face of changing market conditions and adjust your investment strategy accordingly. This proactive approach will allow you to detect and respond to potential risks in real time.

How Does Risk Management Work?

Risk management involves identifying potential risks, assessing their likelihood and potential impact, and implementing risk-mitigation or risk-aversion strategies.

Several steps are usually involved in the risk management process:

  1. Risk Identification: The first step in risk management is identifying potential risks to the investment portfolio. This can be accomplished through a variety of methods, including historical data analysis, market research, and expert opinions.
  2. Risk Assessment: After identifying potential risks, they are evaluated based on their likelihood of occurrence and potential impact on the investment portfolio. This step entails determining the severity of the risk and the likelihood of its occurrence.
  3. Risk Evaluation: Once the risks have been assessed, they are ranked in order of priority and importance. This step entails determining which risks are the most critical and must be addressed immediately.
  4. Risk Treatment: The final step in the risk management process is to put in place strategies to mitigate or avoid the risks that have been identified. Diversification, hedging, and active portfolio management are all methods for accomplishing this.

Conclusion


Finally, risk management is an important aspect of stock market investing. Because the stock market is inherently volatile and rife with risks, implementing a well-defined risk management strategy is critical for mitigating potential losses and maximizing returns. The importance of risk management in the stock market cannot be overstated, as it allows investors to navigate the market’s complexities and achieve their investment goals while maintaining some control over their portfolios. Investors can maximize their returns and achieve long-term financial success by prioritizing risk management in their investment strategy.

FOR MORE INFO CLICK THIS SITE:https://learningsharks.in/

FOLLOW OUR PAGE:https://www.instagram.com/learningsharks/?hl=en

Investing in the Best Stocks for Long-Term Growth

Understanding Long-Term Investing

Before delving into the best stocks for long-term growth, it is critical to first understand what long-term investing entails. Long-term investing entails holding stocks and other securities for an extended period of time, usually several years or more. This strategy allows investors to profit from market trends, compound returns, and reduce short-term volatility.

The Benefits of Long-Term Investing

Long-term investing has several advantages that make it an appealing strategy for investors looking for significant growth. Here are some key advantages:

  1. Compound Returns: Investors can benefit from the compounding effect by reinvesting earnings, dividends, and capital gains over time. This can significantly increase their investment returns over time.
  2. Reduced Market Timing Risks: Even for seasoned investors, timing the market and making short-term gains can be difficult. Long-term investing reduces the impact of short-term market fluctuations, allowing investors to concentrate on the bigger picture.
  3. Opportunity for Wealth Creation: Historically, the stock market has outperformed most other long-term investment options. Investing in high-quality stocks has the potential to generate significant wealth and help investors achieve their financial goals.

Identifying the Best Stocks for Long-Term Growth

We carefully analyzed various factors that contribute to a company’s long-term success to help you identify the best stocks for long-term growth. We have compiled a list of key considerations when evaluating potential investments based on our extensive research and expertise in the field.

1. Strong Financial Performance

It is critical to evaluate a company’s financial performance when evaluating stocks for long-term growth potential. Consistent revenue growth, strong profitability, and a healthy balance sheet are all desirable. Companies with a history of financial stability and growth are more likely to deliver positive long-term returns.

2. Competitive Advantage

Long-term success requires investing in companies that have a sustainable competitive advantage. Look for companies with unique products, strong brand recognition, superior technology, or a large market share. A competitive advantage provides a solid foundation for growth and can assist a company in overcoming market challenges.

3. Industry Growth Potential

When choosing stocks for the long term, look for industries with significant growth potential. Look for industries that are poised to grow significantly as a result of favorable trends, changing demographics, or technological advancements. Investing in such companies can increase your chances of achieving exceptional long-term returns.

4. Management Quality and Vision

The management team of a company is critical to its long-term success. When considering an investment, consider the management team’s expertise, experience, and track record. A company’s ability to navigate challenges and capitalize on opportunities is indicated by strong leadership and a clear strategic vision.

5. Dividends and Shareholder-Friendly Policies

While not all stocks pay dividends, investing in companies with a track record of consistent dividend payments can provide extra income while also contributing to long-term growth. Additionally, companies that prioritize shareholder-friendly policies, such as share buybacks or dividend increases, frequently demonstrate their commitment to delivering value to shareholders.

Key Considerations for Successful Long-Term Investing

1. Time Horizon:

Long-term investing necessitates a lengthy time horizon. It is critical to align your investment decisions with your financial goals and the time required to achieve them. Long-term investments, such as retirement savings, can be allocated to assets with higher growth potential and longer time horizons.

2. Patience and Discipline:

Long-term investing requires patience and discipline. It is critical to stick to your investment strategy and avoid making rash decisions based on short-term market fluctuations. Stick to your plan, review your portfolio on a regular basis, and make adjustments as needed, but avoid reacting rashly to market noise.

3. Research and Due Diligence:

For identifying suitable long-term investment opportunities, thorough research and due diligence are required. Understand the fundamentals of the assets in which you are investing, including the company’s financial health, competitive position, and industry trends. This knowledge will assist you in making sound investment decisions and selecting assets with high long-term growth potential.

4. Regular Portfolio Review:

While long-term investing requires patience, it is still necessary to review your portfolio on a regular basis. Examine the performance of your investments, rebalance as needed, and look for new opportunities that align with your long-term objectives. Regular portfolio reviews ensure that your investments remain consistent with your changing financial goals.

Conclusion

Long-term investing is an effective strategy for financial success. Investors can maximize their wealth-building potential by focusing on the long term, taking advantage of compounding returns, and sticking to a well-thought-out investment plan. Remember that long-term investing requires patience, discipline, diversification, and ongoing portfolio evaluation. Begin investing with a long-term perspective today to lay the groundwork for a prosperous financial future.

FOR MORE INFO CLICK THIS SITE:https://learningsharks.in/

FOLLOW OUR PAGE:https://www.instagram.com/learningsharks/?hl=en

Long-Term Stocks to Invest in 2023

Long-term investing is a popular investment strategy used by astute retail investors to grow their funds. Benjamin Graham, the father of value investing, defined investing intelligence as someone who does not try to time the market but values ‘time in the market’ by selecting investment options that suit you best rather than investing based on hearsay.

When looking for the best stocks to buy in India for the long term, financials must be considered alongside fundamentals and qualitative aspects such as management quality and efficiency. For investors, long term usually means more than 5 years.

This blog has compiled a list of the best Long Term Investment Stocks for 2023.

Best Stocks to Buy in India for Long Term in 2023

 Here is a list of the best shares to buy for long term

S.No.Long Term Stocks IndiaIndustry
1.Reliance IndustriesMultinational Conglomerate
2.Tata Consultancy Services (TCS)Information Technology
3.InfosysInformation Technology
4.HDFC BankBanking
5.Hindustan UnileverFMCG

Best Long Term Stocks India: Overview

The following are some of the choices to invest in for a long term-

1) Reliance Industries

Reliance Industries Limited is an India-based company that operates in the Oil to Chemicals (02C), Oil and Gas, Retail, Digital Services, and Financial Services segments. It is one of the best long-term investments to make.

2) Tata Consultancy Services (TCS)

Tata Consultancy Services Limited (TCS) is an Indian company that offers information technology (IT) services as well as digital and business solutions. It is one of the safest stocks to invest in in India.

3) Infosys

Infosys Limited provides consulting, technology, outsourced services, and next-generation digital services. It is a world-class global leader in digital services and consulting.

4) HDFC Bank

HDFC Bank Limited (the Bank) is a private sector bank based in India. The bank provides a wide range of banking services, including commercial and investment banking on the wholesale side and transactional/branches banking on the retail side.

5) Hindustan Unilever

Hindustan Unilever Limited is a consumer goods company based in India. It is a subsidiary of the British corporation Unilever. It is headquartered in Mumbai and is one of the world’s most well-known FMCG companies. As a result, its stock is frequently a top choice among investors.

Conclusion

This was the list of the top long-term stocks to invest in in 2023. Time allows your returns to compound. If you do not withdraw your returns or interest earned in the middle, your returns will compound on an accumulated number rather than just your principle; your returns will compound exponentially.

Time allows us to eliminate volatility and short-term risks. If you invest Rs 1,000 in year one and earn 10% returns, you will have Rs 1,100 at the end of the year. If you let your money compound over time and do not redeem your returns, you will receive Rs 1,100 in returns the following year.

Repeat this exercise for larger sums of money and for a longer period of time. This is due to the fact that the essence and magic of any investment are in the long run.

FOR MORE INFO CLICK THIS SITE:https://learningsharks.in/

FOLLOW OUR PAGE:https://www.instagram.com/learningsharks/?hl=en

Understanding the Price-to-Earnings Ratio (P/E Ratio)

A high P/E ratio could mean that a company's stock is overvalued, or that investors are expecting high growth rates in the future.
price-to-earnings (P/E)

Introduction

The price-to-earnings (P/E) ratio is a popular financial metric that helps investors determine the worth of a company’s stock. It is a necessary tool for assessing investment opportunities and understanding market sentiment toward a specific stock. This article delves into the complexities of the P/E ratio, its significance, and how investors can use it effectively.

What is the Price-to-Earnings Ratio?

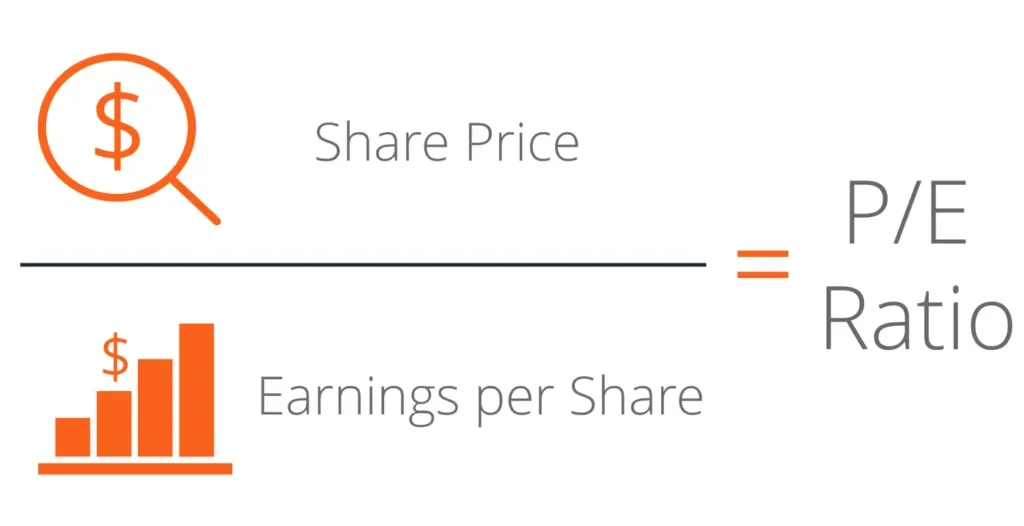
The price-to-earnings ratio, also known as the P/E ratio or simply P/E, is a valuation ratio that compares a company’s stock price to its earnings per share (EPS). It is calculated by dividing a company’s stock market price per share by its earnings per share over a specific time period.

KEY TAKEAWAYS

  • The price-to-earnings (P/E) ratio compares the share price of a company to its earnings per share.
  • A high P/E ratio may indicate that a company’s stock is overvalued or that investors anticipate rapid growth in the future.
  • Companies that have no earnings or are losing money do not have a P/E ratio because the denominator is empty.
  • In practice, two types of P/E ratios are used: forward and trailing P/E.
  • A P/E ratio is most valuable to an analyst when compared to similar companies in the same industry or for a single company over time.

Why is the P/E Ratio Important?

The P/E ratio reveals important information about the market’s expectations and perception of a company’s future earnings potential. Investors can determine whether a stock is overvalued or undervalued by comparing its P/E ratio to that of its peers or the industry average. A high P/E ratio indicates that investors expect future earnings growth to be strong, whereas a low P/E ratio indicates lower growth expectations or potential undervaluation.

Interpreting the P/E Ratio

Understanding High P/E Ratios

A high P/E ratio indicates that investors are willing to pay a premium for the company’s stock because of strong growth prospects or market optimism. It could indicate a company with innovative products, a strong market position, or plans to expand into new markets. However, before making investment decisions based solely on a high P/E ratio, it is critical to consider other factors such as the company’s financial health, competitive landscape, and industry trends.

Analyzing Low P/E Ratios

A low P/E ratio, on the other hand, may indicate that the market is pessimistic about the company’s future prospects. It could be an indication of potential undervaluation, creating an opportunity for value investors. A low P/E ratio, on the other hand, should prompt further investigation into the underlying reasons, such as declining earnings, poor management, or adverse market conditions, to determine whether the stock is a value trap or a genuine investment opportunity.

Different Types of P/E Ratios

Trailing P/E Ratio

The trailing P/E ratio, also known as the historical P/E ratio, is calculated using past earnings data for a company. It gives a snapshot of how the market perceives the company’s past performance. The trailing P/E ratio is commonly used to compare a company’s valuation to its historical trends or the valuation of its competitors.

Forward P/E Ratio

The forward P/E ratio considers a company’s projected earnings for future periods. It takes into account analyst forecasts and market expectations for future growth prospects. Investors frequently use the forward P/E ratio to assess a company’s earnings growth potential and make informed investment decisions.

Limitations of the P/E Ratio

While the P/E ratio is a valuable tool, it does have certain limitations that investors should be aware of:

  1. Earnings Manipulation: Companies can artificially inflate or deflate the P/E ratio by manipulating earnings figures. As a result, it is critical to thoroughly examine a company’s financial statements and assess the quality and sustainability of its earnings.
  2. Variations by Industry: Because of differences in growth rates, risk profiles, and business models, average P/E ratios vary by industry. Comparing the P/E ratios of companies in different industries may not yield accurate results.
  3. Cyclical Nature: The P/E ratio can fluctuate significantly depending on the economic cycle and market conditions. P/E ratios tend to contract during economic downturns or periods of uncertainty, while they expand during bullish market phases.

Advantage of P/E Ratios

  • Relative Valuation: The P/E ratio allows investors to compare a company’s stock valuation to that of its peers or the industry average. This comparative analysis aids in the identification of undervalued or overvalued stocks within a specific sector. Investors can make more informed investment decisions by examining the P/E ratios of similar companies.
  • Future Earnings Growth Expectations: The P/E ratio reveals the market’s expectations for a company’s future earnings growth. A high P/E ratio indicates that investors expect strong earnings growth, which can be advantageous for investors looking for high-growth opportunities. A low P/E ratio, on the other hand, may indicate lower growth expectations, potentially attracting value investors looking for undervalued stocks.
  • Quick Investor Sentiment Analysis: The P/E ratio provides a snapshot of market sentiment toward a company’s stock. A high P/E ratio indicates that investors are optimistic about the company’s growth prospects. A low P/E ratio, on the other hand, may indicate skepticism or concerns about the company’s performance. Understanding investor sentiment can assist investors in determining market expectations and sentiment toward specific stocks.
  • Benchmarking Tool: The P/E ratio enables investors to compare the valuation of a company to its historical performance or competitors in the same industry. Investors can determine whether a company’s current valuation is above or below historical averages by examining the trend of its P/E ratio over time. Furthermore, comparing a company’s P/E ratio to that of its industry peers aids in identifying outliers and providing a broader perspective on relative valuations.
  • Market Timing: The P/E ratio can be useful in market timing strategies. During periods of high P/E ratios, investors should be cautious because stocks may be overvalued. When P/E ratios are low, it may indicate a potential buying opportunity because stocks may be undervalued. Market timing strategies, on the other hand, should be approached with caution and supported by thorough analysis of other indicators.
  • Financial Analysis Simplified: The P/E ratio simplifies the assessment of a company’s financial health and valuation. It simplifies complex financial data into a single metric that is understandable to both novice and experienced investors. This ease of use enables quick company comparisons and aids in the initial screening process when researching potential investment opportunities.

Conclusion


The price-to-earnings ratio is a basic tool that helps investors determine the relative value of a company’s stock. Investors can make informed decisions, identify potential investment opportunities, and manage their portfolios more effectively if they understand the P/E ratio and its implications. However, in order to gain a comprehensive understanding of a company’s financial health and market outlook, it is critical to consider the P/E ratio in conjunction with other financial metrics and conduct extensive research.

FOR MORE INFO CLICK THIS SITE:https://learningsharks.in/

FOLLOW OUR PAGE:https://www.instagram.com/learningsharks/?hl=en

Value Stocks vs. Growth Stocks: A Comprehensive Comparison

Introduction

In today’s volatile financial environment, investors are frequently faced with a critical decision: Should they invest in value stocks or growth stocks? This article will provide a comprehensive comparison of these two investment strategies, allowing you to make more informed decisions and achieve better stock market results.

Understanding Value Stocks

Value stocks are shares of companies that the market believes are undervalued. When compared to their peers, these stocks frequently trade at a lower price-to-earnings (P/E) ratio, indicating that the market may have overlooked their true worth. Value investors seek out these opportunities, believing that the market will eventually recognize these companies’ intrinsic value, resulting in a rise in stock prices.

KEY TAKEAWAYS

  • Because of their future potential, growth stocks are expected to outperform the overall market over time.
  • Value stocks are thought to trade at a discount to their true value.
  • The decision between a growth or value stock strategy must be made in light of the investor’s time horizon and risk tolerance.

Embracing Growth Stocks

Growth stocks, on the other hand, are companies that have a high potential for future growth. These firms frequently operate in emerging industries or have innovative business models capable of driving significant revenue and earnings growth. Growth investors seek out such companies and are willing to pay a premium for their shares, betting on their ability to deliver impressive long-term returns.

Performance Comparison

We will look at a number of key factors to assess the performance of value and growth stocks.

Historical Returns

Value stocks have historically outperformed growth stocks over the long term. During market downturns or when investors shift their focus to more conservative investments, these stocks tend to perform well. Value stocks frequently provide stability and income through dividends, making them appealing to value investors.

Growth stocks, on the other hand, have the potential for explosive price appreciation, particularly during bull markets. When the economy is expanding and investors are willing to take on more risk, these stocks tend to perform well. Growth stocks, on the other hand, can be more volatile and subject to market fluctuations.

Valuation Metrics

When evaluating value stocks, investors frequently consider valuation metrics such as price-to-earnings (P/E), price-to-book (P/B), and dividend yield. These metrics assist in determining whether a stock is undervalued in comparison to its intrinsic value.

Growth stocks, on the other hand, are assessed using metrics such as the rate of revenue growth, the rate of earnings growth, and the forward price-to-earnings ratio (Forward P/E). Investors in growth stocks are concerned with the company’s ability to grow its market share in the future.

Risks and Considerations

Value Stocks

While value stocks can provide stability and income potential, they are not without risk. Some important factors to consider when investing in value include:

  1. Value traps: Some businesses may appear to be undervalued, but they have underlying issues that prevent them from reaching their full potential.
  2. Economic Factors: Value stocks are susceptible to economic conditions and may underperform during recessions.
  3. Market Sentiment: The performance of value stocks can be influenced by investor sentiment, resulting in short-term fluctuations.

Growth Stocks

Investors should be aware of the following risks when investing in growth stocks:

  1. Concerns about valuation: High-growth stocks frequently trade at premium valuations, leaving little room for error.
  2. Competitive Environment: Rapidly growing industries attract fierce competition, which can have an impact on a company’s growth trajectory.
  3. Market Volatility: Growth stocks are more volatile, with large price swings in response to market conditions.

Conclusion

Finally, the decision between value stocks and growth stocks is ultimately determined by your investment objectives, risk tolerance, and market outlook. Both strategies have their advantages and potential returns, but they also have their drawbacks.

Understanding the characteristics and considerations of each strategy allows you to make informed investment decisions that are in line with your financial goals. To maximize your investment outcomes, conduct thorough research, diversify your portfolio, and seek advice from financial professionals.

FOR MORE INFO CLICK THIS SITE:https://learningsharks.in/

FOLLOW OUR PAGE:https://www.instagram.com/learningsharks/?hl=en