Zee Entertainment and IndusInd Bank have notified NCLAT that they have resolved their payment dispute, clearing the door for the Sony transaction.
On Wednesday, IndusInd Bank informed the NCLT that it will likewise drop its opposition to Zee Entertainment’s merger with a regional Sony subsidiary.
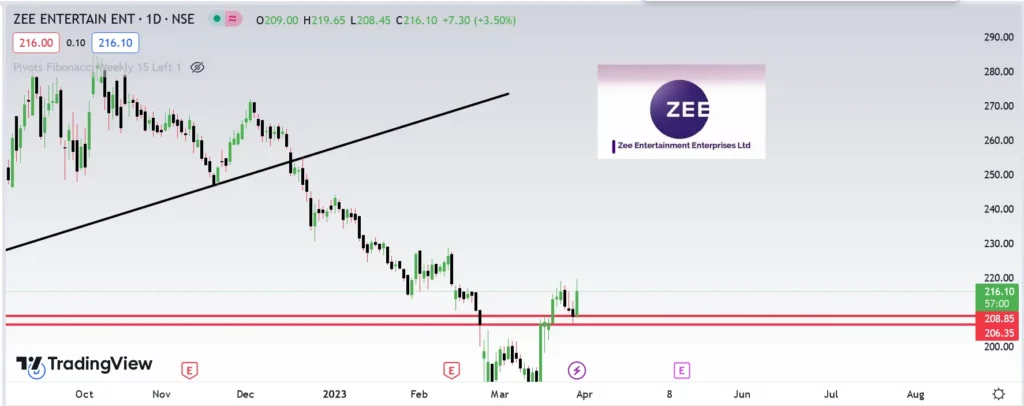
The share price of Zee Entertainment increased by as much as 4.4% to close to a one-week high.
Let us look at the fundamentals
Profit & Loss
Consolidated Figures in Rs. Crores / View Standalone
| Mar 2011 | Mar 2012 | Mar 2013 | Mar 2014 | Mar 2015 | Mar 2016 | Mar 2017 | Mar 2018 | Mar 2019 | Mar 2020 | Mar 2021 | Mar 2022 | TTM |
|---|
| Sales + | 3,009 | 3,040 | 3,700 | 4,422 | 4,884 | 5,812 | 6,434 | 6,686 | 7,934 | 8,130 | 7,730 | 8,189 | 8,308 |
| Expenses + | 2,180 | 2,291 | 2,743 | 3,215 | 3,624 | 4,386 | 4,711 | 4,605 | 5,370 | 6,870 | 6,123 | 6,471 | 6,910 |
| Operating Profit | 829 | 749 | 957 | 1,207 | 1,260 | 1,427 | 1,723 | 2,081 | 2,564 | 1,260 | 1,606 | 1,718 | 1,398 |
| OPM % | 28% | 25% | 26% | 27% | 26% | 25% | 27% | 31% | 32% | 15% | 21% | 21% | 17% |
| Other Income + | 101 | 128 | 144 | 178 | 222 | 183 | 1,430 | 565 | 236 | 112 | -29 | -12 | -240 |
| Interest | 9 | 5 | 9 | 16 | 10 | 160 | 137 | 145 | 130 | 145 | 57 | 45 | 69 |
| Depreciation | 29 | 32 | 40 | 50 | 67 | 78 | 115 | 182 | 235 | 271 | 265 | 246 | 318 |
| Profit before tax | 892 | 841 | 1,052 | 1,319 | 1,404 | 1,373 | 2,901 | 2,319 | 2,434 | 956 | 1,256 | 1,416 | 771 |
| Tax % | 30% | 30% | 32% | 33% | 31% | 40% | 23% | 36% | 36% | 45% | 37% | 32% | |
| Net Profit | 625 | 591 | 717 | 890 | 972 | 824 | 2,220 | 1,478 | 1,567 | 525 | 793 | 956 | 426 |
| EPS in Rs | 6.51 | 6.14 | 7.54 | 9.29 | 10.18 | 8.57 | 23.13 | 15.40 | 16.32 | 5.48 | 8.33 | 10.04 | 4.43 |
| Dividend Payout % | 31% | 24% | 27% | 24% | 22% | 26% | 11% | 19% | 21% | 5% | 30% | 30% | |
| Compounded Sales Growth |
|---|
| 10 Years: | 10% |
| 5 Years: | 5% |
| 3 Years: | 1% |
| TTM: | 6% |
| Compounded Profit Growth |
|---|
| 10 Years: | 6% |
| 5 Years: | -4% |
| 3 Years: | -13% |
| TTM: | -48% |
| Stock Price CAGR |
|---|
| 10 Years: | 0% |
| 5 Years: | -18% |
| 3 Years: | 18% |
| 1 Year: | -27% |
| Return on Equity |
|---|
| 10 Years: | 14% |
| 5 Years: | 12% |
| 3 Years: | 9% |
| Last Year: | 10% |
Balance Sheet
Consolidated Figures in Rs. Crores / View StandaloneCORPORATE ACTIONS
| Mar 2011 | Mar 2012 | Mar 2013 | Mar 2014 | Mar 2015 | Mar 2016 | Mar 2017 | Mar 2018 | Mar 2019 | Mar 2020 | Mar 2021 | Mar 2022 | Sep 2022 |
|---|
| Share Capital + | 98 | 96 | 95 | 2,113 | 2,115 | 96 | 96 | 1,240 | 837 | 394 | 96 | 96 | 96 |
| Reserves | 3,000 | 3,340 | 3,816 | 2,625 | 3,435 | 4,708 | 6,594 | 7,466 | 8,828 | 9,248 | 9,998 | 10,767 | 10,776 |
| Borrowings + | 2 | 2 | 3 | 3 | 2 | 1,716 | 2,203 | 382 | 374 | 352 | 423 | 76 | 300 |
| Other Liabilities + | 773 | 878 | 1,160 | 3,308 | 3,473 | 1,446 | 1,364 | 3,186 | 3,636 | 2,722 | 2,301 | 2,300 | 2,751 |
| Total Liabilities | 3,873 | 4,315 | 5,074 | 6,032 | 7,006 | 7,966 | 10,258 | 11,130 | 12,933 | 12,418 | 12,819 | 13,240 | 13,923 |
| Fixed Assets + | 810 | 920 | 991 | 1,073 | 1,138 | 1,333 | 916 | 1,476 | 1,414 | 1,315 | 1,191 | 1,225 | 1,494 |
| CWIP | 1 | 20 | 7 | 100 | 88 | 110 | 156 | 92 | 156 | 83 | 75 | 87 | 7 |
| Investments | 696 | 800 | 792 | 829 | 976 | 1,148 | 1,343 | 1,529 | 976 | 325 | 798 | 65 | 56 |
| Other Assets + | 2,366 | 2,576 | 3,285 | 4,030 | 4,805 | 5,375 | 7,843 | 8,033 | 10,386 | 10,695 | 10,754 | 11,862 | 12,366 |
| Total Assets | 3,873 | 4,315 | 5,074 | 6,032 | 7,006 | 7,966 | 10,258 | 11,130 | 12,933 | 12,418 | 12,819 | 13,240 | 13,923 |