Firstly, Volume is particularly important in technical analysis since it helps us confirm trends and patterns. Consider volumes to acquire insight into how other market participants perceive the market.
Secondly, Volumes show how many shares are bought and sold in a certain time period. The bigger the volume, the more active the share. For example, suppose you decide to buy 100 Amara Raja Batteries shares for $485 and I decide to sell 100 Amara Raja Batteries shares at $485. A price and quantity match occurs, resulting in a deal. You and I have created a total of 100 shares. Many people consider volume to be 200 (100 buys + 100 sales), which is not the correct way to think about volumes.
Thirdly, The hypothetical scenario below should help you understand how volumes accumulate on a normal trading day:
Sl No | Time | Buy Quantity | Sell Quantity | Price | Volume | Cumulative Volume |
1 | 9:30 AM | 400 | 400 | 62.2 | 400 | 400 |
2 | 10:30 AM | 500 | 500 | 62.75 | 500 | 900 |
3 | 11:30 AM | 350 | 350 | 63.1 | 350 | 1250 |
4 | 12:30 PM | 150 | 150 | 63.5 | 150 | 1400 |
5 | 1:30 PM | 625 | 625 | 64.75 | 625 | 2025 |
6 | 2:30 PM | 475 | 475 | 64.2 | 475 | 2500 |
7 | 3:30 PM | 800 | 800 | 64.5 | 800 | 3300 |
For example, At 9:30 a.m., 400 shares were traded at a price of 62.20. After an hour, 500 shares were trading at 62.75. If you checked the overall volume for the day at 10:30 a.m., it would be 900 (400 + 500). Similarly, at 11:30 AM, 350 shares were traded at 63.10, and the volume was 1,250 (400+500+350). And so on and so on.
At last, Here’s a live market screenshot showcasing the volumes for some of the stocks. The screenshot was taken at approximately 2:55 PM on August 5, 2014.
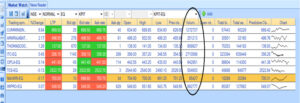
Along with, The volume for Cummins India Limited is 12,72,737 shares, as you can see. The volume on Naukri (Info Edge India Limited) is also 85,427 shares.
On the other hand, The volume information displayed here is the total volume. At 2:55 PM, a total of 12,72,737 Cummins shares were traded at various price points ranging from 634.90 (low) to 689.85 (high) (high).
While, With 35 minutes till the markets close, it is only natural for volumes to rise (assuming traders continue to trade the stock for the rest of the day). In fact, here’s another screenshot from 3:30 PM of the same group of stocks, this time with volume highlighted.
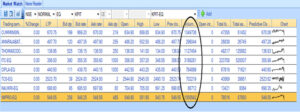
As well as, As you can see, Cummins India Limited’s volume has climbed from 12,72,737 to 13,49,736. As a result, the volume for Cummins India for the day is 13,49,736 shares. The volume for Naukri has climbed from 85,427 to 86,712, bringing the total volume for the day 86,712 shares. It is important to note that the quantities shown here are cumulative.
The volume trend table
Importantly, Volume information is completely meaningless on its own. We know, for example, that the volume on Cummins India is 13,49,736 shares. So, how useful is this information on its own? When you think about it, it has no merit and hence means nothing. However, when you combine today’s volume data with the previous price and volume trend, volume data becomes more important.
Moreover, A summary of how to use volume information is provided in the table below:
Sl No | Price | Volume | What is the expectation? |
1 | Increases | Increases | Bullish |
2 | Increases | Decreases | Caution – weak hands buying |
3 | Decreases | Increases | Bearish |
4 | Decreases | Decreases | Caution – weak hands selling |
I believe that, According to the first line of the table above, when the price rises alongside an increase in volume, the anticipation is bullish.
Besides, Before we get into the details of the chart above, consider this: we’re talking about an ‘increase in volume.’ What exactly does this mean? What is the starting point? Should it be an increase over the previous day’s volume or the aggregate volume over the previous week?
Surely, Traders typically compare today’s volume to the average of the previous ten days’ volume. The general rule of thumb is as follows:
High Volume = Today’s volume > last 10 days average volume
Low Volume = Today’s volume < last 10 days average volume
Average Volume = Today’s volume = last 10 days average volume
To get the last 10-day average, simply draw a moving average line on the volume bars, and you’re done. Moving averages will, of course, be covered in the following chapter.
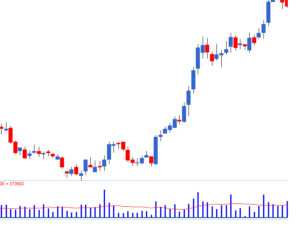
Undoubtedly, The volumes are indicated by blue bars in the chart above (at the bottom of the chart). The 10-day average is indicated by the red line placed on the volume bars. As you can see, all of the volume bars that are over the 10-day average can be interpreted as the increased volume where some institutional engagement (or large involvement) has occurred.
Keeping this in mind, I recommend you look at the volume – price table.
The thought process behind the volume trend table
Clearly, When institutional investors purchase or sell, they clearly do not do so in small increments. Consider India’s LIC, which is one of the country’s largest domestic institutional investors. Indeed, Do you believe they’d acquire 500 shares of Cummins India if they bought them? They would very certainly buy 500,000 shares, if not more. Furthermore, If they bought 500,000 shares on the open market, the volume would begin to rise. Furthermore, because they are purchasing a big number of shares, the share price tends to rise. Institutional money is commonly referred to as “smart money.” It is widely assumed that smart money’ always makes better market decisions than retail traders. As a result, following smart money appears to be a prudent decision.
Especially, If both the price and the volume are rising, it can only suggest one thing: a major player is interested in the stock. Based on the concept that clever money always makes wise decisions, the expectation becomes bullish, and one should hunt for a buying opportunity in the stock.
Similarly, As a corollary, anytime you decide to buy, make sure the quantities are substantial. Yet, This implies you’re investing with smart money.
This is exactly what the first row of the volume trend table shows: as both price and volume rise, anticipation rises.
What do you believe happens when the price rises but the volume falls, as shown in the second row?
Consider it in the following terms:
- Why is the price going up?
- As a result of market participants purchasing
- Are any institutional purchasers involved in the price increase?
- Most likely not.
- How would you know if there are no significant purchases by institutional investors?
- Simply said, if they were buying, the volumes would have climbed rather than decreased.
- So, what does a rise in price accompanied by a decrease in volume indicate?
- It means that the price is rising as a result of low retail activity and ineffective purchasing. As a result, you should be wary because this could be a trap.
According to the third row, a decline in price combined with an increase in volume signals a bearish outlook in the future. Why do you believe this?
Definitely, A decline in price suggests that the stock is being sold by market players. The existence of smart money is indicated by an increase in volume. Both events (price decrease + volume increase) signal that the smart money is selling equities. Based on the notion that smart money always makes wise decisions, the expectation is bearish, and one should consider selling the stock.
Absolutely, As a corollary, whenever you decide to sell, make sure the volumes are adequate. This suggests that you, like the smart money, are selling.
Moving forward, what do you think will happen if both volume and price fall, as seen in the fourth row?
Consider it in the following terms:
- Why is the price falling?
- Because players in the market are selling.
- Are there any institutional sellers involved in the price drop?
- Most likely not.
- How would you know there are no significant sell orders from institutional investors?
- Simply put, if they were selling, the volume would rise rather than fall.
- So how would you interpret a drop in price and a drop in volume?
- It means that prices fall as a result of low retail involvement and ineffective (read: smart money) selling. As a result, you should be cautious because this could be a bear trap.
Revisiting the checklist
Let us go over the checklist again and evaluate it in terms of volume. Consider the following hypothetical technical condition in a stock:
- The appearance of a bullish engulfing pattern – this indicates a long trade for the reasons stated above.
- A level of support at the low of a bullish engulfing – support signals demand. As a result, the appearance of a bullish engulfing pattern around the support level indicates that there is certainly considerable demand for the stock, and the trader might consider purchasing it.
- The trader receives double confirmation to go long with a recognisable candlestick pattern and support at the stoploss.
In addition to this, Imagine heavy volumes on the second day of the bullish engulfing pattern, i.e. on P2, in addition to support at the low (blue candle). What conclusions can you draw from this?
Apart from this, The conclusion is obvious: big volumes and a price increase indicate that major, prominent market participants are positioning themselves to buy the stock.
Despite, All three independent factors, namely candlesticks, S&R, and volumes, point to the same move, namely going long. If you’re paying attention, this is a triple confirmation!
Also, I want to emphasise the importance of volumes in helping traders confirm trades. As a result, it is a crucial component that must be mentioned in the checklist.
The modified checklist now reads as follows:
- First, The stock should develop a distinct candlestick pattern.
- Second, S&R should confirm the transaction. The stop-loss price should be near S&R.
- For a long trade, the pattern’s low should be near the support.
- For a short trade, the pattern’s high should be near the resistance.
- Third, Volumes should back up the trade.
- Above-average volume on both the purchase and sale days
- Low quantities are not encouraging, therefore feel free to be hesitant to enter a trade where volumes are low.
Conclusion
Volumes are utilised to confirm a trend. If you buy 100 shares and sell 100 shares, the overall volume is 100, not 200.
The end-of-day volume represents the total volume of trades executed throughout the day.
The existence of smart money is indicated by high volumes.
Low volumes suggest a lack of retail activity.
When you start a trade, whether long or short, always check to see if volumes confirm.
Avoid trading on days with low volume.