
What is a Candlestick Pattern
A technical technique known as a candlestick chart condenses data from many time frames into a single price bar. They are therefore more beneficial than conventional open, high, low, close (OHLC) bars or straightforward lines that connect closing price dots. Candlesticks create patterns that, when finished, may be used to forecast price movement.
Candlesticks are typically employed daily with the theory that each candle represents a complete day’s worth of news, data, and price movement. This implies that swing or longer-term traders might benefit more from candles.
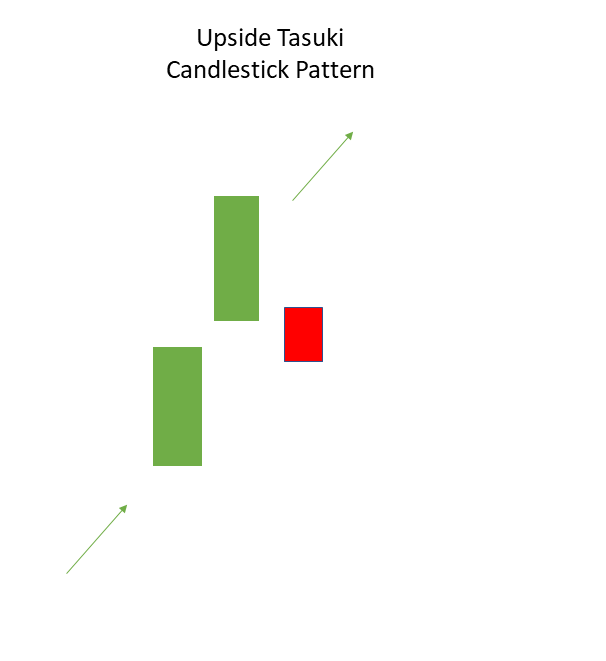
Upside Tasuki Gap
It is a bullish continuation candlestick pattern that has developed during an uptrend that is still present.
Three candles make up this candlestick pattern, the first of which is a long-bodied bullish candlestick produced following a gap up, and the second of which is a bullish candlestick chart as well.
A bearish candle that closes the space left between the first two bullish candlesticks is the third candlestick.
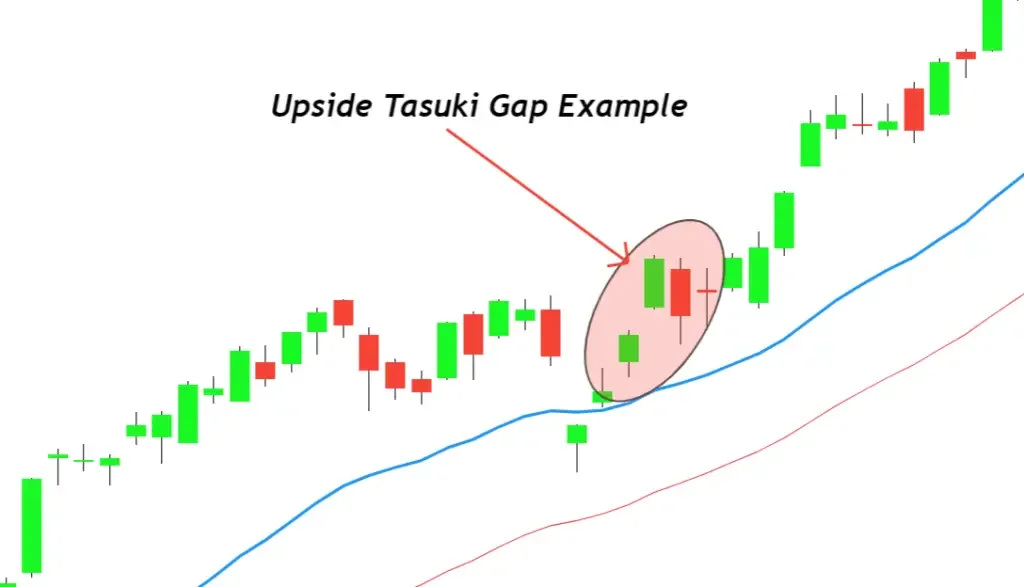
Example:
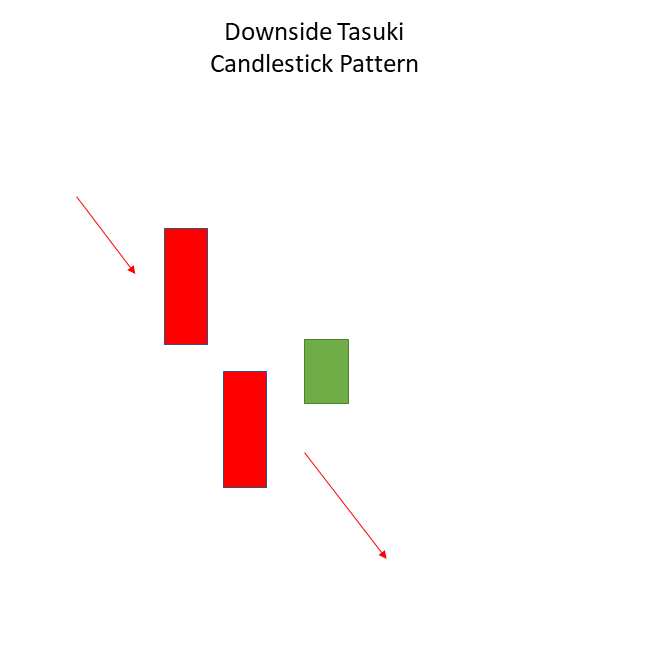
Downside Tasuki Gap
It is a continuous downtrend-related bearish continuation candlestick pattern.
Three candles make up this candlestick pattern, the first of which is a long-bodied bearish candlestick created following a gap down. The second candlestick is also a bearish candlestick.
A bullish candle that fills the space left open by the first two bearish candles is the third candlestick.
Example:
Disclaimer : The information mentioned above is merely an opinion and should only be treated for educational purposes. If you have any questions or feedback about this article, you can write us back. To reach out, you can use our contact us page.