
What are Chart Patterns
Transitions between rising and sliding trends are frequently indicated by stock chart patterns. Using a sequence of trendlines and/or curves, one can identify a price pattern, which is a recognizable configuration of price movement.
A continuation pattern develops when the trend continues in its current direction after a brief pause; a reversal pattern emerges when a price pattern signifies a shift in trend direction.
What is a Candlestick Pattern
A technical technique known as a candlestick chart condenses data from many time frames into a single price bar. They are therefore more beneficial than conventional open, high, low, close (OHLC) bars or straightforward lines that connect closing price dots. Candlesticks create patterns that, when finished, may be used to forecast price movement.
Candlesticks are typically employed daily with the theory that each candle represents a complete day’s worth of news, data, and price movement. This implies that swing or longer-term traders might benefit more from candles.
Most importantly, every candle has a tale to tell. The best way to look at a candle is as a competition between buyers and sellers. A light candle (green or white are usual default displays) indicates that the day belonged to the purchasers, whilst a dark candle (red or black) indicates that the day belonged to the sellers.
But what makes candlesticks so appealing as a charting tool is what transpires between the open and the close, as well as the struggle between buyers and sellers.
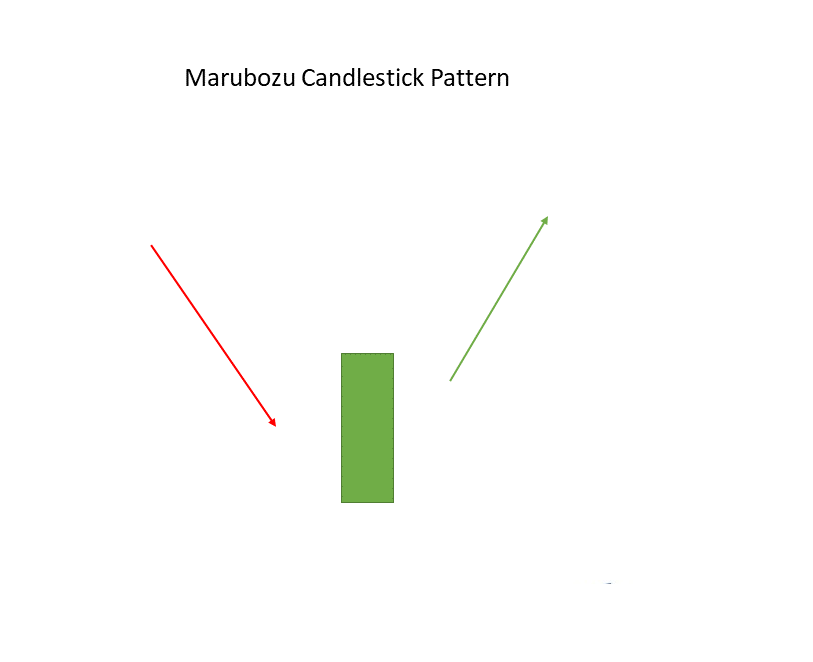
White Marubozu
After a slump, the White Marubozu is a single candlestick pattern that denotes a bullish reversal.
The markets may turn bullish since this candlestick has a long bullish body and no upper or lower shadows, which indicates that the bulls are applying purchasing pressure.
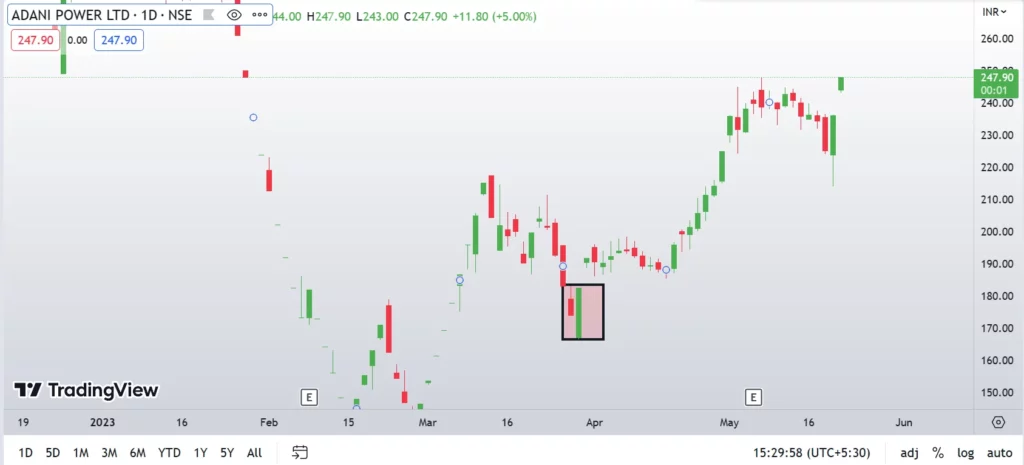
Example:
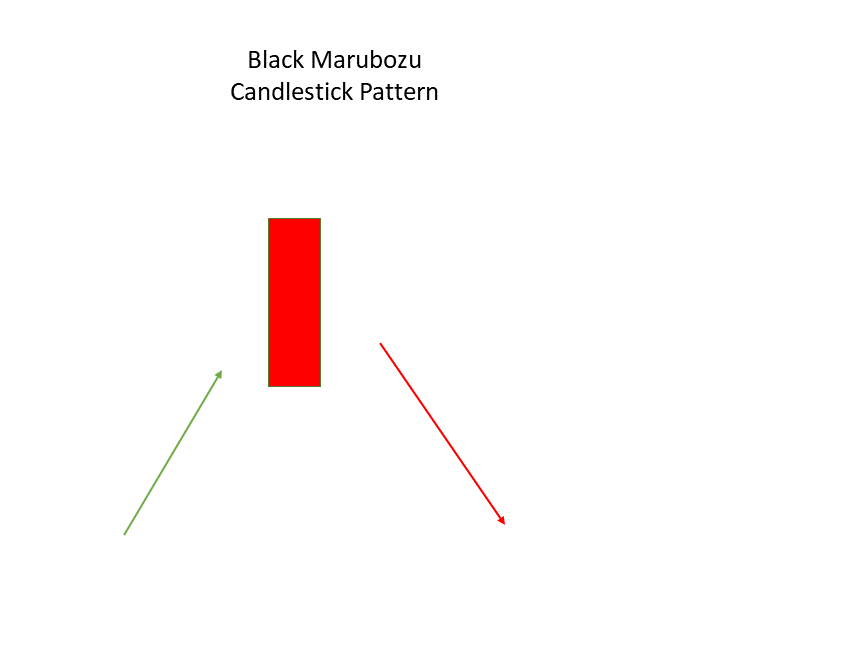
Black Marubozu
After an uptrend, the Black Marubozu is a single candlestick pattern that denotes a bearish reversal.
With no upper or lower shadows and a long bearish body, this candlestick pattern indicates that the bears are applying selling pressure and that the markets may become negative.
The purchasers should exercise cautious and close their positions when this candle forms.
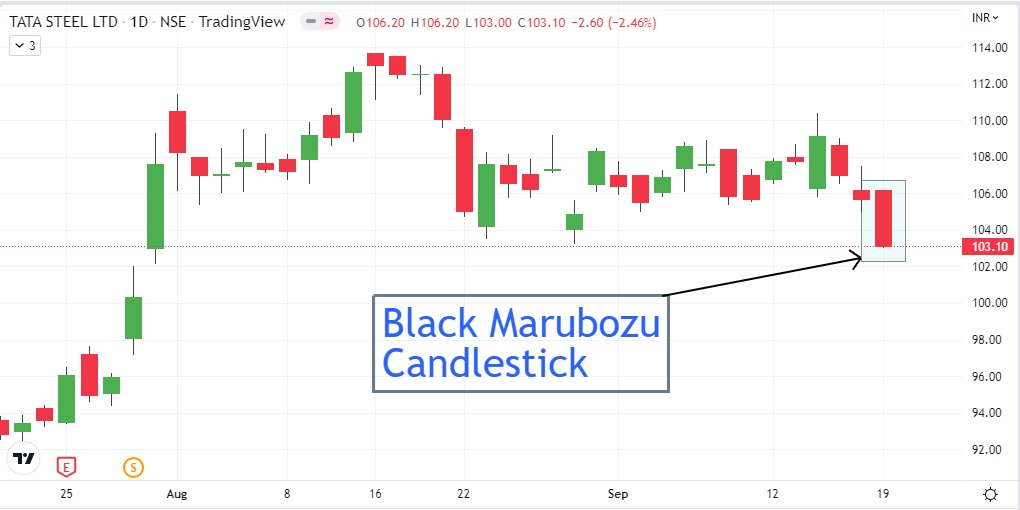
Example:
Disclaimer : The information mentioned above is merely an opinion and should only be treated for educational purposes. If you have any questions or feedback about this article, you can write us back. To reach out, you can use our contact us page.