
What are Candle Patterns
Candlestick charts are a technical tool that packs data for multiple time frames into single price bars. This makes them more useful than traditional open, high, low, close (OHLC) bars or simple lines that connect the dots of closing prices. Candlesticks build patterns that may predict price direction once completed. Proper color coding adds depth to this colorful technical tool, which dates back to 18th century Japanese rice traders.
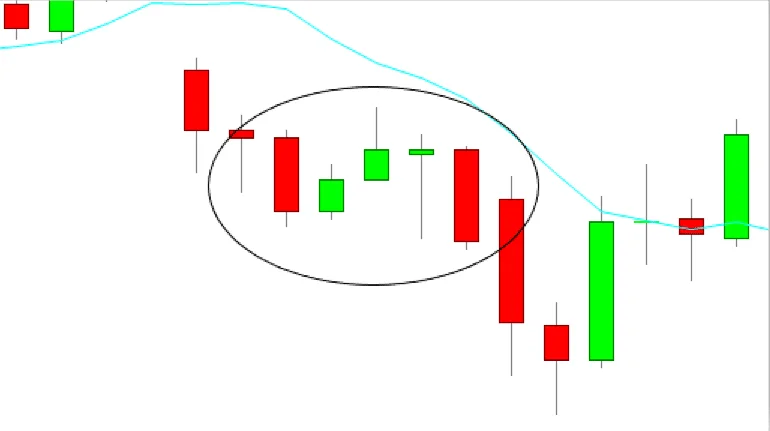
Falling Three Methods
The “falling three methods” is a five-candle bearish continuation pattern that denotes a break in the current downward trend but not a turn around.
The candlestick pattern consists of three shorter counter-trend candlesticks in the Centre and two longer downtrend candlestick charts at the beginning and finish of the pattern.
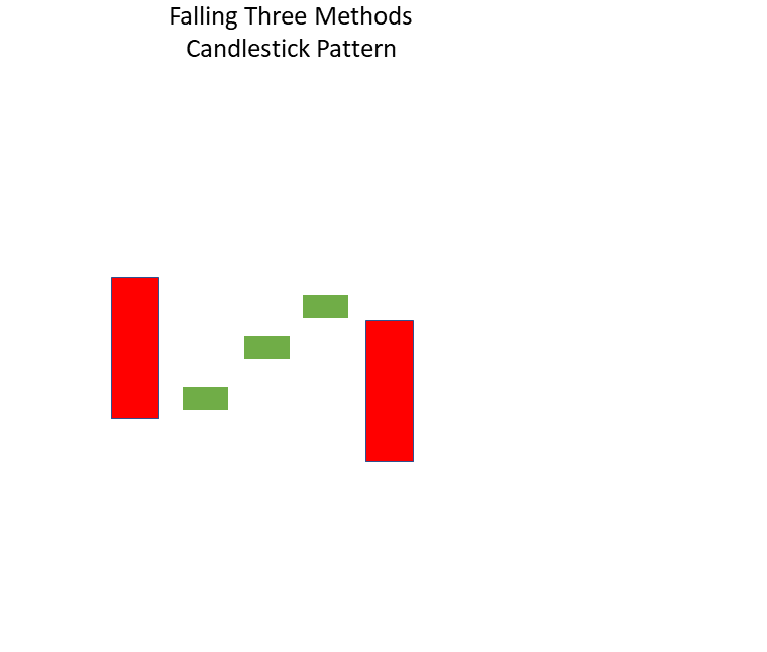
Example:
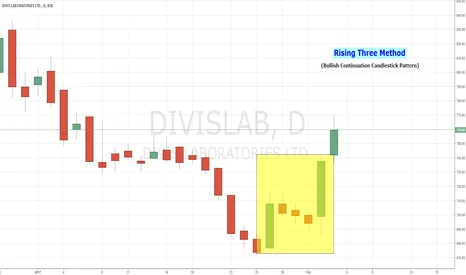
Rising Three Methods:
The “rising three methods” is a bullish, five-candle continuation pattern that denotes a break in the current uptrend without a trend reversal.
Two lengthy candlesticks in the direction of the trend, in this example an uptrend, make up the candlestick pattern. three shorter counter-trend candlesticks in the middle, with two longer candlesticks at the start and end.

Example:
Disclaimer : The information mentioned above is merely an opinion and should only be treated for educational purposes. If you have any questions or feedback about this article, you can write us back. To reach out, you can use our contact us page Support@learningsharks.in