The stock has increased by 51% over the last six months, compared to the S&P BSE Sensex’s 8% gain. Power Finance Corporation (PFC) shares increased 5% intraday on the National Stock Exchange (NSE) on Tuesday amid high volumes, reaching a high of over five years at Rs 157.80. The share price of a publicly traded financial institution reached its highest level since May 2017.
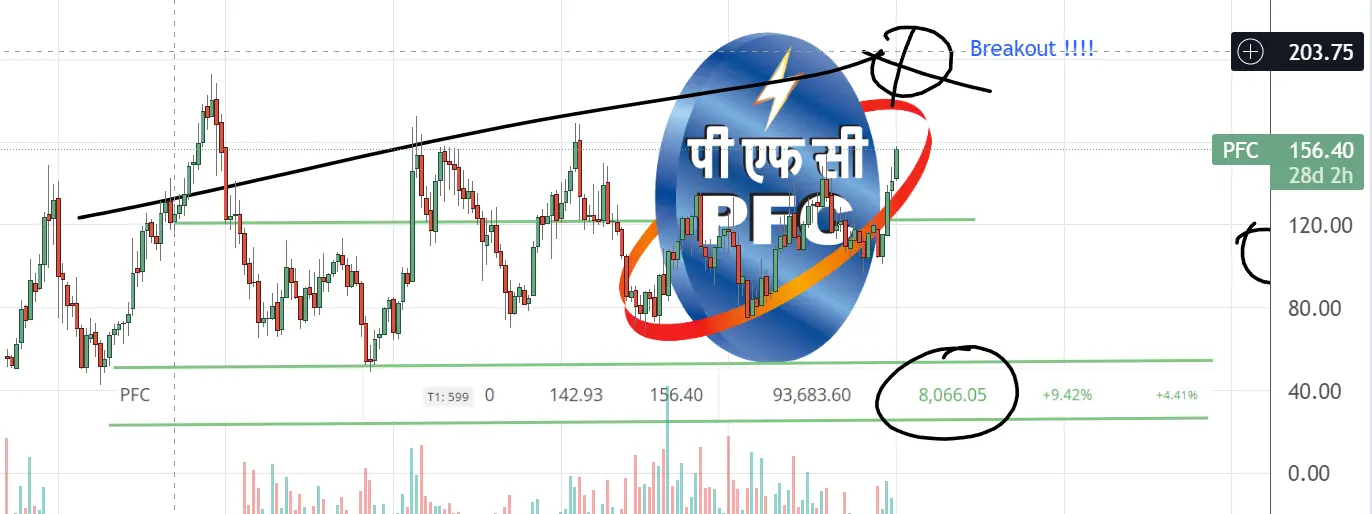
Here’s our current position in PFC share corporation after the breakout from last week.

Let’s look at the Technical analysis of this stock and try to create some support and resistance 4 hours time frame.

PFC Share chart weekly
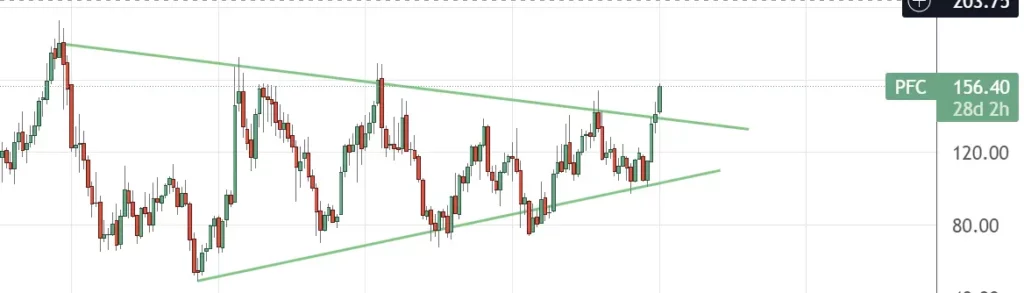
The stock has broken its resistance but will come back to restest it, so you can start accumulating this stock in smaller quantities. Now that we have looked at the Technical of the stocks. Let’s talk about the fundamentals of PFC corporation.
Profit & Loss
Consolidated Figures in Rs. Crores / View Standalone
| Mar 2011 | Mar 2012 | Mar 2013 | Mar 2014 | Mar 2015 | Mar 2016 | Mar 2017 | Mar 2018 | Mar 2019 | Mar 2020 | Mar 2021 | Mar 2022 | TTM | |
|---|---|---|---|---|---|---|---|---|---|---|---|---|---|
| Revenue | 10,178 | 13,092 | 17,314 | 21,407 | 24,988 | 27,861 | 27,581 | 48,624 | 54,106 | 62,189 | 71,656 | 76,262 | 75,897 |
| Interest | 6,426 | 8,595 | 10,995 | 13,053 | 15,456 | 16,657 | 16,768 | 30,289 | 34,627 | 40,845 | 44,684 | 44,709 | 44,411 |
| Expenses + | 197 | 351 | 331 | 748 | 1,103 | 2,042 | 5,538 | 6,583 | 1,696 | 7,332 | 7,102 | 8,215 | 7,881 |
| Financing Profit | 3,555 | 4,146 | 5,987 | 7,607 | 8,429 | 9,162 | 5,275 | 11,752 | 17,783 | 14,012 | 19,871 | 23,338 | 23,605 |
| Financing Margin % | 35% | 32% | 35% | 36% | 34% | 33% | 19% | 24% | 33% | 23% | 28% | 31% | 31% |
| Other Income + | 36 | 5 | 12 | 23 | 25 | 25 | 30 | 42 | 94 | 105 | 46 | 79 | 80 |
| Depreciation | 5 | 6 | 6 | 5 | 8 | 20 | 41 | 15 | 15 | 24 | 25 | 35 | 42 |
| Profit before tax | 3,586 | 4,146 | 5,994 | 7,624 | 8,446 | 9,167 | 5,264 | 11,779 | 17,862 | 14,093 | 19,891 | 23,382 | 23,643 |
| Tax % | 26% | 26% | 26% | 28% | 29% | 33% | 58% | 25% | 29% | 33% | 21% | 20% | |
| Net Profit | 2,647 | 3,059 | 4,438 | 5,462 | 6,004 | 6,184 | 2,236 | 8,797 | 12,640 | 9,477 | 15,716 | 18,768 | 18,999 |
| EPS in Rs | 11.53 | 11.59 | 16.81 | 20.69 | 22.74 | 23.42 | 8.47 | 25.34 | 37.58 | 26.98 | 44.50 | 53.08 | 53.55 |
Balance Sheet
Consolidated Figures in Rs. Crores / View StandaloneCORPORATE ACTIONS
| Mar 2011 | Mar 2012 | Mar 2013 | Mar 2014 | Mar 2015 | Mar 2016 | Mar 2017 | Mar 2018 | Mar 2019 | Mar 2020 | Mar 2021 | Mar 2022 | Sep 2022 | |
|---|---|---|---|---|---|---|---|---|---|---|---|---|---|
| Share Capital + | 1,148 | 1,320 | 1,320 | 1,320 | 1,320 | 1,320 | 2,640 | 2,640 | 2,640 | 2,640 | 2,640 | 2,640 | 2,640 |
| Reserves | 14,093 | 19,473 | 22,360 | 26,202 | 31,091 | 34,708 | 34,205 | 37,194 | 44,481 | 46,760 | 58,127 | 69,036 | 73,866 |
| Borrowings + | 76,275 | 110,126 | 139,473 | 159,215 | 187,795 | 200,660 | 202,993 | 441,151 | 539,488 | 596,561 | 659,682 | 660,476 | 674,847 |
| Other Liabilities + | 13,210 | 4,763 | 6,178 | 7,582 | 8,705 | 10,531 | 19,700 | 41,546 | 42,260 | 48,560 | 55,257 | 58,848 | 59,887 |
| Total Liabilities | 104,725 | 135,682 | 169,330 | 194,320 | 228,912 | 247,220 | 259,537 | 522,531 | 628,869 | 694,521 | 775,707 | 791,000 | 811,240 |
| Fixed Assets + | 75 | 77 | 75 | 72 | 102 | 198 | 296 | 161 | 196 | 238 | 341 | 719 | 737 |
| CWIP | 2 | 0 | 0 | 1 | 2 | 47 | 105 | 129 | 199 | 288 | 336 | 53 | 41 |
| Investments | 27 | 27 | 27 | 27 | 528 | 2,230 | 3,145 | 5,493 | 4,604 | 4,404 | 3,499 | 3,774 | 5,103 |
| Other Assets + | 104,622 | 135,578 | 169,229 | 194,220 | 228,280 | 244,745 | 255,990 | 516,749 | 623,871 | 689,590 | 771,530 | 786,454 | 805,359 |
| Total Assets | 104,725 | 135,682 | 169,330 | 194,320 | 228,912 | 247,220 | 259,537 | 522,531 | 628,869 | 694,521 | 775,707 | 791,000 | 811,240 |
Shareholding Pattern
Numbers in percentages DEALS / TRADES
| Dec 2019 | Mar 2020 | Jun 2020 | Sep 2020 | Dec 2020 | Mar 2021 | Jun 2021 | Sep 2021 | Dec 2021 | Mar 2022 | Jun 2022 | Sep 2022 | |
|---|---|---|---|---|---|---|---|---|---|---|---|---|
| Promoters + | 55.99 | 55.99 | 55.99 | 55.99 | 55.99 | 55.99 | 55.99 | 55.99 | 55.99 | 55.99 | 55.99 | 55.99 |
| FIIs + | 18.90 | 18.92 | 17.45 | 16.81 | 17.37 | 17.32 | 17.35 | 17.88 | 16.71 | 16.76 | 16.21 | 16.82 |
| DIIs + | 20.26 | 20.40 | 21.12 | 20.67 | 20.18 | 19.55 | 19.37 | 13.66 | 13.58 | 13.58 | 12.74 | 17.22 |
| Public + | 4.85 | 4.68 | 5.43 | 6.53 | 6.45 | 7.14 | 7.28 | 12.47 | 13.72 | 13.66 | 15.05 | 9.95 |
Conclusion
Overall, the stock is a buying opportunity. One can expect 30-40% upside from this price in the coming 4-6 months. or even before. This is not a buying call, but purely for educational purposes. Learning sharks institute has taught over 100+ students, and if you are interested in learning how to find stocks like these. Read our courses here.
#sharemarket #pfcshare #stockmarket #technical analysis
Date: 03-01-2023
Writer: Vijay verma