Following the government’s decision to lower the windfall tax on diesel export, shares of upstream companies including Oil and Natural Gas Corporation (ONGC), Oil India Limited (OIL), Mangalore Refinery & Petrochemicals (MRPL), Chennai Petroleum Corporation, and Reliance Industries increased by up to 4% on the BSE intraday.
Is it a Multibagger ?
With a share price increase of 43.80 to 89.25 and a multibagger return of 103.77 percent year-to-date, MRPL is a multibagger stock in 2022. (YTD). In the past six months, the stock has skyrocketed from 44.15 to the current market price, representing a multibagger gain of 102.15%. From its 52-week low of 37, the stock has increased by more than 140%, and it is currently trading above its 5 days, 10 days, 12 days, 20 days, 26 days, 50 days, 100 days, and 200 days moving averages.
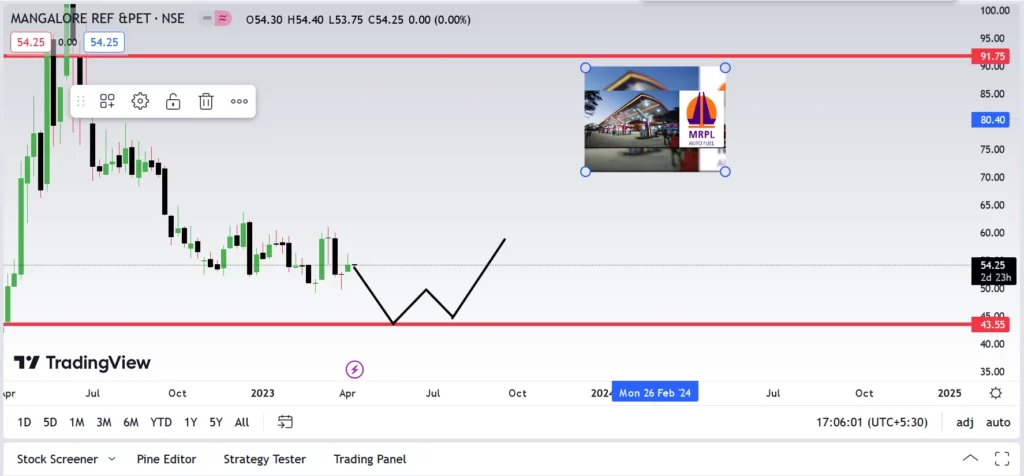
Technical View
Although MRPL is currently trading above its 50- and 100-DMAs, it is still trading below its 200-DMA, which is Rs 54.85.
The stock has surpassed the key resistance area between 55 and 56.25 levels and is currently trading above two of the three significant DMAs. The stock could challenge the 59.50 and 64 levels.”
Relative strength index (RSI) is presently in the overbought zone, according to AR Ramachandran, and higher levels should be used to liquidate previous purchase positions.
In June 2022, the stock’s 52-week high was Rs 127.60.
Let us look at the Fundamentals
Profit & Loss
Standalone Figures in Rs. Crores / View Consolidated
| Mar 2011 | Mar 2012 | Mar 2013 | Mar 2014 | Mar 2015 | Mar 2016 | Mar 2017 | Mar 2018 | Mar 2019 | Mar 2020 | Mar 2021 | Mar 2022 | TTM | |
|---|---|---|---|---|---|---|---|---|---|---|---|---|---|
| Sales + | 38,887 | 53,770 | 65,696 | 71,815 | 57,463 | 39,647 | 43,208 | 48,451 | 62,062 | 51,002 | 31,959 | 69,727 | 108,271 |
| Expenses + | 36,864 | 52,156 | 65,393 | 70,808 | 59,551 | 37,859 | 38,493 | 44,139 | 60,382 | 53,524 | 31,251 | 64,783 | 102,323 |
| Operating Profit | 2,023 | 1,615 | 303 | 1,007 | -2,088 | 1,789 | 4,714 | 4,311 | 1,681 | -2,522 | 708 | 4,944 | 5,947 |
| OPM % | 5% | 3% | 0% | 1% | -4% | 5% | 11% | 9% | 3% | -5% | 2% | 7% | 5% |
| Other Income + | 210 | 346 | 153 | 430 | 838 | 674 | 2,015 | 154 | 131 | 97 | 93 | 64 | 125 |
| Interest | 105 | 207 | 329 | 321 | 407 | 594 | 520 | 443 | 475 | 749 | 558 | 1,212 | 1,349 |
| Depreciation | 391 | 434 | 604 | 706 | 499 | 710 | 678 | 671 | 757 | 783 | 1,158 | 1,088 | 1,111 |
| Profit before tax | 1,737 | 1,320 | -477 | 410 | -2,156 | 1,158 | 5,531 | 3,351 | 581 | -3,958 | -915 | 2,708 | 3,612 |
| Tax % | 32% | 31% | -59% | -47% | 21% | 1% | 34% | 34% | 43% | 31% | 17% | -9% | |
| Net Profit | 1,177 | 909 | -757 | 601 | -1,712 | 1,147 | 3,644 | 2,224 | 332 | -2,740 | -761 | 2,955 | 3,739 |
| EPS in Rs | 6.71 | 5.18 | -4.32 | 3.43 | -9.77 | 6.54 | 20.79 | 12.69 | 1.89 | -15.64 | -4.34 | 16.86 | 21.33 |
| Dividend Payout % | 18% | 19% | 0% | 0% | 0% | 0% | 29% | 24% | 53% | 0% | 0% | 0% |
| Compounded Sales Growth | |
|---|---|
| 10 Years: | 3% |
| 5 Years: | 10% |
| 3 Years: | 4% |
| TTM: | 85% |
| Compounded Profit Growth | |
|---|---|
| 10 Years: | 13% |
| 5 Years: | 3% |
| 3 Years: | 105% |
| TTM: | 886% |
| Stock Price CAGR | |
|---|---|
| 10 Years: | 1% |
| 5 Years: | -13% |
| 3 Years: | 28% |
| 1 Year: | 8% |
| Return on Equity | |
|---|---|
| 10 Years: | 5% |
| 5 Years: | 5% |
| 3 Years: | -2% |
| Last Year: | 52% |
Balance Sheet
Standalone Figures in Rs. Crores / View ConsolidatedCORPORATE ACTIONS
| Mar 2011 | Mar 2012 | Mar 2013 | Mar 2014 | Mar 2015 | Mar 2016 | Mar 2017 | Mar 2018 | Mar 2019 | Mar 2020 | Mar 2021 | Mar 2022 | Sep 2022 | |
|---|---|---|---|---|---|---|---|---|---|---|---|---|---|
| Share Capital + | 1,762 | 1,757 | 1,753 | 1,753 | 1,753 | 1,753 | 1,753 | 1,753 | 1,753 | 1,753 | 1,753 | 1,753 | 1,753 |
| Reserves | 4,767 | 5,472 | 4,715 | 5,316 | 3,552 | 4,679 | 8,318 | 9,280 | 8,974 | 6,014 | 2,485 | 5,444 | 6,364 |
| Borrowings + | 1,126 | 6,183 | 7,558 | 9,793 | 9,032 | 8,075 | 8,541 | 7,950 | 9,131 | 11,896 | 24,062 | 21,310 | 18,437 |
| Other Liabilities + | 10,856 | 12,747 | 12,676 | 22,665 | 20,007 | 22,787 | 7,802 | 7,238 | 7,333 | 6,145 | 6,425 | 11,561 | 11,899 |
| Total Liabilities | 18,501 | 26,155 | 26,701 | 39,527 | 34,345 | 37,293 | 26,414 | 26,221 | 27,191 | 25,808 | 34,725 | 40,068 | 38,452 |
| Fixed Assets + | 3,090 | 4,052 | 5,781 | 5,991 | 14,109 | 14,881 | 14,161 | 14,038 | 13,996 | 14,239 | 19,596 | 21,384 | 20,846 |
| CWIP | 3,995 | 7,089 | 7,554 | 8,552 | 1,378 | 188 | 220 | 668 | 982 | 1,730 | 2,343 | 170 | 371 |
| Investments | 42 | 42 | 15 | 15 | 1,350 | 1,350 | 1,350 | 1,350 | 1,503 | 2,178 | 16 | 16 | 16 |
| Other Assets + | 11,374 | 14,971 | 13,351 | 24,969 | 17,508 | 20,874 | 10,684 | 10,166 | 10,710 | 7,661 | 12,770 | 18,499 | 17,218 |
| Total Assets | 18,501 | 26,155 | 26,701 | 39,527 | 34,345 | 37,293 | 26,414 | 26,221 | 27,191 | 25,808 | 34,725 | 40,068 | 38,452 |
Disclaimer : The information mentioned above is merely an opinion and should only be treated for educational purposes. If you have any questions or feedback about this article, you can write us back. To reach out, you can use our contact us page Support@learningsharks.in