Firstly, We all learned about averages in school; moving averages are simply an extension of that. Moving averages are trend indicators that are widely utilized due to their ease of use and efficiency. Before we go into moving averages, let’s go over how averages are calculated.
For example, Assume five people are relaxing on a sunny beach, sipping a cool bottled beverage. Secondly, Because the sun is so bright and pleasant, each of them consumes several bottles of the beverage. Assume the final tally is something like this:
Sl No | Person | No of Bottles |
1 | A | 7 |
2 | B | 5 |
3 | C | 6 |
4 | D | 3 |
5 | E | 8 |
Total # of bottles consumed | 29 | |
In this case, it would be:
=29/5
=5.8 bottles per head.
So, For example, the average tells us roughly how many bottles each person had consumed. Obviously, there would be few who had consumed more or less than the average. Person E, for example, consumed 8 bottles of beverage, which is much more than the average of 5.8 bottles. Similarly, person D drank only 3 bottles of beverage, which is much less than the average of 5.8 bottles. As a result, the average is only an estimate, and it cannot be expected to be correct.
Clearly, Extending the principle to equities, here are ITC Limited’s closing prices for the last 5 trading sessions. The previous 5-day average close is calculated as follows:
Date | Closing Price |
14/07/14 | 344.95 |
15/07/14 | 342.35 |
16/07/14 | 344.2 |
17/07/14 | 344.25 |
18/07/14 | 344 |
Total | 1719.75 |
= 1719.75 / 5
= 343.95
Hence the average closing price of ITC over the last 5 trading sessions is 343.95.
The moving average also called the simple moving average
Also, Consider the following scenario: you wish to calculate the average closing price of Marico Limited for the last five days. The information is as follows:
Date | Closing Price |
21/07/14 | 239.2 |
22/07/14 | 240.6 |
23/07/14 | 241.8 |
24/07/14 | 242.8 |
25/07/14 | 247.9 |
Total | 1212.3 |
= 1212.3/ 5
= 242.5
Since, the average closing price of Marico over the last 5 trading sessions is 242.5
Moving forward, we have a fresh data point on the 28th of July (the 26th and 27th being Saturday and Sunday, respectively). Moreover, This means that the ‘new’ most recent five days are the 22nd, 23rd, 24th, 25th, and 28th. We will exclude the data point from the 21st because our goal is to get the most recent 5-day average.
Date | Closing Price |
22/07/14 | 240.6 |
23/07/14 | 241.8 |
24/07/14 | 242.8 |
25/07/14 | 247.9 |
28/07/14 | 250.2 |
Total | 1223.3 |
= 1223.3/ 5
= 244.66
Hence the average closing price of Marico over the last 5 trading sessions is 244.66
As you can see, to calculate the 5-day average, we used the most recent data (28th July) and eliminated the oldest data (21st July). On the 29th, we would include the 29th data point but exclude the 22nd data, on the 30th, we would include the 30th data point but exclude the 23rd data, and so on.
Furthermore, To get the most recent 5-day average, we are effectively going to the most recent data point and deleting the oldest. As a result, the term “moving” average was coined!
Absolutely, In the preceding example, the moving average is calculated using the closing prices. Moving averages are sometimes generated using additional factors such as high, low, and open. However, closing prices are primarily used by traders and investors since they indicate the price at which the market finally settles.
Definitely, Moving averages can be computed over any time period, ranging from minutes to hours to years. Based on your needs, you can choose any time window from the charting software.
Surely, For those of you who are familiar with MS Excel, here is a screenshot of how moving averages are computed. Take note of how the cell reference changes in the average formula, removing the oldest to incorporate the most recent data points.
Cell Ref | Date | Close Price | 5 Day Average | Average Formula |
D3 | 1-Jan-14 | 1287.7 | ||
D4 | 2-Jan-14 | 1279.25 | ||
D5 | 3-Jan-14 | 1258.95 | ||
D6 | 6-Jan-14 | 1249.7 | ||
D7 | 7-Jan-14 | 1242.4 | ||
D8 | 8-Jan-14 | 1268.75 | 1263.6 | 1265.05 |
D9 | 9-Jan-14 | 1231.2 | 1259.81 | 1274 |
D10 | 10-Jan-14 | 1201.75 | 1250.2 | 1245.075 |
D11 | 13-Jan-14 | 1159.2 | 1238.76 | 1225.725 |
D12 | 14-Jan-14 | 1157.25 | 1220.66 | 1200.8 |
D13 | 15-Jan-14 | 1141.35 | 1203.63 | 1213 |
D14 | 16-Jan-14 | 1152.5 | 1178.15 | 1186.275 |
D15 | 17-Jan-14 | 1139.5 | 1162.41 | 1177.125 |
D16 | 20-Jan-14 | 1140.6 | 1149.98 | 1149.35 |
D17 | 21-Jan-14 | 1166.35 | 1146.26 | 1148.925 |
D18 | 22-Jan-14 | 1165.4 | 1148.08 | 1153.85 |
D19 | 23-Jan-14 | 1168.25 | 1152.89 | 1158.95 |
As can be seen, the moving average fluctuates in response to changes in the closing price. A moving average, as determined above, is known as a ‘Simple Moving Average’ (SMA). Because we are calculating it using the most recent 5 days of data, it is known as the 5-Day SMA.
Undoubtedly, The averages for the 5 days (or any number of 5, 10, 50, 100, or 200 days) are then linked to produce a smooth curving line known as the moving average line, which moves as time passes.
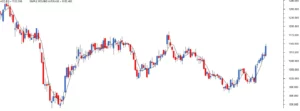
In the chart below, I’ve superimposed a 5-day SMA over an ACC candlestick graph.
So, what exactly is a moving average indicator, and how does it work? Yet, There are numerous moving average applications, and I will soon present a basic trading method based on moving averages. But first, let’s talk about the Exponential Moving Average.
The exponential moving average
Consider the data points used in this example,
Date | Closing Price |
22/07/14 | 240.6 |
23/07/14 | 241.8 |
24/07/14 | 242.8 |
25/07/14 | 247.9 |
28/07/14 | 250.2 |
Total | 1214.5 |
Despite this, When calculating the average of these statistics, an unspoken assumption is made. We are simply assigning equal weight to each data point. We assume that the data point on July 22nd is as significant as the data point on July 28th. When it comes to markets, however, this may not always be the case.
At last, Remember the fundamental premise of technical analysis: markets discount everything. This means that the most recent price you see (on July 28th) takes into account all known and unknown information. This suggests that the price on the 28th is more sacrosanct than the price on the 25th.
In addition to this, The ‘newness’ of the data should be used to allocate weightage to data points. As a result, the data point on July 28th receives the most weightage, the data point on July 25th receives the next highest weightage, the data point on July 24th receives the third highest, and so on.
By doing so, I have essentially scaled the data points according to their newness – the most recent data point receives the most attention, while the oldest data point receives the least.
Therefore, The Exponential Moving Average is calculated by taking the average of these scaled figures (EMA). Thus, I purposefully skipped the EMA calculation because most technical analysis software allows us to drag and drop the EMA on prices. As a result, we shall concentrate on EMA’s application rather than its calculation as well as.
Not only, but also Cipla Ltd’s chart is also shown below. On Cipla’s closing prices, I’ve drawn a 50-day simple moving average (black) and a 50-day exponential moving average (red). Though both the SMA and the EMA are for a 50-day period, you can see that the EMA is more responsive to price changes and stays closer to the price.
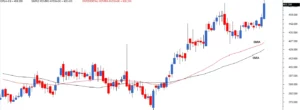
Even so, Because EMA prioritizes the most recent data points, it reacts to market price changes faster. Even though, This allows the trader to make more timely trading selections. As a result, traders prefer to employ the EMA rather than the SMA.
A simple application of moving average
With its own worth, the moving average can be utilized to discover buying and selling opportunities. When the stock price trades above its average price, it indicates that traders are willing to pay more for the stock. This indicates that traders believe the stock price will rise. As a result, one should consider purchasing opportunities.
Similarly, when the stock price trades below its average price, it indicates that traders are eager to sell the shares at a lower price. This indicates that traders are bearish on the stock price trend. As a result, one should consider selling opportunities.
Based on these findings, we can create a simple trading system. A trading system is a set of rules that assists you in identifying entry and exit locations.
Based on a 50-day exponential moving average, we will now attempt to develop one such trading system. Remember that a smart trading system will offer you a signal to start a trade as well as a signal to exit the transaction. The moving average trading system can be defined as follows:
Rule 1) When the current market price exceeds the 50-day EMA, it is time to buy (go long). When you go long, you should stay invested until the required sell condition is met.
Rule2) Exit the long position (square off) when the current market price falls below the 50-day moving average.
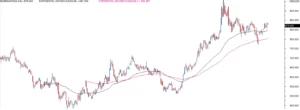
The graphic below depicts the trading system’s implementation on Ambuja cement. The price chart’s black line represents the 50-day exponential moving average.
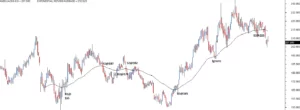
Starting from the left, the first buying opportunity arose at 165, which was indicated on the charts as B1@165. At point B1, the stock price moved above its 50-day moving average. As a result, we begin a new long position in accordance with the trading system regulation.
The trading algorithm keeps us invested until we receive an exit signal, which we eventually received at 187, denoted as S1@187. This transaction resulted in a profit of Rs.22 per share.
The following long signal arrived at B2@178, followed by a square-off signal at S2@182. This deal was less noteworthy because it only yielded a profit of Rs.4. The last trade, however, B3@165 and S3@215 were pretty spectacular, resulting in a profit of Rs.50.
Based on how the trading system performed, here is a concise summary of these trades:
Sl No | Buy Price | Sell Price | Gain/Loss | % Return |
1 | 165 | 187 | 22 | 13% |
2 | 178 | 182 | 4 | 2.20% |
3 | 165 | 215 | 50 | 30% |
The preceding table clearly shows that the first and last trades were lucrative, but the second trade was not. If you look at why this happened, you can see that the stock was trending throughout the first and third trades, but it moved sideways on the second trade.
This leads to an important conclusion concerning moving averages. Moving averages perform admirably when there is a trend but poorly when the stock swings sideways. In its most basic form, the ‘Moving average’ is a trend-following method.
I’ve noticed a few key traits from my own personal experience trading with moving averages:
1. During a sideways market, moving averages provide numerous trading indications (buy and sell). The majority of these signals produce modest profits, if not losses.
2. However, one of those several deals usually results in a major rally (such as the B3@165 trade), resulting in substantial gains.
3. It would be difficult to separate the large winner from the many minor trades.
4. As a result, the trader should not be picky about the indications the moving average algorithm suggests. In fact, the trader should engage in all of the deals recommended by the algorithm.
5. Remember that losses are minimized in a moving average strategy, but one big transaction might compensate for all losses and provide you with significant profits.
6. Profitable trading ensures that you remain in the trend for the duration of the trend. Sometimes it can take several months. As a result, MA can be utilized as a proxy for identifying long-term investment opportunities.
7. The key to the MA trading system is to take all trades and not be critical of the signals given by the system.
Here’s another BPCL example: the MA system proposed many trades during the sideways market, but none of them were successful. However, the most recent trade resulted in a 67 percent profit in approximately 5 months.
Moving average crossover system
The problem with the basic vanilla moving average approach, as it is clearly clear, is that it provides much too many trading signals in a sideways market. A moving average crossover system is an improvement on the standard moving average method. In a sideways market, it allows the trader to take fewer deals.
In an MA crossover system, instead of a single moving average, the trader mixes two moving averages. This is commonly referred to as smooth.’
Combining a 50-day EMA with a 100-day EMA is a common example of this. The shorter moving average (in this case, 50 days) is also known as the faster-moving average. The slower moving average is the longer moving average (100 days moving average).
Because the shorter moving average uses fewer data points to create the average, it tends to stick closer to the current market price and hence reacts more swiftly. Because a longer moving average requires more data points to calculate the average, it tends to deviate from the current market price. As a result, reflexes are slower.
As can be seen, the black 50-day EMA line is closer to the current market price (since it reacts faster) than the pink 100-day EMA line (as it reacts slower).
Traders have combined the crossover strategy with the simple vanilla MA system to smooth out the entry and exit locations. The trader receives significantly fewer indications as a result of the process, but the likelihood of the transaction being lucrative is relatively high.
The crossover system’s entry and exit rules are as follows:
Rule 1) When the short-term moving averages exceed the long-term moving average, it is time to buy (new long). Stay in the business as long as this criterion is met.
Rule 2) When the short-term moving average falls below the longer-term moving average, exit the long position (square off).
Let’s use the MA crossover mechanism on the same BPCL example we looked at before. I have replicated the BPCL chart with a single 50-day MA for ease of comparison.
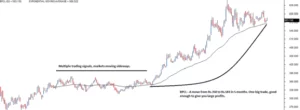
When the markets were trending sideways, MA offered at least three trade signals. However, the fourth trade was a triumph, resulting in a 67 percent profit.
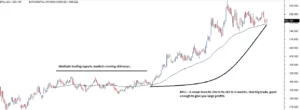
The figure below depicts the use of an MA crossover system with 50 and 100-day EMA.
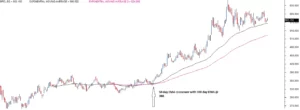
The pink line represents the 100-day moving average, while the black line represents the 50-day moving average. The signal to go long is generated when the 50-day moving average (short term MA) crosses over the 100-day moving average, according to the cross overrule (long term MA). An arrow has been drawn to indicate the crossover point. Please take note of how the crossover strategy keeps the trader out of the three unprofitable transactions. This is the most significant advantage of a cross-over system.
A trader can design an MA cross-over strategy using any combination. Some popular combinations for a swing trader include:
1. Use the 9-day EMA in conjunction with the 21-day EMA for short-term trades ( upto few trading session)
2. Use the 25-day EMA in conjunction with the 50-day EMA to identify medium-term trades (up to few weeks)
3. Use the 50-day EMA in conjunction with the 100-day EMA to discover trades that can last for several months.
4. Use the 100-day EMA in conjunction with the 200-day EMA to find long-term trades (investment opportunities), some of which can run for a year or more.
Remember that the larger the time range, the fewer the trade indications.
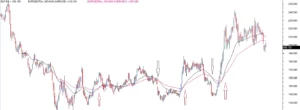
Here’s an illustration of a 25 x 50 EMA crossover. The crossover rule applies to three trading signals.
The MA crossover strategy, of course, can also be used for intraday trading. For example, the 15 x 30 minutes crossover might be used to detect intraday possibilities. A 5 x 10-minute crossover could be used by a more aggressive trader.
You may have heard the common market adage, “The trend is your friend.” Moving averages might help you identify this friend.
Remember that moving averages are a trend-following system; as long as there is a trend, they function magnificently. It makes no difference which time frame or cross-over combo you use.
Conclusion
1. A standard average calculation is a rapid approximation of a number series.
2. A Moving Average is a type of average computation that uses the most recent data and excludes the oldest.
3. All data points in the series are given equal weightage by the simple moving average (SMA).
4. An exponential moving average (EMA) scales data based on its freshness. The most recent data is given the most weight, while the oldest is given the least weight.
5. Use an EMA instead of an SMA for all practical applications. This is due to the EMA’s preference for the most current data points.
6. When the current market price exceeds the EMA, the outlook is optimistic. When the current market price falls below the EMA, the outlook becomes bearish.
7. Moving averages can cause whipsaws in a non-trending market, resulting in repeated losses. To address this, an EMA crossover mechanism is used.
8. A typical crossover system overlays the price chart with two EMAs. The shorter the EMA, the faster the reaction, while the longer the EMA, the slower the reaction.
9. When the faster EMA crosses and is above the slower EMA, the outlook becomes bullish. As a result, one should consider purchasing the stock. The trade lasts until the quicker EMA begins to fall below the slower EMA.
10. The lower the trade signals, the longer the time frame for a crossover system.