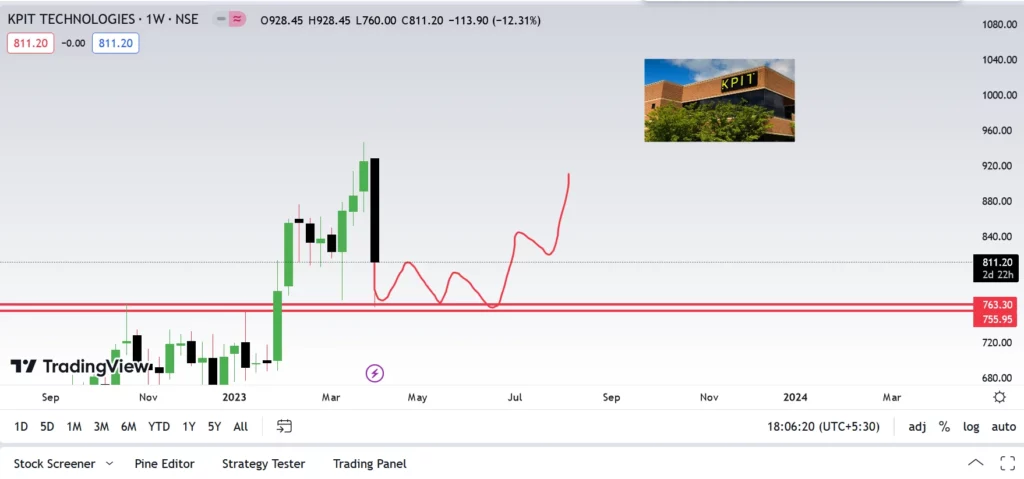
Shares of KPIT Technologies tumbled over 17% to Rs 760 in Monday’s trade on BSE after the global brokerage firm JPMorgan initiated coverage on the stock with an underweight rating and a target price of Rs 520, a potential downside of 44% from Friday’s closing price of Rs 925.
JPMorgan’s target for the stock is driven by lower structural margins, risks from single vertical and high client concentration, and excessive valuations, according to media reports.The average price estimate for the stock, according to Trendlyne data, is Rs 786, down 15% from Friday’s closing price of Rs 925. KPIT Technologies’s average rating from 11 analysts is a hold. Of these experts, three have strong sell and sell ratings, three have strong buy and buy ratings, and one has a hold rating. Seven analysts have strong buy and buy ratings. At 2.49 a.m., the stock was trading 14.4% lower than its previous day’s ending price of 925 rupees per share, at Rs. 792. On the other hand..
Let us look at the Fundamentals
Profit & Loss
Consolidated Figures in Rs. Crores / View StandaloneGEOGRAPHICAL SEGMENTS
Mar 2018
Mar 2019
Mar 2020
Mar 2021
Mar 2022
TTM
Sales +
0
641
2,156
2,036
2,432
2,999
Expenses +
0
550
1,866
1,729
1,994
2,440
Operating Profit
-0
92
290
307
439
560
OPM %
14%
13%
15%
18%
19%
Other Income +
0
1
19
21
45
62
Interest
0
7
20
17
19
29
Depreciation
0
19
108
133
120
135
Profit before tax
-0
67
181
178
345
458
Tax %
0%
18%
18%
17%
20%
Net Profit
-0
55
148
147
276
356
EPS in Rs
-27.00
1.98
5.38
5.33
10.00
12.72
Dividend Payout %
0%
37%
18%
28%
31%
Compounded Sales Growth
10 Years:
%
5 Years:
%
3 Years:
56%
TTM:
29%
Compounded Profit Growth
10 Years:
%
5 Years:
%
3 Years:
50%
TTM:
41%
Stock Price CAGR
10 Years:
%
5 Years:
%
3 Years:
178%
1 Year:
33%
Return on Equity
10 Years:
%
5 Years:
%
3 Years:
17%
Last Year:
21%
Balance Sheet
Consolidated Figures in Rs. Crores / View StandaloneCORPORATE ACTIONS