When you look at a stock chart on a trader’s trading terminal, you will most certainly see lines flowing all over the screen. These are known as ‘Technical Indicators.’ A technical indicator assists a trader in analyzing a security’s price movement.
Indicators are self-contained trading methods that have been brought to the globe by experienced traders. Indicators are pre-programmed logic that traders can use to supplement their technical analysis (candlesticks, volumes, S&R) to make a trading choice. Indicators aid in the buying, selling, confirming, and sometimes anticipating of trends.
Indicators are classified into two types: leading and lagging. A leading indicator precedes the price, indicating that it predicts the occurrence of a reversal or a new trend. While this seems intriguing, keep in mind that not all leading indicators are reliable. Leading indicators are renowned for sending out incorrect indications. As a result, the trader should exercise extreme caution when employing leading indicators. Indeed, the effectiveness of using leading indicators grows with trading expertise.
The bulk of leading indicators is referred to as oscillators since they oscillate within a defined range. An oscillator often oscillates between two extreme numbers, such as 0 and 100. The trading meaning differs depending on the oscillator reading (for example, 55, 70, etc.).
A lagging indicator, on the other hand, lags behind the price, indicating the occurrence of a reversal or a new trend after it has occurred. What is the point of receiving a signal after the event has occurred? It’s better late than never, right? Moving averages are one of the most widely used lagging indicators.
If the moving average is an indicator in and of itself, you may be wondering why we discussed it before we studied the indicators properly. The reason for this is that moving averages are a fundamental notion in and of themselves. It is used in a variety of indicators, including the RSI, MACD, and Stochastic. As a result, we covered moving averages as a separate topic.
Before delving deeper into various indicators, I believe it is necessary to first define momentum. The rate at which the price moves is referred to as momentum. For example, if the stock price is Rs.100 today and increases to Rs.105 the following day and Rs.115 the next day, we may say the momentum is strong because the stock price has changed by 15% in just three days. However, if the same 15% shift occurred over, say, three months, we can conclude that momentum is modest. As a result, the stronger the momentum, the faster the price changes.
Relative Strength Index
The Relative Strength Index (RSI) is a popular indicator established by J.Welles Wilder. The RSI is a leading momentum indicator that can assist spot a trend reversal. The RSI indicator oscillates between 0 and 100, and market expectations are set based on the most recent indicator reading.
The phrase “Relative Strength Index” can be deceptive because it does not measure the relative strength of two securities, but rather shows the security’s internal strength. The most common leading indicator is the RSI, which provides the greatest indications during sideways and non-trending areas.
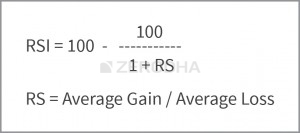
The RSI is calculated using the following formula:
Let us examine this indicator using the following example:
With this in mind, assume the stock is trading at 99 on day 0 and evaluate the following data points:
| Sl No | Closing Price | Points Gain | Points Lost |
| 1 | 100 | 1 | 0 |
| 2 | 102 | 2 | 0 |
| 3 | 105 | 3 | 0 |
| 4 | 107 | 2 | 0 |
| 5 | 103 | 0 | 4 |
| 6 | 100 | 0 | 3 |
| 7 | 99 | 0 | 1 |
| 8 | 97 | 0 | 2 |
| 9 | 100 | 3 | 0 |
| 10 | 105 | 5 | 0 |
| 11 | 107 | 2 | 0 |
| 12 | 110 | 3 | 0 |
| 13 | 114 | 4 | 0 |
| 14 | 118 | 4 | 0 |
| Total | 29 | 10 | |
The term points gained/lost in the preceding table refers to the number of points gained/lost since the previous day’s closure. For example, if the close today is 104 and the close yesterday was 100, the points gained are 4 and the points lost are 0. Similarly, if the close today was 104 and the close the prior day was 107, the points gained would be 0, and the points lost would be 3. Please keep in mind that the losses are calculated as positive numbers.
For the computation, we used 14 data points, which is the default period setting in the charting software. This is also known as the ‘look-back time.’ If you’re looking at hourly charts, the default period is 14 hours, and if you’re looking at daily charts, the default term is 14 days.
The first step is to calculate ‘RS,’ commonly known as the RSI factor. As seen in the calculation, RS is the ratio of average points gained to average points lost.
Average Points Gained = 29/14
= 2.07
Average Points Lost = 10/14
= 0.714
RS = 2.07/0.714
= 2.8991
Plugging in the value of RS in the RSI formula,
= 100 – [100/ (1+2.8991)]
= 100 – [100/3.8991]
= 100 – 25.6469
RSI = 74.3531
As you can see, calculating the RSI is pretty straightforward. The purpose of using RSI is to help traders discover oversold and overbought price zones. Overbought means that the stock’s positive momentum is so strong that it may not last long, implying that a correction is possible. Similarly, an oversold position indicates that the negative momentum is high, signaling that a reversal is imminent.
Take a peek at Cipla Ltd’s graph; you’ll notice some interesting developments:
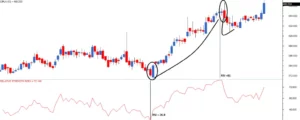
To begin, the red line beneath the price chart represents the 14-period RSI. If you look at the RSI scale, you’ll note that it has an upper bound of 100 and a lower bound of 0. However, the numbers 100 and 0 are not visible in the graph.
When the RSI reading falls between 30 and 0, the security is oversold and due for an upward correction. When the security reading is between 70 and 100, it is assumed that the security has been heavily purchased and is due for a downward correction.
The first vertical line from the left indicates a level where the RSI is less than 30; in fact, the RSI is 26.8. As a result, the RSI indicates that the stock is oversold. In this case, the RSI value of 268 also corresponds to a bullish engulfing pattern. This provides the trader with two confirmations to go long! Needless to say, both volumes and S&R should follow suit.
The second vertical line indicates a level where the RSI reaches 81, which is considered overbought. As a result, if not seeking shorting possibilities, the trader should use caution in his decision to purchase the stock. Again, watch how the candles form a bearish engulfing pattern. A bearish engulfing pattern with an RSI of 81 indicates that the stock should be sold short. This is followed by a swift and brief stock correction.
The candlestick pattern and RSI exactly coincide to confirm the occurrence of the same event, as demonstrated above. This is not always the case. This leads us to another intriguing interpretation of RSI. Consider the following two possibilities:
Scenario 1) Because the RSI is upper bound at 100, stock in a prolonged uptrend (remember, uptrends can run from a few days to a few years) will remain locked in the overbought region for a long time. It cannot exceed 100. The trader will invariably be seeking shorting chances, but the stock will be in a different orbit. Eicher Motors Limited, for example, has earned a year-on-year return of about 100 percent.
Scenario 2) The RSI will be locked in the oversold region of a stock that is in a persistent slump since it is lower bound to 0. It cannot exceed 0. The trader will be seeking buying chances in this situation, but the stock will be falling. Suzlon Energy, for example, has achieved a negative 34 percent year-on-year return.
As a result, we can interpret RSI in a variety of ways other than the traditional one (which we discussed earlier)
If the RSI remains in an overbought region for an extended length of time, look for purchasing opportunities rather than short ones. Because of the extra positive momentum, the RSI remains in the overbought range for an extended length of time.
If the RSI remains in an oversold zone for an extended length of time, look for selling opportunities rather than buying. Because of an overabundance of negative momentum, the RSI remains in the oversold region for an extended period.
Look for purchasing opportunities if the RSI value begins to move away from the oversold level after a protracted period. For example, if the RSI rises over 30 after a long period, it may indicate that the stock has bottomed out, implying that it is time to go long.
Look for selling opportunities if the RSI value begins to move away from the overbought value after a protracted period. For example, the RSI fell below 70 for the first time in a long time. This indicates that the stock may have peaked, making shorting a viable option.
One Last Note
None of the measures used to analyze RSI should be rigidly applied. J.Welles Wilder, for example, used a 14-day lookback time simply because it produced the greatest results given the market conditions in 1978. (which is when RSI was introduced to the world). If you like, you can set a look-back time of 5, 10, 20, or even 100 days. This is how you establish your trading edge. You must examine what works for you and replicate it. Please keep in mind that the fewer days you utilize to compute the RSI, the more volatile the indicator.
J.Welles Wilder also opted to use a scale of 0-30 to identify oversold regions and a scale of 70-100 to indicate overbought regions. Again, this is not a hard and fast rule; you can come up with your combination.
I like to use the 0-20 level and the 80-100 level to determine oversold and overbought sectors. I combine this with the traditional 14-day look-back period.
Of course, I encourage you to investigate the parameters that work best for you. Indeed, this is how you will eventually become a successful trader.
Finally, keep in mind that RSI is not commonly utilized as a solo indicator by traders; it is used in conjunction with other candlestick patterns and indicators to examine the market.
Moving Average Convergence and Divergence (MACD)
Gerald Appel created the Moving Average Convergence and Divergence (MACD) indicator in the late 1970s. Traders see MACD as the granddaddy of indicators. Despite being established in the 1970s, MACD is still regarded as one of the most reliable momentum trading indicators.
MACD, as the name implies, is concerned with the convergence and divergence of two moving averages. Convergence happens when the two moving averages move in the same direction, while divergence occurs when the moving averages move in opposite directions.
A conventional MACD is calculated using a 12-day and a 26-day exponential moving average. Please keep in mind that both EMAs are based on closing prices. To get the convergence and divergence (CD) value, subtract the 26 EMA from the 12-day EMA. The ‘MACD Line’ is a simple line graph that depicts this. Let’s start with the math and then move on to the applications of MACD.
| Date | Close | 12 Day EMA | 26 Day EMA | MACD Line |
|---|---|---|---|---|
| 1-Jan-14 | 6302 | |||
| 2-Jan-14 | 6221 | |||
| 3-Jan-14 | 6211 | |||
| 6-Jan-14 | 6191 | |||
| 7-Jan-14 | 6162 | |||
| 8-Jan-14 | 6175 | |||
| 9-Jan-14 | 6168 | |||
| 10-Jan-14 | 6171 | |||
| 13-Jan-14 | 6273 | |||
| 14-Jan-14 | 6242 | |||
| 15-Jan-14 | 6321 | |||
| 16-Jan-14 | 6319 | |||
| 17-Jan-14 | 6262 | 6230 | ||
| 20-Jan-14 | 6304 | 6226 | ||
| 21-Jan-14 | 6314 | 6233 | ||
| 22-Jan-14 | 6339 | 6242 | ||
| 23-Jan-14 | 6346 | 6254 | ||
| 24-Jan-14 | 6267 | 6269 | ||
| 27-Jan-14 | 6136 | 6277 | ||
| 28-Jan-14 | 6126 | 6274 | ||
| 29-Jan-14 | 6120 | 6271 | ||
| 30-Jan-14 | 6074 | 6258 | ||
| 31-Jan-14 | 6090 | 6244 | ||
| 3-Feb-14 | 6002 | 6225 | ||
| 4-Feb-14 | 6001 | 6198 | ||
| 5-Feb-14 | 6022 | 6176 | ||
| 6-Feb-14 | 6036 | 6153 | 6198 | -45 |
| 7-Feb-14 | 6063 | 6130 | 6188 | -58 |
| 10-Feb-14 | 6053 | 6107 | 6182 | -75 |
| 11-Feb-14 | 6063 | 6083 | 6176 | -94 |
| 12-Feb-14 | 6084 | 6066 | 6171 | -106 |
| 13-Feb-14 | 6001 | 6061 | 6168 | -107 |
Let us go through the table starting from the left:
We have the dates, starting from 1st Jan 2014
Next to the dates, we have the closing price of Nifty
We leave the first 12 data points (closing price of Nifty) to calculate the 12-day EMA
We then leave the first 26 data points to calculate the 26-day EMA
Once we have both 12 and 26-day EMA running parallel to each other (6th Feb 2014) we calculate the MACD value
MACD value = [12 day EMA – 26 day EMA]. For example, on 6th Feb 2014, 12-day EMA was 6153, and 26-day EMA was 6198. Hence the MACD would be 6153-6198 = – 45
The MACD line, which oscillates above and below the middle line, is obtained by calculating the MACD value over 12 and 26-day EMAs and plotting it as a line graph.
| Date | Close | 12 Day EMA | 26 Day EMA | MACD Line |
|---|---|---|---|---|
| 1-Jan-14 | 6302 | |||
| 2-Jan-14 | 6221 | |||
| 3-Jan-14 | 6211 | |||
| 6-Jan-14 | 6191 | |||
| 7-Jan-14 | 6162 | |||
| 8-Jan-14 | 6175 | |||
| 9-Jan-14 | 6168 | |||
| 10-Jan-14 | 6171 | |||
| 13-Jan-14 | 6273 | |||
| 14-Jan-14 | 6242 | |||
| 15-Jan-14 | 6321 | |||
| 16-Jan-14 | 6319 | |||
| 17-Jan-14 | 6262 | 6230 | ||
| 20-Jan-14 | 6304 | 6226 | ||
| 21-Jan-14 | 6314 | 6233 | ||
| 22-Jan-14 | 6339 | 6242 | ||
| 23-Jan-14 | 6346 | 6254 | ||
| 24-Jan-14 | 6267 | 6269 | ||
| 27-Jan-14 | 6136 | 6277 | ||
| 28-Jan-14 | 6126 | 6274 | ||
| 29-Jan-14 | 6120 | 6271 | ||
| 30-Jan-14 | 6074 | 6258 | ||
| 31-Jan-14 | 6090 | 6244 | ||
| 3-Feb-14 | 6002 | 6225 | ||
| 4-Feb-14 | 6001 | 6198 | ||
| 5-Feb-14 | 6022 | 6176 | ||
| 6-Feb-14 | 6036 | 6153 | 6198 | -45 |
| 7-Feb-14 | 6063 | 6130 | 6188 | -58 |
| 10-Feb-14 | 6053 | 6107 | 6182 | -75 |
| 11-Feb-14 | 6063 | 6083 | 6176 | -94 |
| 12-Feb-14 | 6084 | 6066 | 6171 | -106 |
| 13-Feb-14 | 6001 | 6061 | 6168 | -107 |
| 14-Feb-14 | 6048 | 6051 | 6161 | -111 |
| 17-Feb-14 | 6073 | 6045 | 6157 | -112 |
| 18-Feb-14 | 6127 | 6045 | 6153 | -108 |
| 19-Feb-14 | 6153 | 6048 | 6147 | -100 |
| 20-Feb-14 | 6091 | 6060 | 6144 | -84 |
| 21-Feb-14 | 6155 | 6068 | 6135 | -67 |
| 24-Feb-14 | 6186 | 6079 | 6129 | -50 |
| 25-Feb-14 | 6200 | 6092 | 6126 | -34 |
| 26-Feb-14 | 6239 | 6103 | 6122 | -19 |
| 28-Feb-14 | 6277 | 6118 | 6119 | -1 |
| 3-Mar-14 | 6221 | 6136 | 6117 | 20 |
| 4-Mar-14 | 6298 | 6148 | 6112 | 36 |
| 5-Mar-14 | 6329 | 6172 | 6113 | 59 |
| 6-Mar-14 | 6401 | 6196 | 6121 | 75 |
| 7-Mar-14 | 6527 | 6223 | 6131 | 92 |
| 10-Mar-14 | 6537 | 6256 | 6147 | 110 |
| 11-Mar-14 | 6512 | 6288 | 6165 | 124 |
| 12-Mar-14 | 6517 | 6324 | 6181 | 143 |
| 13-Mar-14 | 6493 | 6354 | 6201 | 153 |
| 14-Mar-14 | 6504 | 6380 | 6220 | 160 |
Given the MACD value, let’s try and find the answer to a few obvious questions:
What does a negative MACD value indicate?
What does a positive MACD value indicate?
What does the magnitude of the MACD value mean? As in, what information does a -90 MACD convey versus a – 30 MACD?
The MACD indication simply indicates the direction of the stock’s movement. If the 12 Day EMA is 6380 and the 26 Day EMA is 6220, the MACD value is +160. In what situations do you believe the 12-day EMA will be bigger than the 26-day EMA? We investigated this in the moving average chapter. Only when the stock price is rising will the shorter-term average be greater than the long-term average. Remember that the shorter-term average is usually more sensitive to current market prices than the long-term average.
A good indicator indicates that the stock has positive momentum and is trending upward. The magnitude increases with increasing momentum. For example, +160 indicates a stronger positive trend than +120.
However, when dealing with magnitude, keep in mind that the stock price affects the magnitude. For example, the magnitude of the MACD will automatically increase if the underlying price, such as Bank Nifty, rises.
When the MACD is negative, this indicates that the 12-day EMA is lower than the 26-day EMA. As a result, the momentum is negative. The greater the magnitude of the MACD, the stronger the downward trend.
The MACD spread is the difference between the two moving averages. When momentum slows, the spread narrows; when momentum picks up, the spread widens. Traders typically plot the MACD value chart, also known as the MACD line, to visualize convergence and divergence.
The MACD line chart of the Nifty for data points ranging from January 1st, 2014 to August 18th, 2014 is shown below.
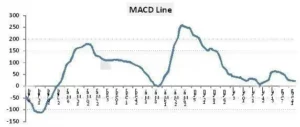
The MACD line, as seen, oscillates over a central zero line. This is also known as the ‘Centerline.’ The MACD indicator can be interpreted as follows:
When the MACD Line crosses the centerline from the negative to the positive zone, it indicates that the two averages are diverging. This is an indication of developing bullish momentum, so watch for purchasing chances. We can see this happening around the 27th of February based on the graphic above.
When the MACD line crosses the centerline from the positive to the negative area, it indicates a convergence of the two averages. This is an indication of developing bearish momentum, therefore watch for selling chances. As you can see, there were two occasions when the MACD nearly turned negative (8th May and 24th July), but it just halted at the zero lines and reversed ways.
Traders typically believe that while waiting for the MACD line to cross the centerline, the majority of the movie would have already been completed and it would be too late to enter a trade. To overcome this, an improvisation is performed over the basic MACD line. The 9-day signal line is an additional MACD component that has been added as an improvisation. The MACD line’s 9-day signal line is an exponential moving average (EMA). If you consider it, we now have two lines:
A MACD line
A 9-day EMA of the MACD line is also called the signal line.
A trader can no longer wait for the centerline to cross over by employing a basic two-line crossover method, as explained in the moving averages chapter.
When the MACD line crosses the 9-day EMA and the MACD line is greater than the 9-day EMA, the emotion is positive. When this occurs, the trader should hunt for purchasing opportunities.
When the MACD line crosses below the 9-day EMA and the MACD line is less than the 9-day EMA, the emotion is bearish. When this occurs, the trader should hunt for opportunities to sell.
The MACD indicator is plotted on Asian Paints Limited in the chart below. The MACD indicator is visible underneath the price chart.
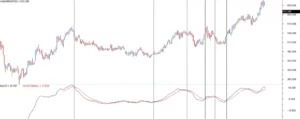
The indicator uses standard parameters of MACD:
12-day EMA of closing prices
26-day EMA of closing prices
MACD line (12D EMA – 26D EMA) represented by the black line
9-day EMA of the MACD line represented by the red line
The chart’s vertical lines highlight the crossing locations where a buy or sell signal originated.
For example, the first vertical line from left to right indicates a crossover in which the MACD line is below the signal line (9-day EMA) and suggests a short trade.
The second vertical line from the left indicates a crossover when the MACD line is above the signal line, indicating a purchasing opportunity. So forth and so on.
Please keep in mind that moving averages are at the heart of the MACD system. As a result, the MACD indicator has qualities comparable to those of a moving average system. They function effectively when there is a strong trend but are less useful when the market is drifting sideways. This is visible between the first two lines, starting from the left.
Needless to add, the MACD parameters are subject to change. The 12 and 26-day EMAs can be changed to whatever time range is preferred. I like to use the MACD in its original form, as pioneered by Gerald Appel.
The Bollinger Bands
Bollinger Bands (BB), introduced by John Bollinger in the 1980s, is one of the most useful technical analysis indicators. The Bollinger Band (BB) is used to assess overbought and oversold levels, with a trader attempting to sell when the price reaches the top of the band and executing a purchase when the price reaches the bottom of the band.
The BB has 3 components:
The middle line which is The 20 day simple moving average of the closing prices
An upper band – this is the +2 standard deviation of the middle line
A lower band – this is the -2 standard deviation of the middle line
The standard deviation (SD) is a statistical concept that estimates the volatility of a value from its average. In finance, the standard deviation of the stock price shows a stock’s volatility. For example, if the standard deviation is 12%, it is equivalent to stating that the stock’s volatility is 12%.
The standard deviation is added to the 20-day SMA in BB. The upper band represents the +2 SD. We multiply the SD by 2 and add it to the average using a +2 SD.
For example if the 20 day SMA is 7800, and the SD is 75 (or 0.96%), then the +2 SD would be 7800 + (75*2) = 7950. Likewise, a -2 SD indicates we multiply the SD by 2 and subtract it from the average. 7800 – (2*75) = 7650.
We now have the components of the BB:
20 day SMA = 7800
Upper band = 7950
Lower band = 7650
According to statistics, the current market price should be around the 7800 level. If the current market price is around 7950, it is deemed pricey in comparison to the average. As a result, shorting opportunities should be approached with the belief that the price will return to its typical level.
As a result, the trade would be to sell at 7950 and aim at 7800.
Similarly, if the current market price is approximately 7650, it is deemed low in comparison to average pricing. As a result, one should investigate buying opportunities to anticipate that prices will return to their average level.
As a result, the trade would be to purchase at 7650 and target 7800.
The upper and lower bands serve as a signal to begin a trade.
The following is the chart of BPCL Limited,
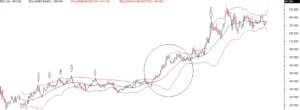
The central black line is the 20-day SMA. The two red lines above and below the black line represent the +2 SD and -2SD. The aim is to short the stock when it reaches the top band, anticipating it to revert to average. Similarly, one can go long when the price reaches the bottom band, anticipating it to revert to the average.
I’ve highlighted with a down arrow all of the sell signals generated by BB. While most of the signals functioned effectively, there was a period when the price remained trapped in the upper band. The price continued to rise, and therefore the upper band widened. This is known as envelope expansion.
The upper and bottom bands of the BB create an envelope. When the price moves in a specific direction, the envelope expands, suggesting significant momentum. When there is an envelope expansion, the BB signal fails. This leads to a significant conclusion: BB works well in sideways markets but fails in trending ones.
I expect the trade to start working in my favor virtually quickly when I employ BB. If it does not, I start validating the probability of an envelope extension.
Other Indicators
There are a plethora of other technical signs, and the list is seemingly limitless. The question is, do you need to be familiar with all of these indicators to be a good trader? The basic answer is no. Technical indicators are useful to know, but they should not be your primary tool for analysis.
I’ve met many wannabe traders who invest a lot of time and energy learning different indicators, but it’s all for naught in the end. It is sufficient to have a working knowledge of a few basic indicators, such as those taught in this lesson.
The Checklist
In the previous chapters, we began to construct a checklist that would serve as a guiding force in the trader’s decision to buy or sell. It’s time to go over that checklist again.
The indicators serve as a tool for traders to confirm their trading decisions, and it is important to evaluate what the indications are communicating before placing a buy or sell order. While the reliance on indicators is not as strong as it is on S&R, volumes, or candlestick patterns, it is always useful to understand what the basic indicators say. As a result, I would suggest including signs in the checklist, but with a twist. I’ll explain the twist later, but first, let’s go over the new checklist.
The stock should form a recognizable candlestick pattern
S&R should confirm the trade. The stop loss price should be around S&R
For a long trade, the low of the pattern should be around the support
For a short trade, the high of the pattern should be around the resistance
Volumes should confirm
Ensure above average volumes on both buy and sell day
Low volumes are not encouraging, hence do feel free to hesitate while taking trade where the volumes are low
Indicators should confirm
Scale the size higher if the confirm
If they don’t confirm, go ahead with the original plan
The sub-bullet points under indicators are where the twist lies.
Consider a hypothetical case in which you are considering purchasing shares of Karnataka Bank Limited. If Karnataka Bank forms a bullish hammer on a specific day, assuming the following conditions are met:
The bullish hammer is a recognizable candlestick pattern
The low of the bullish hammer also coincides with the support
The volumes are above average
There is also a MACD crossover (signal line turns greater than the MACD line)
I’d be pleased to buy Karnataka Bank if all four of the checklist items were checked off. As a result, I place a buy order, say for 500 shares.
Consider a scenario in which the first three checklist conditions are met but the fourth (indicators should confirm) is not. What do you suggest I do?
I’d still buy, but instead of 500 shares, I’d probably get 300.
This should ideally reflect how I like to utilize (and advocate for) indicators.
When the indicators confirm, I increase my bet amount; when the indicators do not confirm, I continue to buy but reduce my bet size.
However, I would not do this with the first three items on the checklist. For example, if the low of the bullish hammer does not coincide with and around the support, I will seriously ponder buying the stock; in fact, I may forego the opportunity entirely and hunt for another.
But I don’t have the same faith in the indications. It’s always useful to understand what indications mean, but I don’t base my decisions on them. If the indicators confirm, I increase the bet size; if they don’t, I stick to my original strategy.
Conclusion
A MACD is a trend-following indicator.
MACD is made up of a 12-day and a 26-day EMA.
The MACD line measures 12d EMA – 26d EMA.
The signal line is the MACD line’s 9-day SMA.
Between the MACD Line and the signal line, a crossover method can be used.
The volatility is captured by the Bollinger band. It has a 20-day average, a +2 standard deviation, and a -2 standard deviation.
When the current price is at +2SD, one can short with the hope that the price will revert to the average.
When the current price is at -2SD, one might go along with the hope that the price will revert to the average.
In a sideways market, BB performs well. In a trending market, the BB’s envelope increases and produces a large number of false signals.
Indicators are useful to know, but they should not be used as the sole basis of decision-making.