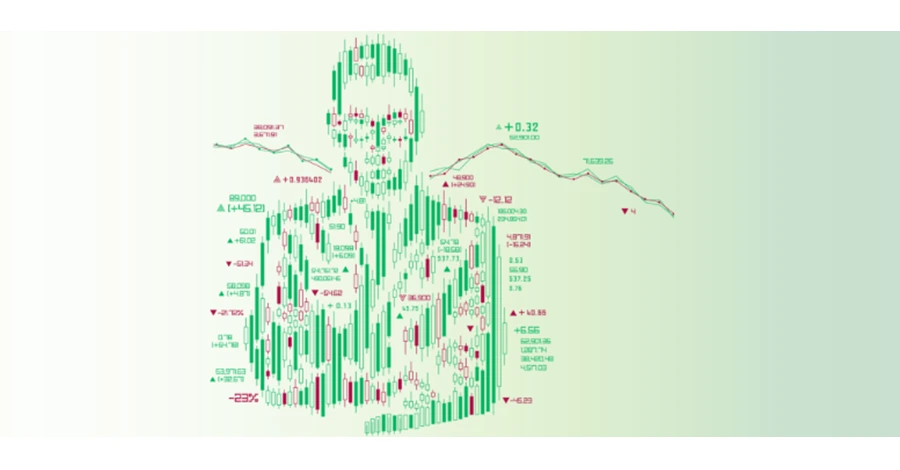
Charts provide both a price history and volume history for a financial asset, but they also offer fascinating insights into how people behave. And if you learn to read them correctly, you may use them as a psychological map since they mirror fundamental human nature.
As technical analysts, we are aware that stocks, indexes, and futures markets frequently exhibit repeating patterns. Despite the fact that no two patterns are exactly alike, recognised characteristics reproduce themselves frequently enough for us to recognise and label these patterns and use them to forecast price movement. Understanding the underlying human behaviour and trading it accordingly is a key component of pattern recognition since these patterns reflect people’s thoughts and feelings.
Numerous indexes and stocks are forming—or have already formed—the head-and-shoulders reversal pattern on their daily charts. A head-and-shoulders pattern can be seen on a chart whenever a stock, for example, increases in price to a new high (on any time frame). High volume lifts the price movement to the apex, forming the top of the left shoulder.
The pullback happens next. Mass psychology is reflected in the downturn, which is when latecomers to the soaring uptrend enter the fray. They move in as soon as the retreat reverses, driving the price to yet another record high. But eventually, the worn-out tardy buyers cease “paying up” for the overbought stock. Fear sets in as they suddenly realise they are poised precariously on a mountainside that is eroding (head). When short sellers start to attack, panicked bulls flee at the mercy of the market. The stock drops to the previous support region created by the left shoulder’s completion. The head is now fully developed.
At the neckline (of the finished pattern), a select few eager purchasers drive the price up once again.
However, this time, the tepid optimism only raises the price as high as the top of the left shoulder. The top of the right shoulder is formed as volume decreases and the price rolls over.
Drooling and sharpening their claws, short sellers. The head-and-shoulders pattern is complete when the price retraced to contact the neckline. Some short sellers have already made an early (high-risk) entry while anticipating the upcoming fall below the neckline. The day after the head-and-shoulders pattern is complete, the stock may frequently gap down (on a daily chart) as anxious investors and short sellers rush to get out of the unsatisfactory equities.