
What is candlestick pattern
Candlestick charts are a technical tool that packs data for multiple time frames into single price bars. This makes them more useful than traditional open, high, low, close (OHLC) bars or simple lines that connect the dots of closing prices. Candlesticks build patterns that may predict price direction once completed.
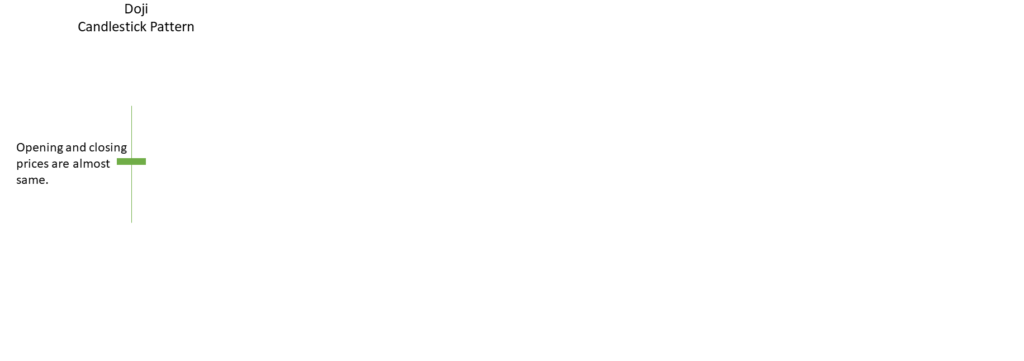
Doji candle
Dojis are a tool used in technical analysis to find patterns in the price of securities. A trading session is known as a “doji” when a security’s open and close are almost equal, like a candlestick on a chart. The Japanese expression “the same thing” is where the word “doji” originates.
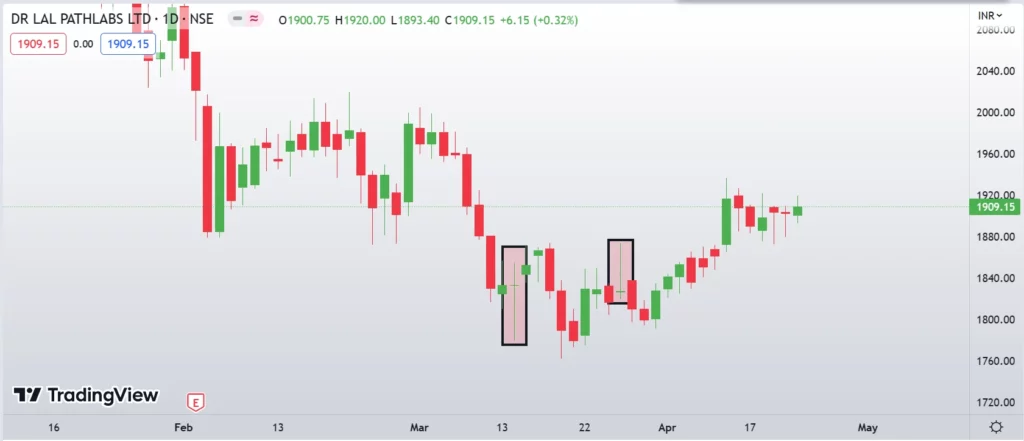
Example:
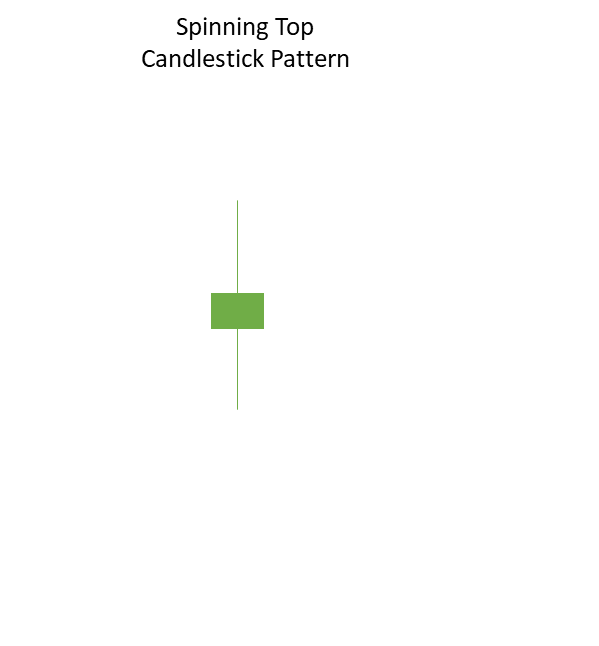
Spinning Top
The spinning top candlestick pattern has the same meaning as the Doji, which stands for market uncertainty.
The true body of a spinning top is larger than a Doji, which is the only structural distinction between the two.
Example:

Disclaimer : The information mentioned above is merely an opinion and should only be treated for educational purposes. If you have any questions or feedback about this article, you can write us back. To reach out, you can use our contact us page.