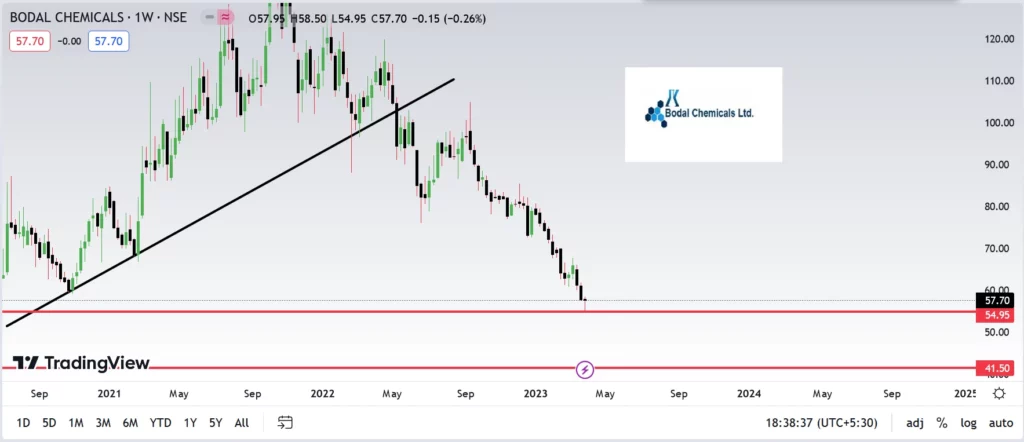
As you can see Bodal Chemicals is currently trading at Rs 57.70 but our experts suggest to wait till it goes above 60 and for the downside one can take position at Rs41.50.
The latest balance sheet data shows that Bodal Chemicals had liabilities of ₹8.04b due within a year, and liabilities of ₹2.66b falling due after that. On the other hand, it had cash of ₹151.5m and ₹5.95b worth of receivables due within a year. So its liabilities outweigh the sum of its cash and (near-term) receivables by ₹4.59b.
Bodal Chemicals has a market capitalization of ₹11.7b, so it could very likely raise cash to ameliorate its balance sheet, if the need arose. But it’s clear that we should definitely closely examine whether it can manage its debt without dilution.
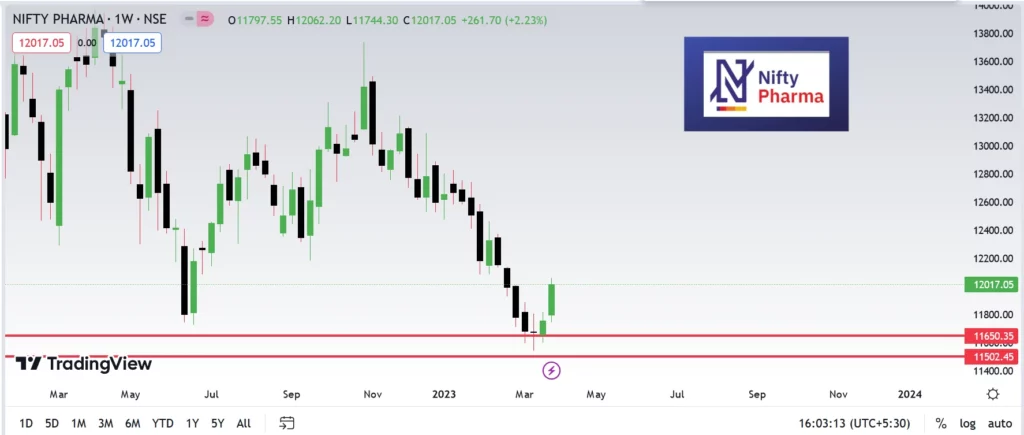
In a bullish market on Friday, the Nifty Pharma index moved in the green around 11:16AM (IST).
Among the top gainers were Granules India (up 5.43%), Glenmark Pharmaceuticals (up 4.43%), Ipca Laboratories (up 2.42%), Glaxosmithkline Pharmaceuticals (up 2.37%), and Sanofi India (up 2.31%). The biggest losers on the index were Lupin (down 1.33%), Sun Pharmaceutical Industries (down 0.67%), Pfizer (down 0.46%), Gland Pharma (down 0.41%), and Zydus Lifesciences (down 0.22%).
At the time this story was being written, the Nifty Pharma index was up 0.55 percent, standing at 12008.6.
The BSE Sensex increased by 591.23 points to 58551.32, while the benchmark NSE Nifty50 indicator increased by 162.65 points to 17243.35.
Following Covid, analysts noted that the pace of US FDA inspections has once more accelerated and that they have observed a rise in incidents with 483 observations and unfavourable outcomes.
In a statement made at its board meeting on Friday, Rama Steel Tubes announced a 4:1 bonus share issuance.
According to the company’s press statement, the bonus share issue will include the issuance of shares worth Rs 42.10 crore.According to the company’s filing, “Bonus shares will be issued out of credit of the share premium account of the Company available as of audited financial statements as of September 30, 2022.”
According to the business, bonus shares will be credited to investors by January 18, 2023, or within two months of the date of board approval. With a year-to-date return of 158% and a one-year return of 255%, Rama Steel Tubes is a multibagger investment.
Let us look at the Fundamentals of the company
Profit & Loss
Consolidated Figures in Rs. Crores / View StandalonePRODUCT SEGMENTS
Mar 2015
Mar 2016
Mar 2017
Mar 2018
Mar 2019
Mar 2020
Mar 2021
Mar 2022
TTM
Sales +
192
242
260
377
504
353
470
768
1,189
Expenses +
187
227
240
354
488
344
452
726
1,150
Operating Profit
6
15
20
22
16
9
18
42
39
OPM %
3%
6%
8%
6%
3%
2%
4%
5%
3%
Other Income +
3
3
4
5
5
6
8
9
13
Interest
5
6
8
6
9
10
8
11
17
Depreciation
2
3
3
2
3
3
3
4
5
Profit before tax
1
9
13
18
9
2
15
36
31
Tax %
22%
30%
28%
31%
11%
80%
16%
24%
Net Profit
1
6
9
13
8
0
12
27
25
EPS in Rs
0.02
0.16
0.24
0.30
0.20
0.01
0.29
0.65
0.55
Dividend Payout %
0%
0%
0%
0%
0%
0%
0%
3%
Compounded Sales Growth
10 Years:
%
5 Years:
24%
3 Years:
15%
TTM:
81%
Compounded Profit Growth
10 Years:
%
5 Years:
24%
3 Years:
48%
TTM:
-12%
Stock Price CAGR
10 Years:
%
5 Years:
31%
3 Years:
227%
1 Year:
117%
Return on Equity
10 Years:
%
5 Years:
14%
3 Years:
14%
Last Year:
24%
Balance Sheet
Consolidated Figures in Rs. Crores / View StandaloneCORPORATE ACTIONS
As per the Global Industry Classification Standard (GICS), there are 7 different stock market sectors which are commonly classified.
1. Energy Stock Sector
The energy field includes businesses involved in the oil and natural gas industries. This industry includes businesses that explore for and produce oil and gas as well as those that make ethanol and coal, which are consumable fuels. The energy industry also includes companies that deal in goods and services related to the extraction of oil and gas.
2. Basic Materials Stock Sector
The material sector includes businesses that offer a range of products used in manufacturing and other uses. The basic materials stock industry includes businesses that manufacture chemicals, building materials, packaging, and containers, as well as businesses that mine stocks and make paper. Companies that operate in the business-to-business sector, or those that offer their products to other businesses and are at the start of the supply chain, are taken into account in this section.The energy field includes businesses involved in the oil and natural gas industries.
3. Industrials Sector
The industrial segment includes businesses that use heavy machinery, such as aerospace, manufacturing, airlines, and building. The industrials also have a comparable reputation to the oil firms in terms of stable dividend payments and large cash flow generation. There will probably be more money flowing into the defence companies in this industry as a result of the rise in defence budgets in many nations around the globe.The material sector includes businesses that offer a range of products used in manufacturing and other uses.
4. Consumer Discretionary
The businesses that fall under the category of consumer discretionary are those where you and I spent a lot of money. The area where discretionary income is spent is this one. Consumer discretionary includes the retail industry as well as bars, eateries, hotels, automobiles, media, and domestic goods. The businesses in these categories are all familiar to us. Every day, you interact with them. These include Starbucks, Taco Bell, PVR Plaza, Amazon, Flipkart, and so on. The industrial segment includes businesses that use heavy machinery, such as aerospace, manufacturing, airlines, and building.
5. Consumer Staples stock sector
Discretionary items Consumer basics are another thing. The industries of food, drink, and cigarettes are examined. The industry includes the production of supermarkets, personal products, and domestic goods. Because of these businesses, the industry is defensive. In the event of a recession, bounce back swiftly. The businesses that fall under the category of consumer discretionary are those where you and I spent a lot of money. The area where discretionary income is spent is this one. Consumer discretionary includes the retail industry as well as bars, eateries, hotels, automobiles, media, and domestic goods.
6. Information Technology Stock Sector
It’s the computer industry. The only businesses in this industry are Internet applications and semiconductor firms. This industry includes businesses that deal with technological innovation and concentrate on developing software or offering services connected to finding technical solutions and putting them into practise. The information technology industry also includes the businesses that produce the tools, parts, and hardware that enable technology.The financial sector includes companies that deal mainly in money transfers. Banks make up a significant portion of this area, and you can also find insurance and real estate firms there.
7. Financials Sector
The financial sector includes companies that deal mainly in money transfers. Banks make up a significant portion of this area, and you can also find insurance and real estate firms there. The sector’s interest rate is closely correlated. When interest rates rise, the large institutions profit greatly. Due to the fact that banks offer loans and mortgages, the bank receives the greater interest rate.The financial market is divided into two main segments. Companies that create pharmaceuticals and treatments based on biotechnology, analytical instruments, and clinical trial materials are included in the first subcomponent. The other compo
What Is the Ideal Number of Stocks to Have in a Portfolio?
There is no one proper answer to this topic, despite the appearance that many sources have an opinion on the “appropriate” quantity of companies to purchase in a portfolio.
The ideal amount of stocks to own in your portfolio relies on a variety of variables, including your nation of residence and investment, your time horizon for investing, the state of the market, and how frequently you read the news about the market and your holdings.
KEY TAKEAWAYS
There isn’t really a single proper response to this topic, despite the fact that many sites have an opinion on the “appropriate” quantity of stocks to purchase.
The ideal quantity of stocks to own may vary depending on your investment time horizon, the state of the market, and how frequently you will review your holdings.
Diversification is unquestionably essential to long-term returns, despite the fact that there is no universally accepted answer to this question.
A well-diversified portfolio lessens exposure to unsystematic risk, or the risk connected to a certain business or sector.
But take into account the costs associated with owning more and more stocks. In general, it is best to keep the fewest possible stocks in order to effectively reduce one’s exposure to unsystematic risk.
Understanding the Ideal Number of Stocks to Have in a Portfolio
Investors diversify their resources among a variety of investment vehicles primarily to reduce risk exposure. Particularly, diversity enables investors to lessen their exposure to unsystematic risk, which is defined as the risk connected to a specific business or industry.
A well-diversified equity portfolio can effectively reduce unsystematic risk to nearly zero levels while maintaining the same expected return level as a portfolio with excess risk, according to academic research in the field of modern portfolio theory. Investors are unable to diversify away systematic risk, such as the risk that an economic recession will bring down the entire stock market.
To put it another way, investors typically do not benefit from improved return potential for assuming unsystematic risk, even when they must take greater systematic risk for potentially higher profits (a situation known as the risk-return tradeoff).
The more stocks you have in your portfolio, the less exposed you are to unsystematic risk. A portfolio with 10 or more stocks—especially one with stocks from different sectors or industries—is substantially less risky than one with just two stocks.
Consider Transaction Fees
It is often best to hold the bare minimum of stocks required to completely eliminate their exposure to unsystematic risk because the transaction costs associated with holding more equities can certainly pile up. How much is this number? There is a reasonable range, but there is no agreed-upon answer.
Recent studies indicate that holding as many stocks as an investor desires can help them maximise their portfolios by taking advantage of the reduced transaction costs provided by online brokers. There is a time-cost fallacy, too, and most investors discover that by selecting index-based assets instead, their portfolios can perform at least as well. Exchange-traded funds are these (ETFs).
You might want to think about using index funds or ETFs to provide quick and easy diversification across different sectors and market cap groups if the thought of having to research, choose, and keep up-to-date awareness of numerous different individual stocks intimidates you. These investment vehicles effectively let you buy a basket of stocks with a single transaction.
How Many Stocks Should You Own for a Diversified Portfolio?
Although there isn’t a magic number, it is generally accepted that investors should diversify their portfolio across the industries they want exposure to while maintaining a healthy allocation in fixed-income securities to protect themselves against downturns in specific companies or industries. This typically equates to a minimum of 10 stocks.
How Many Stocks and Bonds Should Be in a Portfolio?
The solution is based on the strategy you use for asset allocation. You could devote 100% of your portfolio to stocks if you adopt an extremely aggressive strategy. being a little bit pushy. shift 20% of your assets to cash and bonds and 80% of it to stocks.
Keep 60% of your portfolio in stocks and 40% in cash and bonds if you want moderate development. Finally, take a conservative strategy and invest no more than 50% of your money in stocks if you want to safeguard your capital rather than obtain higher returns.
How Many Stocks Should I Own With $10,000?
ETFs are the method of choice for investors who want to spread their holdings. This enables them to acquire a much wider range of businesses than they could if they bought individual shares of each one. A $10,000 investment into several ETFs could give the investor exposure to thousands of assets.
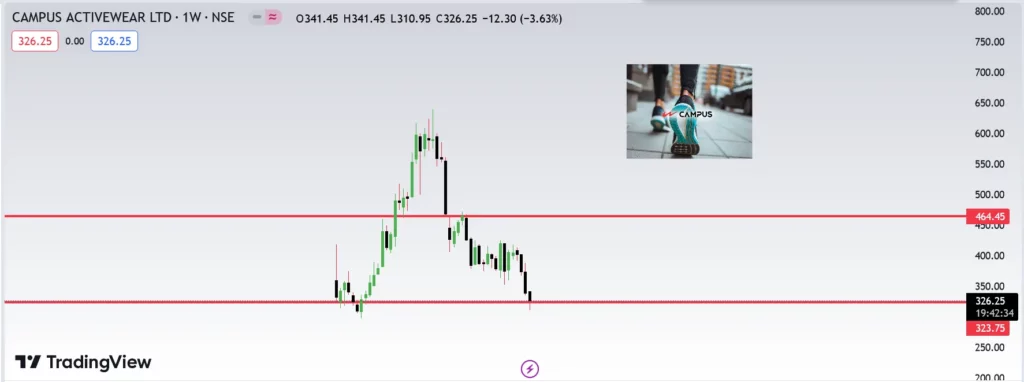
In response to allegations that American alternative asset management firm TPG Global may have sold a 7.6% stake in the sports shoemaker, shares of Campus Activewear fell more than 8% to Rs 337.5 in Friday’s BSE trading. The block deal’s floor price was fixed at Rs 345 per share, or around 7% less than the previous closing price. According to reports, JM Financial is the deal’s only book-running manager. We suggest one can start buying campus above 340.
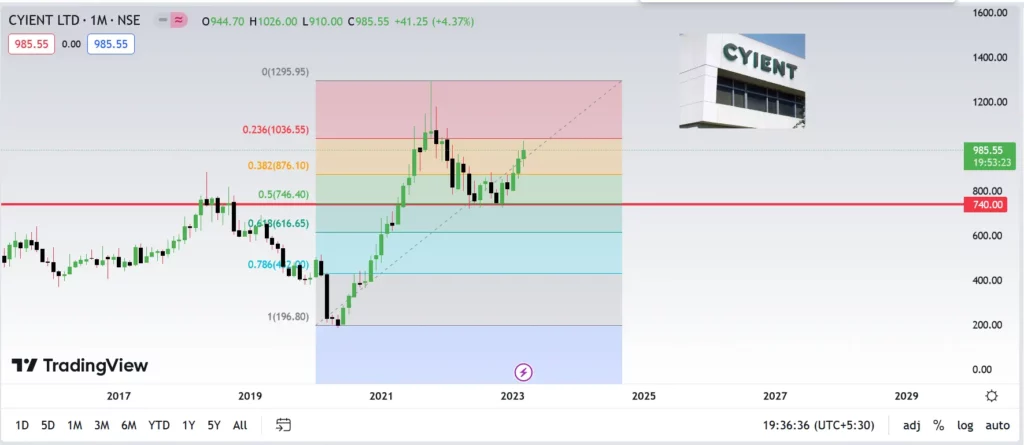
Cyient got a buy signal from HDFC Securities with a target price of Rs 1030. Cyient Ltd. is currently valued at Rs 961.9 on the open market.
A Mid Cap business with a market cap of Rs 10817.57 Crore, Cyient Ltd. was established in 1991 and works in the IT Software industry.Financials For the three months that concluded on December 31, 2022, the firm recorded consolidated total income of Rs 1645.70 crore, up 36.52% from the same period last year and up 16.23% from the previous quarter’s total income of Rs 1415.90 crore. In the most recent quarter, the company generated a net profit after tax of Rs. 156.00 Crore.
Let us look at the Fundamentals
Profit & Loss
Consolidated Figures in Rs. Crores / View StandalonePRODUCT SEGMENTS
Mar 2011
Mar 2012
Mar 2013
Mar 2014
Mar 2015
Mar 2016
Mar 2017
Mar 2018
Mar 2019
Mar 2020
Mar 2021
Mar 2022
TTM
Sales +
1,188
1,553
1,873
2,206
2,736
3,094
3,586
3,914
4,618
4,427
4,132
4,534
5,446
Expenses +
1,008
1,284
1,531
1,796
2,335
2,680
3,109
3,394
3,985
3,881
3,557
3,717
4,552
Operating Profit
180
269
342
410
401
414
477
520
633
546
575
818
894
OPM %
15%
17%
18%
19%
15%
13%
13%
13%
14%
12%
14%
18%
16%
Other Income +
29
16
36
17
122
112
79
147
131
158
140
112
100
Interest
1
1
0
1
6
16
17
20
33
49
43
39
84
Depreciation
49
49
64
72
71
89
95
105
111
188
194
192
227
Profit before tax
160
235
315
354
446
421
444
541
620
468
477
698
682
Tax %
17%
36%
31%
29%
25%
24%
24%
26%
23%
27%
24%
25%
Net Profit
140
161
231
266
351
320
340
403
477
341
364
522
505
EPS in Rs
12.55
14.48
20.70
23.76
31.43
28.94
30.54
36.00
42.33
31.14
33.06
47.35
45.78
Dividend Payout %
10%
17%
22%
21%
25%
24%
34%
36%
35%
48%
51%
51%
Compounded Sales Growth
10 Years:
11%
5 Years:
5%
3 Years:
-1%
TTM:
22%
Compounded Profit Growth
10 Years:
12%
5 Years:
8%
3 Years:
3%
TTM:
11%
Stock Price CAGR
10 Years:
19%
5 Years:
7%
3 Years:
66%
1 Year:
8%
Return on Equity
10 Years:
17%
5 Years:
16%
3 Years:
15%
Last Year:
17%
Balance Sheet
Consolidated Figures in Rs. Crores / View StandaloneCORPORATE ACTIONS
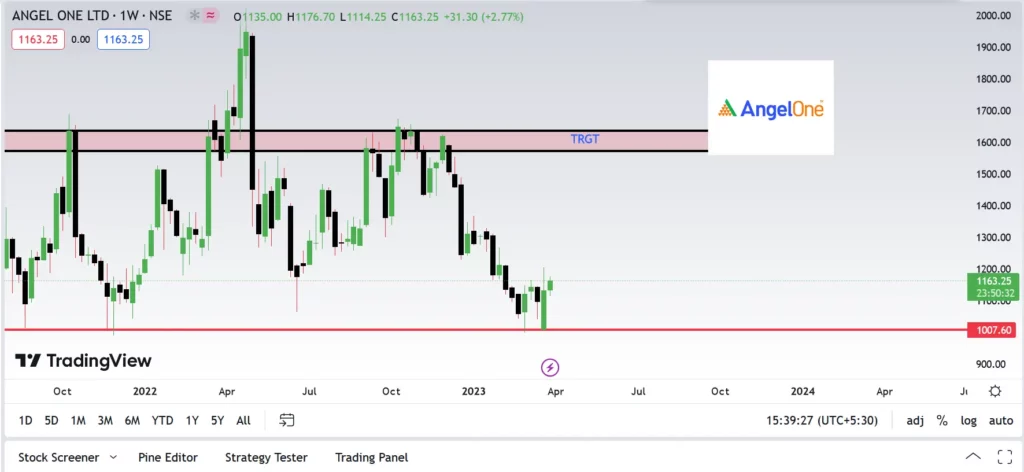
The board of directors of retail brokerage firm Angel One Ltd. approved a fourth interim dividend of 9.60 per equity share for the fiscal year 2022–2023, sending the company’s stock up more than 3% on Wednesday. During midday trading, the stock was up 3.28 percent, trading at 1,127.65 per share. The record date for determining whether stockholders are eligible to receive the aforementioned interim dividend is March 31, 2023.
The members whose names appear on the Register of Members or in depositories’ records as beneficial owners of the shares as of Friday, March 31, 2023, will receive the dividend on or before April 20, 2023, according to Angel One.
Let us look at the Fundamentals
Profit & Loss
Consolidated Figures in Rs. Crores / View StandalonePRODUCT SEGMENTS
Mar 2015
Mar 2016
Mar 2017
Mar 2018
Mar 2019
Mar 2020
Mar 2021
Mar 2022
TTM
Sales +
450
451
440
770
778
748
1,289
2,292
2,776
Expenses +
339
362
437
516
575
564
826
1,374
1,655
Operating Profit
112
90
3
254
203
183
462
918
1,121
OPM %
25%
20%
1%
33%
26%
24%
36%
40%
40%
Other Income +
11
11
112
14
11
2
8
13
99
Interest
38
36
54
95
70
50
42
76
89
Depreciation
10
13
14
15
20
21
18
19
27
Profit before tax
74
52
48
159
124
114
410
836
1,104
Tax %
37%
39%
35%
32%
36%
28%
28%
25%
Net Profit
47
32
31
108
80
82
297
625
828
EPS in Rs
32.69
22.08
21.59
14.99
11.09
11.44
36.28
75.41
99.53
Dividend Payout %
13%
25%
31%
91%
24%
24%
35%
36%
Compounded Sales Growth
10 Years:
%
5 Years:
39%
3 Years:
43%
TTM:
39%
Compounded Profit Growth
10 Years:
%
5 Years:
82%
3 Years:
99%
TTM:
59%
Stock Price CAGR
10 Years:
%
5 Years:
%
3 Years:
%
1 Year:
-24%
Return on Equity
10 Years:
%
5 Years:
32%
3 Years:
36%
Last Year:
46%
Balance Sheet
Consolidated Figures in Rs. Crores / View StandaloneCORPORATE ACTIONS
The National Stock Exchange (NSE), the Bombay Stock Exchange (BSE), or both may list a private firm when it makes an initial public offering (IPO). After a company is listed on a stock exchange, investors can purchase and sell its shares. The public, including institutional investors, investors from other countries, and retail investors, are other sources of funding for the business. In India, the two most well-known and important stock exchanges are NSE and BSE.
In the NSE, more over 1600 companies are listed. On the NSE, only 1328 businesses are now actively traded. On the NSE India website, you can view a list of the companies that are NSE registered. Equity, equity derivatives, currency derivatives, commodities derivatives, and debt are the allowed market categories on the NSE. In this post, we’ll learn about the NSE, how to access a list of all the companies that are listed there, the top NSE-registered businesses, and more.
What is NSE?
The National Stock Exchange, or NSE, was established in 1992 and commenced operations in 1994. It is India’s most well-known and important stock market. Located in Mumbai, Maharashtra, it was the first exchange to launch electronic or screen-based trading. Leading banks, insurers, financial institutions, and other financial intermediaries created it. Ashishkumar Chauhan serves as the managing director and chief executive officer of NSE.
A stock exchange is a marketplace where investors can purchase and sell shares. In other words, it serves as a venue for the exchange of shares between buyers and sellers. The stock exchange’s primary responsibility is to match buy and sell orders. As an illustration, trader “A” has ordered to purchase 10 shares at Rs. 100, and trader “B” has ordered to sell 10 shares at Rs. 100. The stock exchange will in this instance match these orders based on price-time priority. A clearing company is used to settle the transaction.
The fundamental goals of the NSE were to create trading platforms for diverse securities kinds, guarantee equal opportunity for all investors, and create a transparent securities market through an electronic trading system. Additionally, it has introduced a number of new products, including corporate bonds, interest rate futures, currency derivatives, and government securities (G-Secs) (IRFs).
The major broad market indices of NSE are Nifty 50, Nifty Next 50, Nifty 100, Nifty 200, Nifty 500, Nifty Midcap 50, Nifty Smallcap 100, etc. the major sectoral indices of NSE are Nifty Bank, Nifty Auto, Nifty FMCG, Nifty IT, Nifty Pharma, Nifty PSU bank, etc.
Growth of the number of companies listed in NSE from 2011 to 2020 :
Year
No of the listed companies in NSE
FY 2020
1,959
FY 2019
1,955
FY 2018
1,923
FY 2017
1,817
FY 2016
1,808
FY 2015
1,736
FY 2014
1,688
FY 2013
1,666
FY 2012
1,646
FY 2011
1,574
How to find the list of all companies in the NSE?
The NSE’s official website has a list of the companies that are registered with it. Simply conduct a google search for NSE.
Visit the NSE website: https://www.NSEindia.com
From the top menu bar, select market data.
under the trade information section, you will find securities available for trading. These are actively traded securities in the stock market.
Select securities available for trading.
Next, you will find securities available for the equity segment. Click on this to download the total listed companies in NSE.
You can find all listed companies in India from stock screener websites like screener. In and money control.
Reliance Industries: Dhirubhai Ambani founded Reliance Industries Ltd., which is listed among the Fortune 500 companies. Textiles, energy, retail, entertainment, materials, and digital services are among the industries it operates in. When it comes to the company’s fundamental measures, the ROCE is 9.42%, ROE is 8.16%, and Stock P/E is 27.6. Compound annual growth rates (CAGRs) for stock prices and profits over the past five years are 23% and 14%, respectively.
HDFC Bank: The first bank to receive RBI approval to open a bank in the private sector was HDFC Bank, which was founded in 1994. Many banking and financial services are offered by it. Dividend yield is 0.96%, ROCE is 5.83%, ROE is 16.6%, and the stock P/E is 21.6. For the past five years, the company has experienced solid profit growth of 20.0% CAGR.
Infosys: The business offers consulting, digital, outsourcing, and technology services. The ROCE is 37.1%, the ROE is 29.0%, the dividend yield is 1.90%, and the stock’s P/E is 30.1. For the past three years, the company’s ROE has been 27.2%, while its dividend payout has been 54.3%.
ICICI Bank: To corporate clients, retail clients, and SMEs, the ICICI bank provides a range of financial products and services. The company’s ROCE is 5.59%, its ROE is 14.8%, its dividend yield is 0.54%, and its stock price to earnings ratio is 21.9. Compound annual revenue growth (CAGR) for profits over the previous five years was 20%, while CAGR for stock prices was 24%.
Infosys: The business offers consulting, digital, outsourcing, and technology services. The ROCE is 37.1%, the ROE is 29.0%, the dividend yield is 1.90%, and the stock’s P/E is 30.1. For the past three years, the company’s ROE has been 27.2%, while its dividend payout has been 54.3%.
In conclusion, you can now make a more informed decision about your investments now that you are aware of how many companies are listed on the NSE and the top list of all listed companies in India. The NSE offers updates on the top gainers and losers stocks every trading day, a list of the most active stocks based on trading volume, the top NSE firms by market size, the top NSE indices, and more in addition to allowing traders to trade in a variety of securities. High risks are connected to the stock market. So, it is crucial to educate yourself on the stock market’s numerous facets.
This is not financial advice. Only informational purposes are served by the blog. Securities market investments are exposed to market risks; before making an investment, thoroughly read all pertinent documentation. Future returns cannot be predicted by past performance. Before selecting a fund or creating a portfolio that meets your needs, please take into account your unique investing needs, risk tolerance, goal, time frame, risk and reward balance, and the cost associated with the investment. Each investment portfolio’s performance and returns are neither predicable nor guaranteed.
Trading shares of publicly traded businesses on the stock market enables investors to make money. If investors in these shares make wise purchase, sell, and/or trade decisions, they could achieve significant profits. An individual can generate high profits by opening an online brokerage account, provided they trade the correct stocks. Since stock prices fluctuate, choosing the best moment to buy them can be very advantageous.Today, stock investing is regarded as one of the finest methods for building long-term wealth. Any investor can use the stock market to help them reach their long-term financial objectives with a strategic investment strategy.A security that gets its value from a derivative.
Investing in shares –
Stocks should be acquired when their prices are low so that more of them can be bought. While stocks with low prices could decline even further, it is preferable to engage in them as opposed to high-priced stocks that might not increase in value past the point of purchase. The price of the latter could fall, which would result in a loss for anyone seeking to sell their shares. In contrast, shares purchased at a discount are more likely to result in earnings.Trading shares of publicly traded businesses on the stock market enables investors to make money. If investors in these shares make wise purchase, sell, and/or trade decisions, they could achieve significant profits. By developing a web-based brokerage.
1. Invest in good stocks
Stocks that are being offered for sale on the market at a price that is thought to be below their actual intrinsic worth are said to be undervalued. Traders can gain from a stock’s potential future earnings when and if it becomes undervalued. Considering a company’s potential for development and profitability in the future can help determine whether its stock is overvalued or undervalued. In order to make these decisions, investors can also take the price to sales or price to cash flow measures into account.Stocks should be acquired when their prices are low so that more of them can be bought. Investing in low-priced stocks is preferable to high-priced stocks, which may not increase in value beyond the period of purchase.
2. Research is Important
Once they have done enough due diligence on the stock market and have sufficiently studied a stock, investors should consider making an investment. The annual report of a business can contain details about its current financial situation and expansion goals. Usually, an openly traded company’s website makes this information simple to find.
Stocks that are being offered for sale on the market at a price that is thought to be below their actual intrinsic worth are said to be undervalued. Traders can gain from a stock’s potential future earnings when and if it becomes undervalued. Considering a company’s potential for development and profitability in the future can help determine whether its stock is overvalued or undervalued. Investors may also take into account the price to sales.
3. Best time of day to buy stocks
The 9:30 AM to 3:15 PM trading hours for the Indian stock exchange. For intraday traders, who purchase and sell stocks during a single business day, 9:30 AM to 10:30 AM is typically the best time to trade. The stock market responds to the news that has occurred since it last closed in 15 minutes. Prior to making buy, hold, or sell decisions that might unintentionally be rash, traders should allow it time to respond. Within an hour and a half of its opening, the stock market’s volatility and number of traded stocks tend to decline. Additionally, prolonged exposure to the stock market and the charts and graphs that go along with it on a particular day can make new investors mentally exhausted and confused. This can then result in.