Learning sharks-Share Market Institute


Rajouri Garden  8595071711 7982037049  Noida 8920210950 , and  Paschim Vihar  7827445731  

Fee revision notice effective 1st April 2025; No change for students enrolled before 15th May 2025

Download “Key features of Budget 2024-2025here

High-Priced VS Low-Priced Stocks:

It’s crucial to monitor the worth of the stocks as well as their price when investing in the stock market. In general, many investors choose stocks with cheaper stock market prices.
Keep in mind that stocks with lower prices typically have greater danger than those with higher prices. Low-priced securities are not precisely defined, though.
However, according to several financial experts, stocks with a price of less than Rs 20 are regarded as low-priced stocks. On the other hand, high-priced securities are those with a price tag of more than Rs 500.
Potential investors are drawn to the comparatively cheaper stocks because they can purchase a greater number in a smaller amount.
This piece will explain the distinction between low-priced and expensive stocks and which stocks deliver in detail.

Difference between High and Low Priced Stock?

Risk

It’s crucial to monitor the worth of the stocks as well as their price when investing in the stock market. In general, many investors choose stocks with cheaper stock market prices.
Keep in mind that stocks with lower prices typically have greater danger than those with higher prices. Low-priced securities are not precisely defined, though.
However, according to several financial experts, stocks with a price of less than Rs 20 are regarded as low-priced stocks. On the other hand, high-priced securities are those with a price tag of more than Rs 500.
Potential investors are drawn to the comparatively cheaper stocks because they can purchase a greater number in a smaller amount.
This piece will explain the distinction between low-priced and expensive stocks and which stocks deliver in detail.

Regulations

The Security and Exchange Board of India (SEBI) keeps track of all stock market action. Because they are the focus of interest in the market, high-priced stocks receive more scrutiny, whereas low-priced stocks receive little attention from investors. Most of the time, they do not even have a file with SEBI and are not listed on important stock exchanges.It’s crucial to monitor the worth of the stocks as well as their price when investing in the stock market. In general, many investors choose stocks with cheaper stock market prices.
Keep in mind that stocks with lower prices typically have greater danger than those with higher prices. Low-priced securities are not precisely defined, though.

Volatility

The typical stock price will fluctuate when there is volatility. Since low-priced equities are less expensive, they are viewed as being very volatile. Since they frequently rise and fall in value over brief periods of time, it stands to reason that their prices will drop quickly.
As a result, investors seeking safety and reliable companies do not favour cheap stocks. On the other hand, expensive equities behave differently from inexpensive stocks.
The Security and Exchange Board of India (SEBI) keeps track of all stock market action. Because they are the focus of interest in the market, high-priced stocks receive more scrutiny, whereas low-priced stocks receive little attention from investors.

Affordability

All new investors who have just joined the stock market can typically afford the low-priced stocks.
Due to their simplicity in purchase and management, novice investors favour low-priced stocks to those that are highly priced. On the other hand, there are some limitations on the entrance of new investors in the case of blue-chip stocks.
Due to their portfolios or other significant factors, many new investors are unable to expand their investment in expensive stocks.VoAll new investors who have just joined the stock market can typically afford the low-priced stocks.


Which Stocks Deliver Higher Returns To Investors
?

For every investor, returns are the factor that counts most when it comes to investments. The greatest indicator isn’t always the stock’s retail price.
Low-priced stocks occasionally have a chance to increase in value and provide buyers with returns, but this is extremely unlikely.
High-priced securities, on the other hand, are worth more than Rs 500. The majority of investors trust these stocks because they have the potential to provide better returns.
Pricey equities have proven to be highly profitable in both the short- and long-term. Investors must initially make a sizable expenditure for higher-priced stocks.
All beginning buyers can typically afford the low-priced stocks.

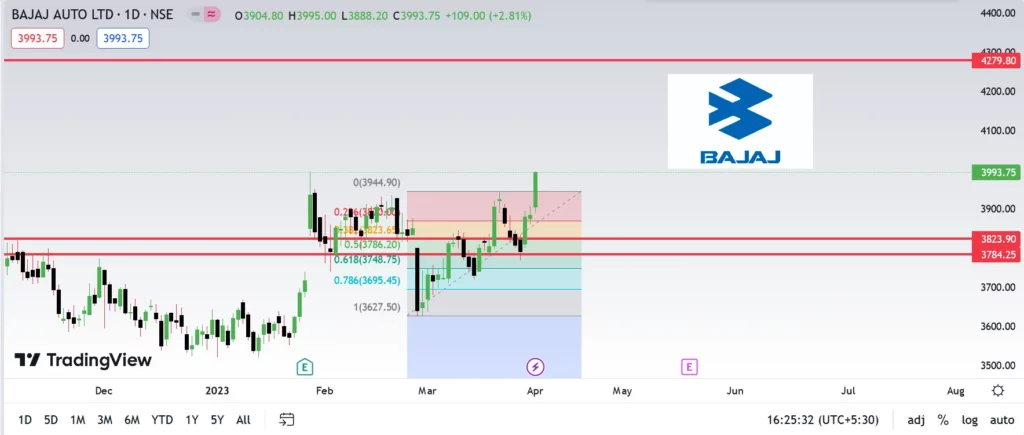
Bajaj Auto Share Price Analysis- Target Price Rs4279

Brokerage firms Antique started a buy on Arvind Smartspace, JPMorgan kept an overweight rating on Bajaj Auto, and IDBI Capital also started covering on Coforge with a buy rating.

From ETNow and other sources, we have compiled a list of the best brokerage firms’ recommendations:

On Bajaj Auto, JPMorgan says: Overweight | Target: Rs. 4400 | Upside 16%

Let us Look at the Fundamentals

Profit & Loss

Consolidated Figures in Rs. Crores / View StandalonePRODUCT SEGMENTS

Mar 2011Mar 2012Mar 2013Mar 2014Mar 2015Mar 2016Mar 2017Mar 2018Mar 2019Mar 2020Mar 2021Mar 2022TTM
Sales +16,40819,58220,02520,13721,59522,57421,75525,21030,35829,91927,74133,14535,501
Expenses +13,22915,90116,37015,97417,46717,78117,32620,36425,16024,80922,80327,88629,347
Operating Profit3,1793,6813,6564,1634,1284,7934,4294,8465,1985,1094,9385,2596,154
OPM %19%19%18%21%19%21%20%19%17%17%18%16%17%
Other Income +1,3865027906742281,1941,4681,4042,0281,8321,5702,6711,788
Interest223116111437927
Depreciation124147168181267307307315266246259270280
Profit before tax4,4384,0134,2774,6554,0835,6795,5885,9336,9566,6926,2417,6527,636
Tax %23%25%29%31%31%28%27%29%29%22%22%19%
Net Profit3,4553,0483,1333,3803,0264,0614,0794,2194,9285,2124,8576,1665,882
EPS in Rs119.39105.35108.26116.82104.56140.35140.98145.80170.29180.11167.85213.08204.41
Dividend Payout %34%43%42%43%48%39%39%41%35%67%83%66%
Compounded Sales Growth
10 Years:5%
5 Years:9%
3 Years:3%
TTM:5%
Compounded Profit Growth
10 Years:6%
5 Years:6%
3 Years:5%
TTM:-2%
Stock Price CAGR
10 Years:9%
5 Years:7%
3 Years:25%
1 Year:6%
Return on Equity
10 Years:25%
5 Years:21%
3 Years:21%
Last Year:19%

Balance Sheet

Consolidated Figures in Rs. Crores / View StandaloneCORPORATE ACTIONS

Mar 2011Mar 2012Mar 2013Mar 2014Mar 2015Mar 2016Mar 2017Mar 2018Mar 2019Mar 2020Mar 2021Mar 2022Sep 2022
Share Capital +289289289289289289289289289289289289284
Reserves4,5185,7927,7769,87810,80613,73117,56720,13622,94421,37326,98429,57025,753
Borrowings +34715011659112118120121125126121123124
Other Liabilities +3,9944,8944,4615,0814,7583,1023,6614,5955,4764,7226,2075,1296,356
Total Liabilities9,14911,12612,64215,30815,96617,24021,63825,14128,83426,51033,60235,11132,516
Fixed Assets +1,8551,9202,3552,6602,4482,0262,0021,8781,7641,6991,6681,8361,787
CWIP704229414425552425648601677222
Investments4,2114,4736,0598,4488,98511,06715,47718,89520,60319,91424,68726,63422,786
Other Assets +3,0134,6923,9344,0564,2774,0954,1174,3126,4204,8377,2326,5647,721
Total Assets9,14911,12612,64215,30815,96617,24021,63825,14128,83426,51033,60235,11132,516

PVR Share Price Analysis- Target Price

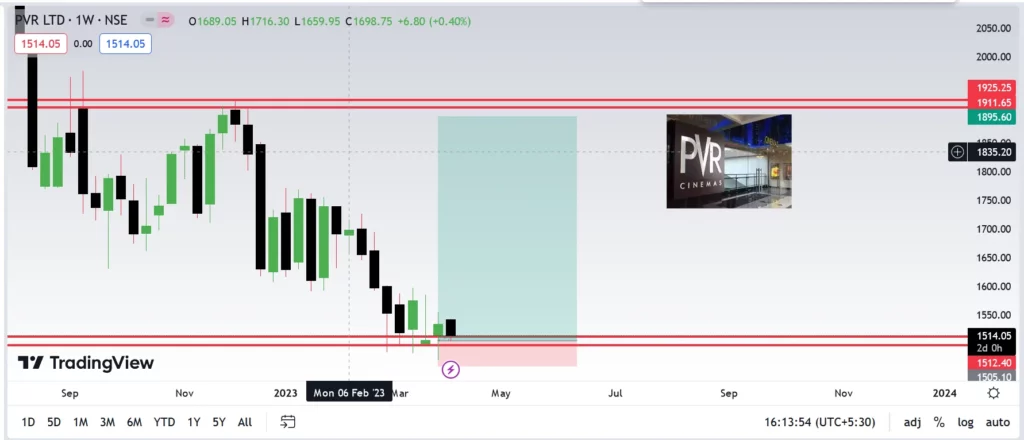
Most brokerage houses stay optimistic about the stock in light of the combined PVR-INOX, which has a share of 43% in multiplex screens and 50%+ in multiplex box office, an improving slate of Hindi films, and a solid pipeline for the entire film industry in FY24. Following the company’s first investor conference following the merger, shares of PVR rose as much as 3% during the day, reaching $1,574.95 per share. On Wednesday, the price increased by 0.94 percent to $1,542.05 per share.

Let us look at the Fundamentals

Profit & Loss

Consolidated Figures in Rs. Crores / View StandalonePRODUCT SEGMENTS

Mar 2011Mar 2012Mar 2013Mar 2014Mar 2015Mar 2016Mar 2017Mar 2018Mar 2019Mar 2020Mar 2021Mar 2022TTM
Sales +4595188061,3481,4771,8502,1192,3343,0863,4142801,3313,146
Expenses +3704416881,1331,2711,5511,7991,9332,4992,3386161,2252,262
Operating Profit90761192152062993204015871,076-336106884
OPM %20%15%15%16%14%16%15%17%19%32%-120%8%28%
Other Income +101061124552303238469326100
Interest1618378078848184128482498498508
Depreciation67365694117115138154191542575614626
Profit before tax163132521214515319429990-939-681-150
Tax %98%18%-39%4%7%32%37%36%37%70%20%28%
Net Profit025445012999612418927-748-489-108
EPS in Rs2.809.0810.4712.712.8619.5819.0824.8437.814.95-123.07-80.04-17.56
Dividend Payout %33%61%9%18%33%10%10%8%5%75%0%0%
Compounded Sales Growth
10 Years:10%
5 Years:-9%
3 Years:-24%
TTM:223%
Compounded Profit Growth
10 Years:%
5 Years:%
3 Years:%
TTM:84%
Stock Price CAGR
10 Years:18%
5 Years:4%
3 Years:15%
1 Year:-21%
Return on Equity
10 Years:-6%
5 Years:-13%
3 Years:-26%
Last Year:-32%

Balance Sheet

Consolidated Figures in Rs. Crores / View StandaloneCORPORATE ACTIONS

Mar 2011Mar 2012Mar 2013Mar 2014Mar 2015Mar 2016Mar 2017Mar 2018Mar 2019Mar 2020Mar 2021Mar 2022Sep 2022
Share Capital +27264041424747474751616161
Reserves3142576033583688359181,0291,4491,4291,7731,3091,318
Borrowings +1622036576137476608208311,2825,0665,0035,1965,291
Other Liabilities +1531262873402733564404421,062881665757646
Total Liabilities6566131,5861,3521,4291,8972,2252,3483,8407,4287,5027,3237,316
Fixed Assets +3682739968208601,0001,5091,5902,7425,8865,4755,4075,360
CWIP5888145107807610610222115521764104
Investments11382422221112100
Other Assets +2302524074024868206096368661,3851,8081,8511,852
Total Assets6566131,5861,3521,4291,8972,2252,3483,8407,4287,5027,3237,316

Introduction

Exchange-traded funds (ETFs), bonds, derivatives, and other financial assets can all be traded on the stock exchange, an electronic marketplace. With the aid of brokers, it creates a market place for investors and traders to exchange and list securities.

The Bombay Stock Exchange (BSE) and the National Stock Exchange (NSE) handle the majority of the trading volume of listed securities in the Indian equity share market.

After the stock exchanges of Hong Kong, China, and Japan, the major market exchanges in India, the BSE and NSE, are among the biggest stock exchanges in Asia.

Market capitalization, the number of listed businesses, traded products, liquidity of listed securities, and benchmark index are the main areas of distinction between NSE and BSE.

What is NSE?

By market capitalization, the National Stock trading (NSE) is India’s largest stock trading market. It was the first stock exchange in India to create a fully automated, electronic, or screen-based trading system. It was founded in 1992 and granted stock exchange status in 1993.

The distribution of actual share certificates became obsolete when the extensive paper-based trading system was eventually superseded by the electronic trading system.

NIFTY, also known as National Fifty, is the stock exchange’s benchmark indicator. NIFTY, which was introduced in 1995–1996 and is based on the market capitalization of fifty of the most actively traded businesses listed on the National Stock Exchange, provides its value.

The Nifty 50 monitors the sixteen hundred stocks listed on the NSE’s fifty largest and most liquid companies. There are fifty biggest stocks.

What is BSE?

The Bombay Stock Exchange was first known as “The Native Share and Stock Brokers Association” when it was founded in 1875. It is the older sibling of the NSE and Asia’s first stock market. BSE didn’t switch from the open-cry system to completely electronic trading until 1995.

Like the NSE, the BSE has a benchmark indicator called the SENSEX. (Sensitive Index). A weighted average value of the top thirty companies listed on the stock exchange, it was first presented in 1986. Along with Eurex, the SENSEX is traded globally on numerous prestigious exchanges in China, Russia, Brazil, and South Africa.

There are numerous divisions of the Bombay Stock Exchange. With over 250 companies, the BSE SME platform is the biggest in India.

Borosil Renewables Share- Should You Buy?

Updates on the cold maintenance of the furnace at GMB Glasmanufaktur Brandenburg GmbH from Stock Report Borosil Renewables Ltd. sharing icon for Facebook Twitter sharing icon for sharing Twitter sharing icon on Pinterest Share this icon can be pinned. WhatsApp sharing icon for sharing Email sending button for sharing Updates on the cold maintenance of the furnace at GMB Glasmanufaktur Brandenburg GmbH from Borosil Renewables Ltd. There was a glass leakage incident from GMB’s furnace on July 31, 2022, prior to the purchase of a majority stake of 86% (through wholly owned subsidiaries) in GMB Glasmanufaktur Brandenburg GmbH (GMB) and Interfloat Corporation (Interfloat) in October 2022. GMB runs its manufacturing plant in Tschernitz, Germany, with a single furnace that can produce 300 tonnes per day (TPD).

Let us look at the Fundamentals

Profit & Loss

Standalone Figures in Rs. Crores / View Consolidated

Mar 2011Mar 2012Mar 2013Mar 2014Mar 2015Mar 2016Mar 2017Mar 2018Mar 2019Mar 2020Mar 2021Mar 2022TTM
Sales +118126134156175222267296217271502644680
Expenses +898127131146168212248255182234305399497
Operating Profit-780-13971019413437197245183
OPM %-664%-1%2%6%4%5%7%14%16%14%39%38%27%
Other Income +1,58242253662111263530352018
Interest2000011007834
Depreciation112455651832424243
Profit before tax799402642641513870461153220155
Tax %19%20%24%11%23%-4%8%34%-0%64%41%25%
Net Profit64833203749161274646090166123
EPS in Rs40.492.621.653.104.101.6913.775.025.010.046.8912.729.45
Dividend Payout %2%14%23%16%15%37%5%12%13%0%0%0%
Compounded Sales Growth
10 Years:18%
5 Years:19%
3 Years:44%
TTM:3%
Compounded Profit Growth
10 Years:23%
5 Years:32%
3 Years:53%
TTM:-34%
Stock Price CAGR
10 Years:58%
5 Years:48%
3 Years:132%
1 Year:-31%
Return on Equity
10 Years:8%
5 Years:12%
3 Years:17%
Last Year:24%

Balance Sheet

Standalone Figures in Rs. Crores / View ConsolidatedCORPORATE ACTIONS

Mar 2011Mar 2012Mar 2013Mar 2014Mar 2015Mar 2016Mar 2017Mar 2018Mar 2019Mar 2020Mar 2021Mar 2022Sep 2022
Share Capital +43333222911131313
Reserves663621624654694634769819323315602772828
Borrowings +002123300429279157213
Other Liabilities +3036303350374165517589113137
Total Liabilities6966596596917507058138874254947831,0551,192
Fixed Assets +83480173156158109108117345320278262
CWIP347146655412514297600
Investments49642540938044538045450946728021424
Other Assets +189153155132143162245266138141178267305
Total Assets6966596596917507058138874254947831,0551,192

KPIT Share Price Analysis-

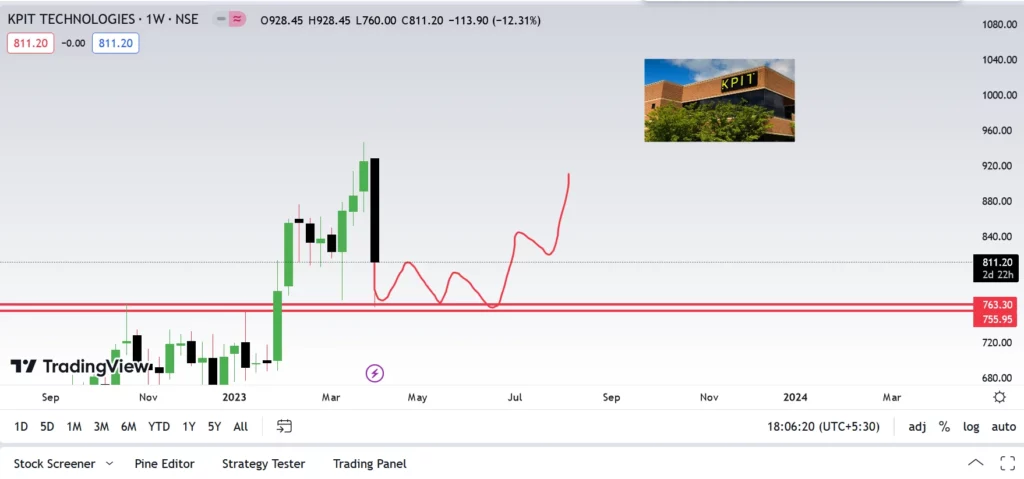
Shares of KPIT Technologies tumbled over 17% to Rs 760 in Monday’s trade on BSE after the global brokerage firm JPMorgan initiated coverage on the stock with an underweight rating and a target price of Rs 520, a potential downside of 44% from Friday’s closing price of Rs 925.

JPMorgan’s target for the stock is driven by lower structural margins, risks from single vertical and high client concentration, and excessive valuations, according to media reports.The average price estimate for the stock, according to Trendlyne data, is Rs 786, down 15% from Friday’s closing price of Rs 925. KPIT Technologies’s average rating from 11 analysts is a hold. Of these experts, three have strong sell and sell ratings, three have strong buy and buy ratings, and one has a hold rating. Seven analysts have strong buy and buy ratings. At 2.49 a.m., the stock was trading 14.4% lower than its previous day’s ending price of 925 rupees per share, at Rs. 792. On the other hand..

Let us look at the Fundamentals

Profit & Loss

Consolidated Figures in Rs. Crores / View StandaloneGEOGRAPHICAL SEGMENTS

Mar 2018Mar 2019Mar 2020Mar 2021Mar 2022TTM
Sales +06412,1562,0362,4322,999
Expenses +05501,8661,7291,9942,440
Operating Profit-092290307439560
OPM %14%13%15%18%19%
Other Income +0119214562
Interest0720171929
Depreciation019108133120135
Profit before tax-067181178345458
Tax %0%18%18%17%20%
Net Profit-055148147276356
EPS in Rs-27.001.985.385.3310.0012.72
Dividend Payout %0%37%18%28%31%
Compounded Sales Growth
10 Years:%
5 Years:%
3 Years:56%
TTM:29%
Compounded Profit Growth
10 Years:%
5 Years:%
3 Years:50%
TTM:41%
Stock Price CAGR
10 Years:%
5 Years:%
3 Years:178%
1 Year:33%
Return on Equity
10 Years:%
5 Years:%
3 Years:17%
Last Year:21%

Balance Sheet

Consolidated Figures in Rs. Crores / View StandaloneCORPORATE ACTIONS

Mar 2018Mar 2019Mar 2020Mar 2021Mar 2022Sep 2022
Share Capital +0268269269270270
Reserves-06917809381,0401,122
Borrowings +0132204230227186
Other Liabilities +0582384531799862
Total Liabilities01,6741,6371,9682,3362,441
Fixed Assets +0420526577641678
CWIP0151202
Investments0509127129128
Other Assets +01,2041,0961,2511,5661,633
Total Assets01,6741,6371,9682,3362,441

Cash Flows

Consolidated Figures in Rs. Crores / View Standalone

Mar 2018Mar 2019Mar 2020Mar 2021Mar 2022
Cash from Operating Activity +-0151389628475
Cash from Investing Activity +016-136-503-292
Cash from Financing Activity +034-177-115-127
Net Cash Flow0201751056

What Is the VIX Volatility Index? Why Is It Important?

The Chicago Board of Options Exchange Volatility Index, or VIX, is a gauge for stock market volatility and investor sentiment.

The VIX strives to predict market volatility through the lens of options trades.

What Is the VIX and How Does It Measure Volatility?

The Volatility Index of the Chicago Board of Exchange is referred to in finance as VIX. This index serves as a general benchmark for stock market volatility and gauges S&P 500 index options. The trading environment is more choppy the higher the index level, thus its other moniker, the fear index, is rather appropriate.

Based on a snapshot of trade behaviour over the preceding 30 days, it gauges expected future volatility.

What Do the VIX Numbers Mean?

  • Typically, a VIX reading of 20 or more is regarded as “high.”
  • The VIX is often regarded as “low” below 12.
  • Any age between 12 and 20 is regarded as “normal.”

Put options provide investors the right to sell shares of a stock on a given date at a specific price, therefore investing in a put option is equivalent to betting that the price of a stock will decrease before the put contract expires.

These are investments that can profit from negative feelings like dread; they are bearish. Because it is widely believed that volatility may have peaked or reached a turning point, there is a saying on Wall Street that goes, “When the VIX is high, it’s time to buy.”

In other words, a dropping VIX number means that the stock market’s general mood is more upbeat or positive. The VIX should be thought of as a percentage even though it isn’t expressed that way. At a VIX of 22, the implied volatility for the SPX is 22%.

How Is the VIX Calculated? What Is the VIX Formula?

The VIX is composed of a continually shifting portfolio of SPX options, unlike the S&P 500 index, which is made up of specific equities. It uses both normal weekly SPX options and those with Friday expirations. Further information on the Chicago Board of Options’ process and selection criteria can be found on the website.

How Do I Interpret the VIX?

There are various ways to read the VIX, but it’s crucial to remember that it’s a theoretical index and not a forecasting tool. Fear, the emotion it tracks, is not even something that can be quantified by concrete facts like the most recent Consumer Price Index. Instead, the VIX uses option pricing to predict how the market will behave in the future.

“The VIX does not measure actual volatility, but rather, implied volatility.”

It’s also critical to comprehend how strongly emotions can influence the stock market. For instance, during earnings season, a company may post strong growth but face a sharp decline in its value because it fell short of analyst expectations. Investors trying to preserve their interests by selling their shares, which lowers prices, is an indication of fear.

At its worst, fear-driven selling has the potential to crash the market and trigger feelings of panic that may lead to capitulation.

But, the VIX is not meant to elicit fear.

Can the VIX Go Above 100?

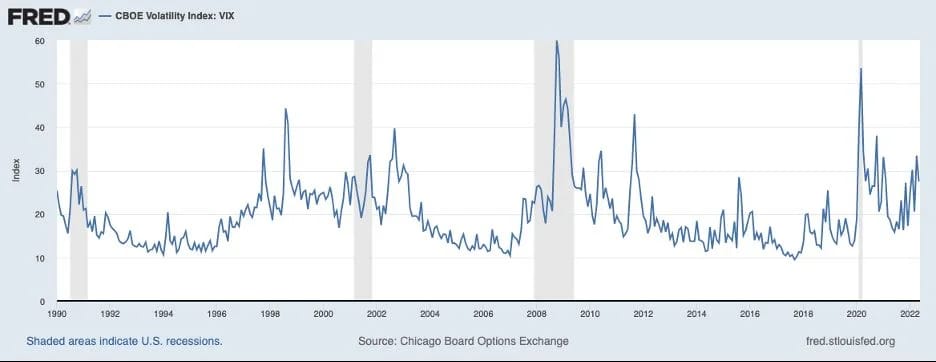
Although it hasn’t done so since data collection started in 1990, theoretically the VIX can rise over 100.

The VIX attained its two highest points at the following times:

  1. The VIX peaked 89.53 on October 24, 2008, at the height of the Financial Crisis, which resulted from the global collapse of mortgage-backed securities.
  2. The VIX peaked at 82.69 on March 16, 2020, at the start of the COVID-19 pandemic.

Experts also contend that the VIX would have reached 100 on Monday, October 19, 1987, during the Black Stock Market Collapse if data collection had started in the 1980s.

The VIX is seen in this chart from the Federal Reserve’s data centre, FRED, from 1990 to 2022. Receding areas are indicated by shading:

How Do I Trade the VIX? Can You Buy Options on the VIX?

Investors can invest in derivatives that track the VIX but cannot directly purchase the VIX itself. Examples of these derivatives include exchange-traded funds (ETFs) based on the VIX, such as ProShares VIX Mid-Term Futures ETF (VIXM), and exchange-traded notes (ETNs), such as the iPath Series B S&P 500 VIX Short-Term Futures ETN (VXX) and the iPath Series B S& (VXZ).

What Is the VIX at Today?

Visit the daily updated website of the Chicago Board of Options Exchange to see the VIX’s current level.

How to Invest in Penny Stocks for Beginners

Penny stocks are frequently the appropriate first stop for novice investors. Penny stocks, as the name suggests, are those businesses that trade with a cheap share price, frequently less than $1. It’s easy to see why novices are drawn in by the idea of investing in a business for a few cents and then profitably selling their shares when the price rises to multiple dollars. Because to the incredibly low prices, an investor can own thousands of shares for a relatively small investment.

But heed this fair warning: Due to their lack of liquidity, wide bid-ask spreads (the amount by which the ask price for an asset exceeds the bid price), small market capitalization, and restricted following and disclosure, such stocks are typically regarded as being highly speculative and high risk.

KEY TAKEAWAYS

  • Companies that frequently trade for less than $1 per share are known as penny stocks.
  • Because the major stock exchanges, such NYSE and Nasdaq, have listing conditions that must be met, including a minimum share price, penny stocks frequently trade off the major market exchanges.
  • Lack of liquidity can be a key problem with penny stocks; it’s not unusual for an investor to become trapped in a position for several days or weeks before there is sufficient supply or demand to enter or leave a position.

Understanding Penny Stocks

A “penny stock” is a securities issued by a small-cap or micro-cap company with a market capitalization of less than $250 million, according to the Securities and Exchange Commission (SEC).
Think of penny stocks as the opposite of blue-chip stocks: they frequently have little or no financial history, or a bad one: The underlying company may be on the verge of bankruptcy. Others define penny stocks as those that trade at less than $5 per share (though some experts choose to adopt a lower cut-off value of $1 per share).

Typically, a penny stock trades off the main stock exchanges. This is due to the large stock exchanges’ listing criteria for the businesses that trade on them, such NYSE and Nasdaq. If a firm fails to maintain a minimum closing bid price of $1 per share after 180 days, Nasdaq will delist its shares.

Narrowing Down Trading Candidates

The next step is to choose which stock to trade once you have a better understanding of where to trade penny stocks. Using stock screening tools, such the one on the OTC Markets website or Finviz, is a common strategy.
The simplest technique to reduce the trading universe is to screen for stocks with a price below $1.

Depending on your approach and level of risk tolerance, you can further narrow the selection down from here.

Your list, based on the filter above, should resemble this once you master using Finviz’s stock screener:

No.TickerCompanySectorPrice ($)
1ASRTAssertio Holdings, Inc.Drug Manufacturers0.99
2CPHIChina Pharma Holdings, Inc.Drug Manufacturers0.67
3NEPTNeptune Wellness Solutions, Inc.Drug Manufacturers0.66
4RMTIRockwell Medical, Inc.Drug Manufacturers0.65
5SNDLSundial Growers, Inc.Drug Manufacturers0.72
6TLGTTeligent, Inc.Drug Manufacturers0.45
7TXMDTherapeuticsMD, Inc.Drug Manufacturers0.77
8ZOMZomedica Corp.Drug Manufacturers0.60

Opening an Account

When opening a trading account, there are numerous things to take into account, including costs, customer service, and how simple it is to move money. Choose a broker that will fulfil your needs by taking your time to compare their specialisations. The fee structure is one element that penny stock investors should pay close attention to. Some brokers charge commissions based on the number of shares.

A per-share structure might be more appropriate for buyers of a small number of shares, but it might not be the ideal option for penny stock traders.

Understanding the Risks

It’s crucial to comprehend the dangers associated with trading penny stocks. These securities typically don’t have a following in the financial community because the majority of institutional investors, such as mutual funds, index funds, and money managers, are prohibited by charter from trading penny stocks.

Since retail investors frequently become caught in a position for days or weeks before there is enough supply or demand to enter or exit, suffering significant price changes along the way, liquidity is a key concern.

Bodal Chemical Share Price Analysis-Is it a risky investment?

As you can see Bodal Chemicals is currently trading at Rs 57.70 but our experts suggest to wait till it goes above 60 and for the downside one can take position at Rs41.50.

The latest balance sheet data shows that Bodal Chemicals had liabilities of ₹8.04b due within a year, and liabilities of ₹2.66b falling due after that. On the other hand, it had cash of ₹151.5m and ₹5.95b worth of receivables due within a year. So its liabilities outweigh the sum of its cash and (near-term) receivables by ₹4.59b.

Bodal Chemicals has a market capitalization of ₹11.7b, so it could very likely raise cash to ameliorate its balance sheet, if the need arose. But it’s clear that we should definitely closely examine whether it can manage its debt without dilution.

Let us look at the Fundamentals

Profit & Loss

Consolidated Figures in Rs. Crores / View Standalone

Mar 2011Mar 2012Mar 2013Mar 2014Mar 2015Mar 2016Mar 2017Mar 2018Mar 2019Mar 2020Mar 2021Mar 2022TTM
Sales +5736145279601,0439081,2331,1421,4241,3751,2262,0511,768
Expenses +5126105087708597581,0079461,1871,2371,1401,8311,608
Operating Profit6142018918415022619623613887220160
OPM %11%1%4%20%18%16%18%17%17%10%7%11%9%
Other Income +164-70519158131016-110
Interest23354047271295919172936
Depreciation14161625222629122128304750
Profit before tax25-41-33471391312041862191015514284
Tax %33%27%30%35%34%34%35%33%35%15%28%31%
Net Profit17-30-2330928613312214186409964
EPS in Rs1.67-2.73-2.122.768.417.8812.1810.0311.727.123.438.795.50
Dividend Payout %32%0%0%0%0%8%7%8%7%11%23%9%
Compounded Sales Growth
10 Years:13%
5 Years:11%
3 Years:13%
TTM:-6%
Compounded Profit Growth
10 Years:18%
5 Years:-4%
3 Years:-8%
TTM:-38%
Stock Price CAGR
10 Years:26%
5 Years:-16%
3 Years:11%
1 Year:-47%
Return on Equity
10 Years:17%
5 Years:12%
3 Years:8%
Last Year:11%

Balance Sheet

Consolidated Figures in Rs. Crores / View StandaloneCORPORATE ACTIONS

Mar 2011Mar 2012Mar 2013Mar 2014Mar 2015Mar 2016Mar 2017Mar 2018Mar 2019Mar 2020Mar 2021Mar 2022Sep 2022
Share Capital +20223747472222242524242425
Reserves483613431352133416738059079571,0311,049
Borrowings +259345348372209143151181171257454676644
Other Liabilities +22217290156169132193194290267314382357
Total Liabilities5495754735935345107071,0721,2901,4551,7492,1132,074
Fixed Assets +272279265168190192222437609656804817803
CWIP1209309192671470274
Investments101122171763600
Other Assets +2752942074153393164595996507899241,227997
Total Assets5495754735935345107071,0721,2901,4551,7492,1132,074

Nifty Pharma Sector Analysis-Heading towards 12600

In a bullish market on Friday, the Nifty Pharma index moved in the green around 11:16AM (IST).

Among the top gainers were Granules India (up 5.43%), Glenmark Pharmaceuticals (up 4.43%), Ipca Laboratories (up 2.42%), Glaxosmithkline Pharmaceuticals (up 2.37%), and Sanofi India (up 2.31%).
The biggest losers on the index were Lupin (down 1.33%), Sun Pharmaceutical Industries (down 0.67%), Pfizer (down 0.46%), Gland Pharma (down 0.41%), and Zydus Lifesciences (down 0.22%).

At the time this story was being written, the Nifty Pharma index was up 0.55 percent, standing at 12008.6.

The BSE Sensex increased by 591.23 points to 58551.32, while the benchmark NSE Nifty50 indicator increased by 162.65 points to 17243.35.

Following Covid, analysts noted that the pace of US FDA inspections has once more accelerated and that they have observed a rise in incidents with 483 observations and unfavourable outcomes.