The covered call strategy entails the trader placing a call option against stock that they intend to buy or already own. In addition to collecting a premium for the sell, the holder of a covered call gains access to the benefits of owning the underlying asset all the way up to the strike price, where the stock would be called away.
- The covered call strategy has numerous applications. Some utilise the method to increase profits on stocks they own while markets are basically flat.
- This is popular option strategy among traders, because, besides the premium, investors can benefit from capital gains should the underlying asset increase in value. Out of the money (OTM) call trades are placed when the outlook is neutral to bullish.
When to Make a Covered Call
The covered call strategy is often initiated 30 to 60 days before the expiration date. This enables the trader to profit from time decay. Of course, the best moment to adopt the plan is determined by the investor’s objectives.
- If the goal is to sell calls and profit from the stock, a small difference between the stock price and the strike price is preferable. If you want to sell both the stock and the call, you should be in a position where the calls are assigned.
- Some investors sell calls and purchase stocks at the same time. This strategy is called a buy-write, and it’s used to decrease the cost basis of recently purchased stocks. With cover calls, there is no additional margin requirements on the stock as you own it.
- When selling the call, a suitable premium is 2% of the current stock price (the premium divided by the stock price). You should determine how much profit you can make from the technique and set a premium accordingly. If implied volatility is high, investors will obtain a bigger premium when shorting options.
For this reason, many investors like holding the stock, and then sell call options with a high premium to help cushion the risk of loss from a downward movement in the stock
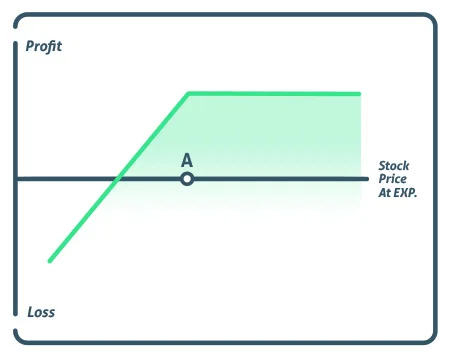
Profit/Loss
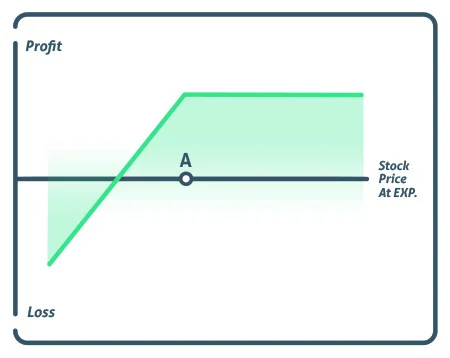
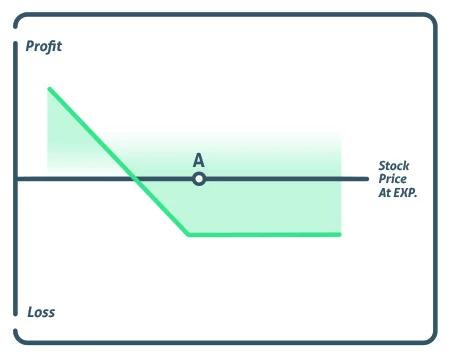
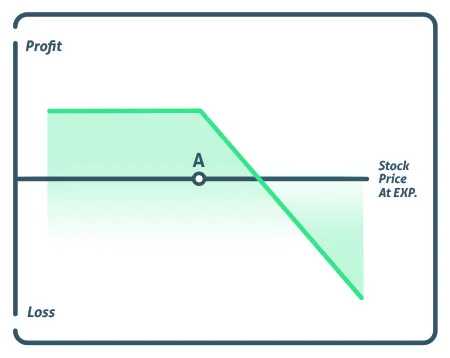
The maximum profit with this strategy is the difference between the strike price and the current stock, plus the premium received for selling the call options contract. Beware of the pitfalls of this strategy, though. The potential loss of this strategy can be substantial.
This loss occurs when the underlying asset’s price falls. In contrast to stock trading, the downside is slightly less severe because to the premium earned, which will buffer any downward stock movement.
Breakeven
The gap between the current stock price and the premium paid for selling call options is the breakeven point.
Example
Consider the following example to better understand OTM calls: In May, a trader purchases 100 shares of stock at Rs.20 and writes a Rs.2 OTM call on June 25. If the stock price is Rs.28 when the option expires, the strike price of Rs.25 is less than the stock price.
The writer will incur a loss on the shares but profit on the calls since they will expire worthless. If the price had dropped to Rs.17, the trader would have lost Rs.3, but because they sold calls for Rs.2, their net loss would be Rs.1.
Conclusion
Covered calls are a great way to generate additional income from owning stock and suitable for investors with all skill levels.
FOLLOW OUR WEBSITE FOR CHART PATTERNS: https://learningsharks.in/chart-patterns/
Follow us on insta” http://learningsharks