Learning sharks-Share Market Institute


Rajouri Garden  8595071711 7982037049  Noida 8920210950 , and  Paschim Vihar  7827445731  

Fee revision notice effective 1st April 2025; No change for students enrolled before 15th May 2025

Download “Key features of Budget 2024-2025here

What is Primary Market in Stock Market?

There is a primary market for most types of assets, with equities (stocks) and bonds being the most common.
primary Market

Securities are created for the first time in a Primary Market for investors to purchase. New securities are issued in this market via a stock exchange, allowing the government and businesses to raise capital.

There are three parties involved in a transaction in this market. It would consist of a corporation, investors, and an underwriter. An initial public offering (IPO) is a security issued by a company in a primary market, and the sale price of such a new issue is determined by a concerned underwriter, who may or may not be a financial institution.

An underwriter also facilitates and monitors the new issue offering. Investors purchase the newly issued securities in the primary market. Such a market is regulated by the Securities and Exchange Board of India (SEBI).

The entity which issues securities may be looking to expand its operations, fund other business targets or increase its physical presence among others. Primary market example of securities issued include notes, bills, government bonds or corporate bonds as well as stocks of companies.

Functions of Primary Market

The functions of such a market are manifold –

  • New Issue Offer

A new issue offering is also facilitated and monitored by an underwriter. In the primary market, investors purchase newly issued securities. The Securities and Exchange Board of India (SEBI) regulates such a market.

The entity issuing securities may want to expand its operations, fund other business goals, or increase its physical presence, among other things. Securities issued in the primary market include notes, bills, government bonds, corporate bonds, and company stock.

  • Underwriting Services

When launching a new issue, underwriting is critical. In a primary market, an underwriter’s role includes purchasing unsold shares if it is unable to sell the required number of shares to the public. Underwriting commissions can be earned by a financial institution acting as an underwriter.

Investors rely on underwriters to determine whether the risk is worth the potential rewards. It is possible that an underwriter will purchase the entire IPO issue and then sell it to investors.

  • Distribution of New Issue

In the primary marketing sphere, a new issue is also distributed. A new prospectus issue kicks off this distribution. It invites the general public to purchase a new issue and provides detailed information on the company, issue, and underwriters involved.

Types of Primary Market Issuance

Following the issuance of securities, investors can purchase them in a variety of ways. There are 5 different types of primary market issues.

Public Issue:-

The most common method of issuing securities to the general public is through a public offering. It is mostly done through an Initial Public Offering (IPO), which results in companies raising capital from the capital market. These securities are available for trading on stock exchanges.

When a privately held company’s shares are first offered to the public through an IPO, it becomes a publicly traded company. A public offering allows a company to raise funds for business expansion, infrastructure improvements, and debt repayment, among other things.

Trading on an open market also increases a company’s liquidity and allows for the issuance of additional shares to raise additional capital for the business.

The Securities and Exchange Board of India is the regulatory body in charge of IPO oversight. According to its guidelines, a company’s authenticity is investigated, and the company is required to include all relevant information in the prospectus for a public offering.

Private Placement:-

Private placement refers to when a company offers its securities to a small group of investors. Bonds, stocks, and other securities may be used, and investors may be both individual and institutional.

Private placements are less difficult to issue than initial public offerings because the regulatory requirements are significantly lower. It also saves money and time, and the company can remain private.

This type of issuance is appropriate for start-ups or companies in their early stages. To raise capital, the company may sell this issuance to an investment bank or a hedge fund, or it may sell it to ultra-high net worth individuals (HNIs).

Preferential Issue:-

A preferential issue is one of the quickest ways for a company to raise capital. Companies, both public and private, can issue shares or convertible securities to a select group of investors. The preferential issue, on the other hand, is neither a public nor a rights issue.

Preference shareholders are entitled to receive the dividend before ordinary shareholders.

Qualified Institutional Placement:-

Another type of private placement is qualified institutional placement, in which a publicly traded company issues securities in the form of equity shares or partially or entirely convertible debentures, in addition to warrants convertible to equity shares and purchased by a Qualified Institutional Buyer (QIB).

QIBs are primarily such investors who have the necessary financial knowledge and expertise to make capital market investments.

Some QIBs are –

  • Foreign Institutional Investors registered with the Securities and Exchange Board of India.
  • Foreign Venture Capital Investors.
  • Alternate Investment Funds.
  • Mutual Funds.
  • Public Financial Institutions.
  • Insurers.
  • Scheduled Commercial Banks.
  • Pension Funds.

Qualified institutional placement is easier to issue than preferential allotment because it does not involve standard procedural requirements such as submitting pre-issue filings to SEBI. As a result, the process becomes much simpler and less time-consuming.

Rights and Bonus Issues:-

Another type of issuance in the primary market is the rights and bonus issue, in which the company offers existing investors the opportunity to purchase additional securities at a predetermined price (in the case of a rights issue) or to receive allotment of additional free shares (in the case of a bonus issue).

In the case of rights issues, investors have the option of purchasing stocks at a reduced price within a set time frame. The issuance of these types of shares increases the control of the company’s existing shareholders while incurring no costs.

A company may issue bonus shares as a gift to its existing shareholders. However, the issuance of bonus shares does not result in the infusion of new capital.

Examples of Primary Stock Market Selling

CompanyDetails
FacebookOne of the remarkable IPOs that were undertaken includes the Facebook initial public offering. The offer initiated in 2012 is to date the largest IPO in the technology sector. The company successfully raised $16 billion through its initial public offering. As an effect, its turnover increased by close to 100%.Also, there was a high demand for the stock in the primary market, which led to the pricing of Facebook’s stock to be fixed at $38 for each share as determined by the underwriters. The valuation of the stock eventually amounted to $104 billion, highest for a newly formed public company.
coal India The biggest IPO undertaken in India was by Coal India in 2010, which raised Rs. 15,200 Crore. The shares were listed at Rs287.75 and eventually increased to Rs.340.The company offered a 5% discount on the final IPO price to retail investors, along with the subsidiaries and employees of the company.


Advantage and Disadvantage of Primary Market

Advantage:-

  • Companies can raise capital at a low cost, and securities issued in the primary market have high liquidity because they can be sold in the secondary market almost immediately.
  • The primary market is an important source of savings mobilization in an economy. Commoners’ funds are mobilized for investment in other channels. It results in monetary resources being invested in various investment options.
  • When compared to the secondary market, the chances of price manipulation in the primary market are significantly lower. Manipulation typically occurs by deflating or inflating a security price, thereby interfering with the market’s fair and free operation.
  • The primary market serves as a potential avenue for risk diversification. It enables an investor to diversify his or her investment across multiple financial instruments and industries.
  • It is unaffected by market fluctuations. Stock prices are set before an initial public offering, and investors know how much money they will need to invest.

Disadvantage:-

  • Because unlisted companies are not subject to the Securities and Exchange Board of India’s regulatory and disclosure requirements, investors may have limited access to information prior to investing in an IPO.
  • Because the company is offering its shares to the public for the first time through an initial public offering, there is no historical trading data in a primary market for analyzing IPO shares.
  • Small investors may find it unfavorable in some cases. Small investors may not receive share allocation if a share is oversubscribed.

Individuals can make well-informed decisions about investing in the primary market using this information about the market. It also paves the way for the development of a risk-diversified investment portfolio.

Primary Market vs Secondary Market

The primary distinctions between the Primary Market and the Secondary Market are as follows:-

FeaturesPrimary Market Secondary Market
PurposeFirst-time issuance and sale of new securitiesSecurities that already exist are acquired and sold
ParticipantsIssuing Companies, Underwriters, InvestorsInvestors, Brokers, Dealers
FunctionCapital RaisingTrading
PriceFixed PriceMarket-Driven Price
VolumeLow VolumeHigh Volume
LiquidityLow LiquidityHigh Liquidity
RegulationRegulated by SEBIRegulated by Stock Exchanges and SEBI

FOR MORE INFO CLICK THIS SITE:https://learningsharks.in/

FOLLOW OUR PAGE:https://www.instagram.com/learningsharks/?hl=en

What is Technical Analysis in Stock Market?

By examining statistical trends gleaned from trading activity, such as price movement and volume, technical analysis is a trading discipline used to assess investments and spot trading opportunities. Technical analysis focuses on the analysis of price and volume as opposed to fundamental analysis, which seeks to determine a security’s worth based on financial metrics like sales and earnings.

KEY TAKEAWAYS

  • Technical analysis is a trading strategy used to assess financial investments and spot trading opportunities in price movements and chart patterns.
  • According to technical analysts, a security’s previous trading activity and price changes can be useful predictors of the security’s future price moves.
  • In contrast to technical analysis, which concentrates on recent price patterns and stock trends, fundamental analysis concentrates on the financials of a company.

Understanding Technical Analysis

The impact of supply and demand on changes in price, volume, and implied volatility is examined using technical analysis tools. It operates under the presumption that, when combined with suitable investing or trading rules, historical trading activity and price changes of a security can serve as valuable predictors of the security’s future price movements.

It can help improve the assessment of a security’s strength or weakness compared to the overall market or one of its sectors. It is frequently used to generate short-term trading signals using different charting tools. Analysts can refine their overall valuation estimate by using this information.

Charles Dow and his Dow Theory made technical analysis what it is today in the late 1800s.
William P. Hamilton, Robert Rhea, Edson Gould, and John Magee were among the notable researchers who added to the Dow Theory’s foundational ideas. Today’s technical analysis has progressed to incorporate a large number of patterns and signals that have been established through many years of study.

Using Technical Analysis

Technical analysis is frequently used in conjunction with other types of study by professional analysts. Retail traders may base their conclusions only on a security’s price charts and comparable data, but in practise, equity analysts rarely confine their research to just fundamental or technical analysis.


Any security with a trading history can benefit from technical analysis. Stocks, futures, commodities, fixed-income, currencies, and other assets are included in this. Technical analysis is actually much more common in the commodities and currency markets, where traders pay attention to short-term price changes.

Stocks, bonds, futures, and currency pairs are just a few examples of tradable instruments that are typically subject to forces of supply and demand and can be predicted using technical analysis. In fact, some people think that technical analysis is just the study of supply and demand dynamics as they manifest themselves in changes in a security’s market price.

The most typical application of technical analysis is to price fluctuations, although some analysts also keep track of other metrics like trade volume or open interest levels.

Fundamental Of Technical Analysis

We must presume that previous chart patterns and future stock prices are somehow related in order to use technical analysis to forecast stock prices. Only in this way can we use historical data to accurately forecast future pricing. The technical analysis of equities is predicated on three key tenets.

  • Market Prices Reflect All The Information About A Stock

We previously stated that fundamental analysis is concerned with the financial and other details of a stock. Despite being entirely separate from fundamental research, technical analysis of equities operates on a similar principle.

If you are a technical analyst, you can think that all stock market participants are well informed about a stock. When they decide to buy or sell something, they genuinely use this information.

The stock price and, ultimately, the stock chart are updated to reflect this information. They do not consider fundamental variables, instead focusing primarily on chart patterns to determine market trends.

  • Patterns Tend To Repeat Themselves

The final supposition supporting a technical analysis is that trends repeat themselves. In other words, imagine that a stock chart follows a hypothetical A-B-C pattern. Therefore, each time we get to “C,” we’ll start over at “A,” then move on to “B,” and finally “C.” Without fail, this trend will continue.

You can use technical analysis to forecast future stock values only after you have made this assumption. Without this presumption, a chart cannot be used to predict where the price will move next.

  • Stock Prices Follow Trends

The foundation of technical analysis of stocks is the notion that every stock chart has a distinct trend of its own. Only within this trend do prices change. Every change in the stock price signals the following action. Consider the fictitious ripple as an example.

You can predict that a stone will cause a series of ripples to appear in a pond when you throw it. The trend will fizzle out after a few tremors. However, a similar ripple will reappear the following time you throw a stone.

  • Charts

The most often utilised technical indicators for technical analysis are price and volume charts. A volume chart shows how many shares of a company were bought and sold throughout the day.

You can select one of the standard line or bar charts for technical analysis, or you can utilise a candlestick chart instead. A unique type of chart that is particularly useful for technical analysis is the candlestick chart. It takes the shape of a line of subsequent candles. In the section on stock charts, we’ll go into more detail about candlestick charts. Trendlines are used in conjunction with charts.

Trendlines show a stock’s movement over time in one direction or another.

  • Moving Averages

In order to eliminate sudden, frequent changes in a stock chart, moving averages are calculated. Stock values can occasionally change dramatically in a short amount of time.

As a result, finding a trend in the stock chart is challenging. A few days’ worth of prices are averaged to reduce the effect of this and highlight a pattern. It is challenging to determine the direction in which prices have truly changed, for instance, if a stock’s price over the last five days has been Rs. 50, 53, 47, 45, and 52. However, you may identify a general trend by calculating the average of these values and comparing it to the average of the following five days and the five days prior.

Importance Of Technical Analysis

  • Mathematical Approach

To choose stocks, technical analysts use probability. They can forecast an action’s consequence using probability without necessarily having to examine it in great depth.

Therefore, technical analysis predicts price movements without forcing you to think about the specifics that will drive those movements. In comparison to fundamental analysis, it is considerably quicker and easier.

  • Signs Of Upcoming Danger

There are instances when a significant decline in stock prices is imminent but nobody can see it coming. Tools for fundamental analysis cannot foresee it. However, the fall can be predicted using previous chart patterns and other analytical methods.

Technical analysis, of course, cannot explain why a price is falling, but it may predict when one will occur. You can accordingly get ready for it.

For instance, the US stock markets were doing well before the financial crisis of 2009. Nobody could have predicted a swift and significant decline in stock prices.

  • Identification Of Short-Term Trends

For investors who wish to make long-term investments, such as three to five years or more, fundamental analysis is increasingly pertinent. This is due to the fact that any lucrative business concept requires time to succeed.

Investors must therefore exercise patience as well. Technical analysis is an exception to this. Ultimately, a company’s profitability determines whether a stock will succeed or fail. Technical analysis cannot be used to anticipate this. It is limited to predicting whether the stock will move up or down in the near term.

Technical Analysis Of Stocks

The main goal of technical analysis is to interpret changes in stock prices and trading activity. However, it is not entirely straightforward to analyse and analyse it. It must be transformed into an understandable format. This data is best presented using stock charts. You can better comprehend stock chart patterns by using the chart patterns listed below.

  • Reversal Patterns

Reversal patterns suggest that the current trend in price movement can change. In other words, if a stock’s price is currently rising, it will begin to fall, and if it is currently falling, it will begin to rise.

Two significant reversal patterns exist:

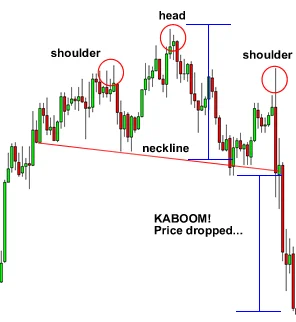
  • Head and shoulders pattern
Head and Shoulder Pattern in Stock Market
Head and Shoulder Pattern
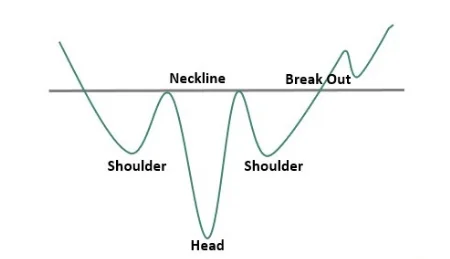
  • Inverse Head And Shoulders Pattern

An uptrend is reversed when a head and shoulders pattern appears. But because it is a reversal pattern, it should also signal the conclusion of a downtrend, or a time when prices have been declining steadily. The upside-down formation of the head and shoulders motif indicates such a reversal.

Such a reversal is indicated by the head and shoulders pattern when it is formed in an upside-down fashion.
Inverse head and shoulder pattern
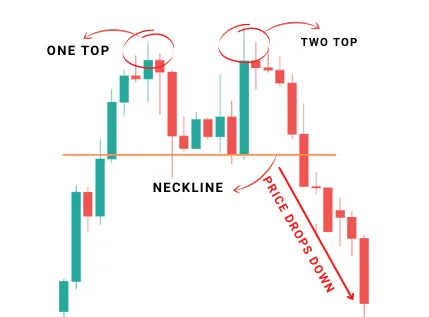
  • Double Tops Pattern

There is a double top after a strong upswing. Instead of three waves, it only has two. The cost is the same at both peaks, unlike head and shoulders. The decline when the trend eventually reverses will be greater the longer the period and the fall between the two waves. Similar to the head and shoulders pattern, the formula for determining the target price also applies to double tops.

A double top occurs after a significant uptrend. It contains two waves instead of three.
Double top pattern
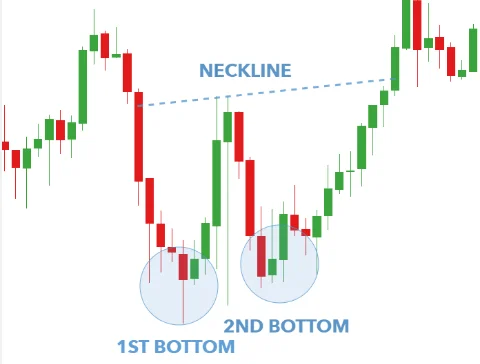
  • Double Bottom Pattern

A double bottom pattern, which resembles a water image of the double top pattern, appears after a period of consistently declining prices.

A double bottom pattern follows a spell of constantly falling prices
Double bottom pattern
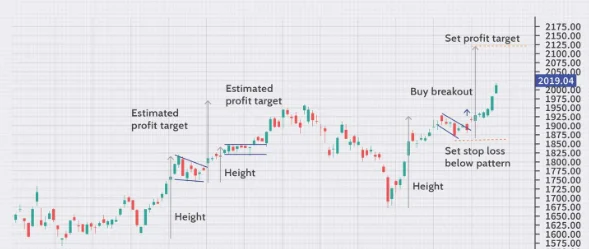
  • Contiunation Patterns

The trend that was depicted by a stock chart before to the development of the pattern would likely continue in the future, according to continuation patterns. For instance, if the price was rising, it would keep doing so. Similar to how it would keep going lower if that was its direction.

if the price was heading higher, it will continue to do so. Similarly, if it was heading lower, it will continue to do so.
Continuation pattern
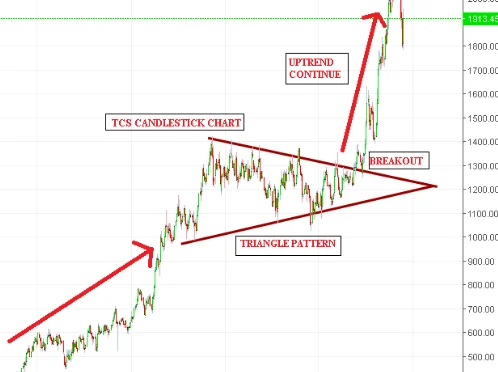
  • Triangle pattern

A triangle pattern develops when the distance between the peaks and bottoms on a stock chart keeps getting smaller. As a result, they will converge if trend lines are added for tops and bottoms, respectively. As a result, the design will appear to be a triangle. One of the three causes described below results in a smaller discrepancy between tops and bottoms.

While the peaks remain stable, bottoms are rising.

While the bottoms are stable, the tops are falling

Tops and bottoms are overlapping.

Ascending, descending, and symmetrical triangles are produced by these patterns, respectively.

When the difference between the tops and bottoms on a stock chart is constantly reducing, it forms a triangle pattern.
Triangle chart pattern
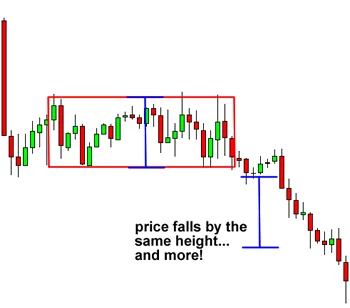
  • Rectangle Pattern

When a stock’s price has been fluctuating within a range, a rectangular pattern develops. Every upward move and every downward move come to an identical top and bottom. In other words, the top and bottom prices remain stable over time.

A rectangular pattern is formed when a stock’s price has been moving within a range.
Rectangle Chart pattern

FOLLOW OUR WEBSITE: https://learningsharks.in/

FOLLOW OUR PAGE: https://www.instagram.com/learningsharks/

Byju’s skips $40 million loan payment in dispute with lenders

Byju’s did not pay $40 million in interest that was due on Monday,
BYJU’s skips deadline for $40 million payment, files suit against lenders

According to people familiar with the situation, Byju’s did not pay the FOR MORE INFO CLICK THIS SITE: in interest that was due on Monday. In a statement issued on June 6, the company stated that it had filed a complaint with the New York Supreme Court regarding the loan.

After a dispute with lenders, education startup Byju’s has decided not to make further payments on a $1.2 billion loan, escalating a conflict that could jeopardize the future of one of India’s most successful startups.

According to people familiar with the situation, Byju’s did not pay the $40 million in interest that was due on Monday. In a statement issued on June 6, the company stated that it had filed a complaint with the New York Supreme Court regarding the loan.

“Given that legal proceedings are now underway in both Delaware and New York,” the company said, referring to the $1.2 billion term loan B. “As a result, BYJU’S cannot be expected to make any further payments to the TLB lenders, including any interest, until the dispute is resolved by the court.”

Byju’s was attempting to reach an agreement with creditors to restructure the loan after the pandemic-era online tutoring boom slowed and crimped its finances. However, creditors demanding an accelerated repayment ended the lengthy negotiations.

According to the people who asked not to be identified because the matter is private, the payment had not been made as of 6 p.m. on June 5 in New York. According to the sources, some lenders are considering how to deal with a potential payment default.

According to Bloomberg data, the loan fell to a low of 64.375 cents on the dollar on Monday, down from 78 cents on June 2.

Former teacher Byju Raveendran’s company had previously missed deadlines for filing financial accounts, and its offices were raided by India’s agency that investigates violations of the country’s foreign-exchange policies.

Raveendran, the son of educators, launched his own company in 2015. The company, whose parent company is formally known as Think & Learn Pvt, grew into the most valuable of the country’s startups over the last decade as demand for online education increased and a series of acquisitions occurred.

It received funding from Tiger Global Management, Mark Zuckerberg’s Chan Zuckerberg Initiative, Silver Lake Management, and Naspers Ltd. Byju’s had a $22 billion valuation and was considering a merger with a special-purpose acquisition company, or SPAC, to go public last year.

Byju’s refuted the notion that its failure to make interest payments indicated financial difficulties.

Only on JioSaavn.com can you listen to the most recent songs.


Byju’s remains financially robust with significant cash reserves,” the company stated in a statement. “It remains open to discussions with the TLB lenders.”

FOR MORE INFO CLICK THIS SITE:https://learningsharks.in/

FOLLOW OUR PAGE:https://www.instagram.com/learningsharks/?hl=en

What is Trading Journal in Stock Market?

 they allow you to assess the overall performance of your trading decisions and how effective your strategy is.
Trading Journal in Stock Market

A trading journal keeps track of your trades, their results, and provides an overview of your trading history. It is not, however, a brokerage account statement since one can discover the justifications for selecting or eschewing a trading strategy.

Each successively executed trade is methodically planned, and the performance of each trading strategy can be tracked in a trading journal. Using a trading journal, you can effectively evaluate the potential of a particular trade regardless of how the market behaves.

Additionally, it won’t cost you much to start a trading journal. You could use Excel or spreadsheets, and it would help you develop discipline and stick to a set of trading strategies. If you find it difficult to consistently follow your trading plan, you should record trading entries in your journal. Noticing when things go wrong and why they did so will help you learn how to respond to similar situations in future trades without acting the same way. Why is it crucial to keep a trading journal? Find out by reading on!

What are the benefits of Trading journal?

A trading journal can yield significant benefits if it is regularly updated, which is a straightforward task. Keeping track of all your data with a pen and paper, a basic Excel spreadsheet, or trading journal software can naturally help you develop a successful trading strategy and prevent you from making the same mistakes repeatedly.

The key benefits of using a trading journal are:

  1. Finding the right trading style- If you are day trading but your journal demonstrates that you frequently experience stress and struggle to properly manage risk, you may be more of a swing trader. Although trading medium- to long-term is not any simpler than trading short-term, some traders find it to be more comfortable because they have more time to analyze the data and are not required to make quick decisions. Finding the right trading style can be aided by testing out various trading techniques.
  2. Identifying your strengths/weaknesses- Over time, if you keep up with your journal, you should start to notice some patterns. Finding the best trading style and strategy will depend on your ability to recognize your key strengths and weaknesses.
  3. Source of information- There is no trader who is an expert in everything and has the means to stop growing. Markets are constantly changing, which causes strategies to fail and edges to disappear. As a result, traders must constantly educate themselves. Making market observations and recording them is one way to go about it. Maybe one of those observations will eventually become an edge.
  4. Discipline- After some practice, maintaining a trading journal won’t seem as tedious and will instead become a routine part of your trading day. A trader will benefit from developing discipline and being more consistent.
  5. Numbers don’t lie- Even better if you include trading statistics in your trading journal. The statistics will help you gain important insights in addition to your own observations. Opening a trading journal is relatively simple, but maintaining consistency is challenging. A trading journal is also very private. There is no right or wrong way to do it because each trader must decide for themselves what is most crucial and how they want to structure it.
  6. Master emotions– Trading psychology can be better understood by tracking trades, which is a clever way to examine behavior patterns. It’s impossible to completely separate your trading process from your emotions. But being able to write down your thoughts and feelings at crucial moments, such as entry and exit points, can prevent you from making poor choices.
  7. Improve risk management– At its core, risk management entails determining the amount of risk you are willing to accept in light of all the relevant market factors. You might start to identify areas where you have the wrong mindset by recording every trade in the journal. By adjusting your risk tolerance, you’ll have a better chance of succeeding and maintaining your capital.

How to use a trading journal?

The idea of an ideal trading journal template is untrue. While entering transactions in their individual trading journals, traders should review the pertinent metrics they require or should avoid using. In light of this, a trade journal needs to be customized.

You can add justifications for adopting particular positions in your written document. In order to avoid having a negative effect on your trading performance, it is also crucial to note the indicators you see during your market watch hours. In your written document, you’ll also debate whether or not a particular trade concept you used is a sound one. You can better understand the benefits and drawbacks of each trade proposal by turning it inside out and backward.

Then, turn to your spreadsheet to enter the details of your daily trading. Keep it organized and up to date to accurately assess your success or failure. In order to avoid missing any important descriptions, try to write down trade details after you execute the trade.

Additionally, it’s a good habit to review your trade log spreadsheet daily to determine your current level of exposure and any potential for growing your trading portfolio. But how do you review the spreadsheet for your trading journal? While analyzing your current trades, carefully go over the written document’s documents and the spreadsheet’s entries.

By looking back at a trading history and identifying trends they should avoid, traders can have their tactics performance-driven rather than influenced by their emotions or conduct. As a result, keeping a trading journal helps you assess your performance, identify areas for development, and become an all-around better trader.

How to create your Trading Journal?

You must keep the following records both during and after the transaction:-

Relevant metrics

  • Date – Date you entered your trade
  • Time Frame – The time frame you entered on
  • Setup – Trading setup that triggers your entry
  • Market – Markets you’re trading
  • Lot size – Size of your position
  • Long/Short – Direction of your trade
  • Price in – Price you entered
  • Price out – Price you exited
  • Stop loss – Price where you’ll exit when you’re wrong
  • Profit & Loss in Rs. – Profit or loss from this trade
  • Karma- Whether you are satisfied with the trade or not. If satisfied, we will add +1 in the Karma column; if not, then -1.

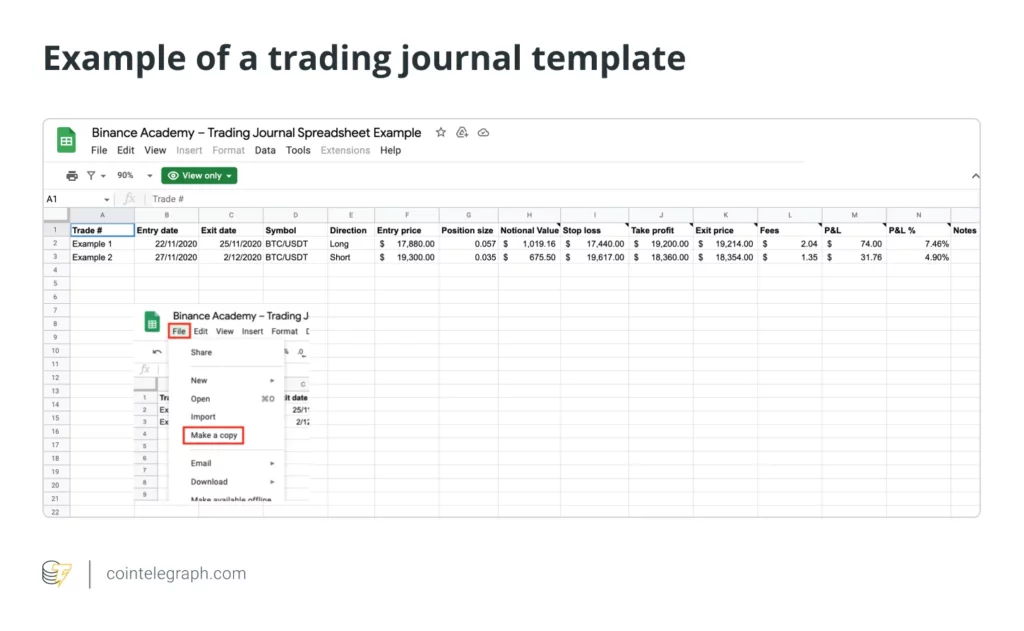
Here is an illustration of a trading journal that we created using the aforementioned metrics and an excel sheet:

Example

No matter what template you choose, make sure it has all the columns required for each trade. To make the journal more useful, you can also take screenshots of the trading charts you have followed and link them to the relevant trade on the sheet.

Let’s examine the columns that your spreadsheet should include when making a trading journal:-

FOR MORE INFO CLICK THIS SITE:https://learningsharks.in/

FOLLOW OUR PAGE:https://www.instagram.com/learningsharks/?hl=en

What is Fundamental Analysis in Stock Market?

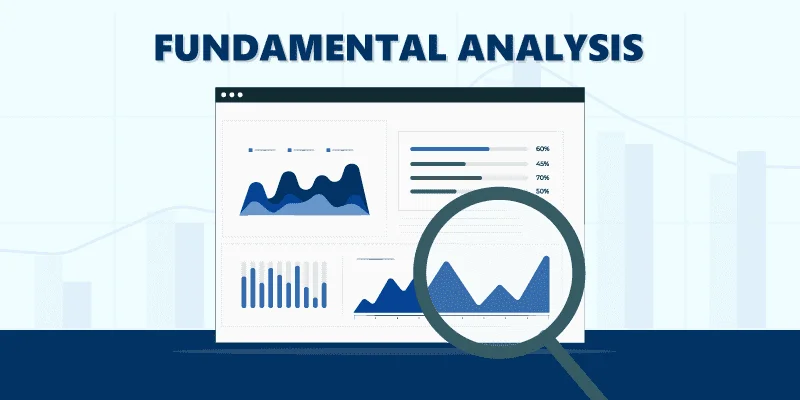
fundamental analysis is a holistic approach to understanding and studying a business.
Fundamental Analysis

Due to the potential for equities’ returns to outpace those of other conventional investment strategies, stock investing has grown to be a crucial component of most people’s portfolios. However, investing blindly in stocks without any prior knowledge or understanding of the markets is risky. The foundation for investing or trading on stock markets is stock analysis. Such analysis has both fundamental analysis and technical analysis components.

Although both are essential components of stocks, let’s focus on the fundamental analysis of stocks in this article and the information that goes with it.

What is the meaning of Fundamental Analysis?

The basic company profile and the company’s financials are analyzed in fundamental stock analysis. It entails a careful examination of a number of crucial ratios and comparisons of the company to its competitors and to businesses in its industry. The macroeconomic and microeconomic factors at play have an impact on a company’s performance and stock prices. Fundamental analysis entails the assessment and evaluation of all such elements influencing a company’s development and performance, which are thought to be reflected in the stock prices of that company.

It is a technique for determining an asset’s true market value. It accomplishes this by analyzing the variables that might affect the price in the future. Technical analysis contrasts with fundamental analysis. Technical analysis derives its data from charts, whereas fundamental analysis focuses on a company’s finances, outside factors, influences, and market trends. While the latter is frequently used for trading, the former is used for long-term investments.

Important of Fundamental Analysis?

The fair value of any stock can be calculated with the aid of fundamental analysis. It also assesses an organization’s performance and health using its financial data and key economic indicators. Understanding a company’s business model, the management’s methods of operation, and its strengths and weaknesses is also made possible with the aid of fundamental stock analysis. You can forecast price changes in the future and determine whether a stock is overvalued or undervalued.

To determine the company’s intrinsic value, fundamental analysis employs a variety of tools, including financial reports, earnings, and financial ratios like the PE Ratio, PB Ratio, Debt Equity Ratio, Return on Capital (ROC), Return on Equity (ROE), etc. The stock is deemed to be overvalued if the market price of the company is greater than its intrinsic value. On the other hand, a stock is said to be undervalued if its market price is less than its fair value per share. Investors have a good chance to profit by purchasing this stock because it will eventually increase in value.

Types of Fundamental Analysis

There are two types of fundamental analysis:-

  1. Quantitative analysis
  2. Quantitative analysis

Quantitative analysis:- As the name implies, qualitative analysis looks at a company’s qualitative factors, such as reputation, demand, consumer behavior, brand value, and company recognition in the larger market. Additionally, it aims to assess the management’s performance, the effect of their choices on the market, and their socioeconomic standing. Typically, qualitative analysis is viewed as being subjective.

Quantitative analysis:- The quantifiable attributes of a business are related to quantitative analysis. Financial statements are thus the main source of quantitative analysis. Data, statistics, and reports are the focus of quantitative analysis. In order to comprehend the company’s overall financial health and determine the share price, many financial ratios are taken into account, including statements, balance sheets, cash flows, debt, quarterly performance, and cash flows.

What are the steps in fundamental analysis?

The process of fundamental analysis consists of a number of different steps. The following lists some of the fundamental actions.

  1. Having a basic understanding of the business and its products
  2. examining the company’s financial reports and ratios
  3. reviewing the country’s debt and capital levels and evaluating the company’s financial viability
  4. keeping an eye on the company’s competition
  5. Analysis of the growth prospects and the necessary capital for those prospects
  6. periodically reviewing each parameter to assess the company’s performance in relation to its past.
  7. Depending on the goods and services provided by the company, an investor will also need to take into account general economic factors in the nation and around the world.

Difference between fundamental analysis and technical analysis

Technical analysis and fundamental analysis are very different from one another. Let’s examine how.

Points of differenceFundamental analysis Technical analysis
MeaningIt is a detailed examination of the factors that influence the industry, company, financial statements, competition, and more.It includes the examination of charts for making predictions on the share price. It is data-driven and used to understand the patterns in the share price of a stock.
FunctionInvestment-relatedTrading-related
Time-framelong-termshort-term
ObjectiveTo identify the true value of the stockTo identify the right time to enter or exit the market
Focuses onBoth past and present dataPast data only
Form of data usedFinancial statements, economic reports, news events, industry statistics, management processes, etc.Analysis of charts
MethodologyExamination of ongoing industry trends, economic outlook, competitor companies’ performance, and financial data.Examination of the market psychology as well as price movements.
Indicators Indicators used are expenses, revenues, assets, liabilities, debt-equity ratio, return on equity ratio, and so on.Indicators used are price data, RSI, MACD, simple moving average, etc.

What are the pros and cons of fundamental analysis?

The following lists some of the fundamental benefits and drawbacks of fundamental analysis:-

Pros of Fundamental Analysis

Below are some of the benefits of fundamental analysis.

  • Long-term investment decisions are based on fundamental analysis because it considers a company’s fundamental financial factors.
  • It assists in identifying high-quality stocks from those that might not endure over time.
  • Understanding macro and micro factors like the current economic situation, industry and competition analysis, etc. that affect the growth and performance of the company is made possible by fundamental analysis.
  • It assists in drawing attention to any flaws or wrongdoings by the business that may have an impact on its market position and ultimately have an effect on share prices.

Cons of Fundamental Analysis

Below is a list of fundamental analysis’s various drawbacks.

  • There are no short cuts to getting the detailed analysis to investors because fundamental analysis is a labor-intensive and complicated process.
  • It can be challenging for average investors to have a thorough understanding of the market, the industry, and the company data.
  • Fundamental analysis is based on hazard facts and ignores market sentiment or trends, which frequently influence stock prices.

FOR MORE INFO CLICK THIS SITE:https://learningsharks.in/

FOLLOW OUR PAGE:https://www.instagram.com/learningsharks/?hl=en

What is Secondary Market in Stock Market?

The secondary market is where investors buy and sell securities they already own.
secondary market in stock market

Introduction

The Secondary Market where previously issued financial instruments, such as stocks, bonds, and derivatives, are bought and sold by investors is referred to as the secondary market. It differs from the primary market, where new securities are first issued and offered for sale to the general public.

What is secondary Market?

A secondary market is a marketplace where investors can exchange company shares. It implies that stock transactions between investors are unrestricted and independent of the issuing company. The issuing company does not take part in income generation in these investor transactions; rather, the value of its shares is determined by how well it performs on the market. Thus, in this market, income is produced through the transfer of shares between investors.

Among the organizations that can be found in a secondary market are:-

  • Retail buyers
  • Advisory service providers, which include, among others, security dealers and commission brokers.
  • Financial intermediaries including non-banking financial companies, insurance companies, banks and mutual funds

KEY TAKEAWAYS

  • Investors trade with one another in secondary markets as opposed to the issuing entity.
  • The secondary market influences the price of securities toward their true value through a vast network of separate but connected trades.

Different Instruments in the Secondary Market 

Fixed income, variable income, and hybrid instruments are the types of instruments traded in a secondary market.

Fixed income instrument:-

A regular form of payment, such as interest, is guaranteed by fixed income instruments, and the principal is repaid at maturity. Debentures, bonds, and preference shares are a few examples of fixed income securities.

Debentures are unsecure, or not secured by collateral, debt instruments. Debenture returns are thus reliant on the credibility of the issuer.

Regarding bonds, they are essentially a contract between two parties that is issued by a government or business. As investors purchase these bonds, the issuing entity is able to obtain a sizable sum of money in this way. Investors receive interest payments at regular intervals, and at maturity, the principal is returned.

Dividends are paid to people who own preference shares in a company before they are paid to equity shareholders. Preference shareholders are entitled to payment prior to other shareholders in the event that a company files for bankruptcy.

Variable income instrument:-

The amount of the effective rate of return that the investor receives from investments in variable income instruments depends on a number of market factors. These investments expose investors to greater risks and greater rewards. Equity and derivatives are two examples of instruments with variable income.

Instruments that enable a business to raise capital include equity shares. Additionally, in the event of a company’s liquidation, equity shareholders have a claim to both the company’s assets and net profits.

Derivatives are a type of contract that involves payment for specified performance and involves two different parties.

Hybird instrument:-

Hybrid financial instruments are created by combining two or more different financial instruments. One type of hybrid instrument is convertible debentures.

Convertible debentures are available as loans or debt securities that, after a set time period, may be converted into equity shares.

Functions of Secondary Market

  • A stock exchange offers investors a platform for trading bonds, shares, debentures, and other financial instruments.
  • The market permits active trading, allowing for immediate purchase or sale with little price variation between different transactions. Transactions can be entered into at any time. Additionally, trading is continuous, increasing the liquidity of the assets traded on this market.
  • Investors locate a suitable venue, such as a regulated exchange, to sell their holdings. They can sell the securities they own on a variety of stock exchanges.A secondary market serves as a medium for deciding how much assets should be priced in a transaction in accordance with supply and demand. Investors can make informed decisions because the public has access to information about transaction prices.
  • It also provides a connection between savings and investment and is a good indicator of a country’s economic health. As in, investments made using securities are a means of utilizing savings.

Types of Secondary Market 

Stock exchanges and over-the-counter markets are the two main categories of secondary markets.

stock exchange:-

The trading of securities occurs on centralized stock exchanges without any interaction between the buyer or seller. Examples of such platforms include the National Stock Exchange (NSE) and the Bombay Stock Exchange (BSE).

Trading in securities is governed by strict regulations, which apply to stock exchange transactions. Since a stock exchange itself serves as a guarantee, there is essentially no counterparty risk. A higher transaction cost, in the form of commission and exchange fees, is imposed on investments to provide such a safety net.

Over-the-counter(OTC):-

Decentralized over-the-counter markets consist of participants trading among themselves. OTC markets still have higher counterparty risks because there is no regulatory oversight and everyone is dealing with each other directly. An example of an over-the-counter market is the foreign exchange market (FOREX).

There is fierce competition to acquire more volume in an OTC market. This causes the price of the securities to vary between sellers.

Other varieties of secondary markets, in addition to the stock exchange and OTC market, include the auction market and dealer market.

In essence, the former serves as a platform for buyers and sellers to agree on the price at which the securities will be traded. The bidding price of the offer is included in the pricing information that is made available to the general public.

Another kind of secondary market is the dealer market, where different dealers offer prices for particular securities in exchange for a transaction. Bonds and foreign exchange are primarily traded in a dealer market.

Advantages of Secondary Market

Transactions on the secondary market have a number of benefits for buyers, sellers, and the entire financial system. Some of the main benefits are as follows:

  • Liquidity

Investors have access to liquidity through the secondary market, which makes it simple for them to buy and sell previously issued securities. As a result, investors can more easily modify their portfolios in response to shifting market conditions and have quick access to cash if necessary.

  •  Price discovery

By enabling investors to trade securities in accordance with the supply and demand dynamics of the market, the secondary market facilitates price discovery. This makes it possible to guarantee that securities are fairly valued and that investors get a return on their investment.

  • Transparency

Transactions on the secondary market are frequently transparent, and investors can easily find out information about the securities, the issuers, and the trading volume. This makes it possible for investors to make well-informed decisions about their investments.

  • Risk transfer

By purchasing and selling securities, investors can transfer risk using the secondary market. A stock owner who is worried about a possible market decline, for instance, may sell their stock to another investor and transfer the risk to the new owner.

  • Capital raising

It can also make capital raising easier by enabling businesses to issue new securities to attract investors’ money. This can be accomplished through add-on or supplementary offerings.

  • Diversification

It offers a variety of investment opportunities, enabling investors to diversify their portfolios and possibly achieve higher returns.

Disadvantages of the Secondary Market

  • Volatilit

The prices of securities can change quickly on the secondary market as a result of shifting market conditions, investor sentiment, and other factors. Due to the uncertainty this can cause, it may be challenging for investors to estimate the value of their investments.

The secondary market is susceptible to price manipulation, including insider trading and other dishonest practices, which can hurt investors and cause price distortion.

  • Counterparty risk

Investors are exposed to counterparty risk, or the risk that the other party to the transaction won’t fulfill their obligations, in transactions on the secondary market. In over-the-counter (OTC) markets where there is no central clearinghouse to ensure trades, this can be especially problematic.

  • Access

Access for individual investors may be hampered by the possibility that some secondary markets are only open to specific types of investors, such as accredited or institutional ones.

  • Regulatory risk


Government agencies have the authority to regulate secondary market transactions, and any changes to these regulations may have an impact on how the market operates and how much a security is worth.

  • Price discrepancies

It’s possible that a security’s secondary market price does not always accurately reflect its intrinsic worth or future prospects, which can lead to misalignments and differences between market prices and underlying values.

FOR MORE INFO CLICK THIS SITE:https://learningsharks.in/

FOLLOW OUR PAGE:https://www.instagram.com/learningsharks/?hl=en
Adani Group announces assistance for the kids of victims of the Odisha train crash: Will support educational costs

According to Gautam Adani, it is everyone's duty to "give strength to the victims and their families and a better tomorrow to the children."
Odisha Train Accident

According to a statement made on Sunday by the conglomerate’s chairman Gautam Adani, the Adani Group will pay for the children of those who lost their parents in the tragic train accident in Balasore, Odisha. Adani tweeted, “We are all profoundly saddened by the Orissa train accident. We have decided that the Adani group will be in charge of paying for the innocent people whose parents died in this accident to attend school.

The chairman continued, “It is our shared responsibility to give the victims and their families strength and a better tomorrow for the kids.”

“The train accident in Odisha has caused great distress for all of us. The Adani group has made the decision to cover the cost of the innocent children whose parents died in this accident’s schooling, Adani tweeted in Hindi.

The Adani Group will fund the school education of those who have lost their parents in the tragic train accident in Odisha's Balasore
Gautam Adani’s Twitter post

Train Accident in Odisha

According to the Coromandel Express’s driver, he only proceeded on a loop line after receiving a green signal during the three-train collision in the Balasore district of Odisha. An empty goods train was parked on the loop line. The railways claimed that the driver was “not over-speeding” and that he had not skipped any signals, effectively absolving him of any responsibility for the train accident in Odisha that left 275 people dead and up to 1,175 injured.

Around 7 PM on Friday, a goods train and the Bengaluru-Howrah Superfast Express and Shalimar-Chennai Central Coromandel Express collided near the Bahanaga Bazar station in Balasore, which is located about 250 km south of Kolkata and 170 km north of Bhubaneswar.

The Prime Minister’s Office (PMO) has announced that the Prime Minister’s National Relief Fund (PMNRF) will make an ex-gratia payment of Rs 2 lakh to each deceased person’s next of kin in response to the tragic train accident in Odisha. The PMO also announced that Rahul Gandhi’s US gift of Rs 50,000 would be given to those who had been hurt in the accident.

Comments Regarding PM Modi,…

Ashwini Vaishnaw, the minister of the railways, also posted information about the victims’ and their families’ compensation on Twitter. His announcement states that the families of the deceased will receive compensation in the amount of Rs10 lakh. Individuals who suffered minor injuries are qualified for compensation of Rs 50,000, while those who sustained grievous injuries are eligible for compensation of Rs2 lakh.

According to his announcement, a compensation amount of Rs 10 lakh will be provided to the families of the deceased
Ashwini Vaishnaw’s Twitter

FOR MORE INFO CLICK THIS SITE:https://learningsharks.in/

FOLLOW OUR PAGE:https://www.instagram.com/learningsharks/?hl=en
Stock Market WhatApp Group Links of June 2023

WhatsApp group links for Stock Market for 2023
WhatsApp Group Links for Stock Market

What is WhatApp?

With just a Wi-Fi connection, WhatsApp is a free, cross-platform messaging programme that enables you to make video and voice conversations, send text messages, and more.

WhatsApp, which has over 2 billion active users, is particularly well-liked among friends and family who wish to stay in touch but live in different countries.

WhatsApp’s widespread acceptance is largely a result of its usability across platforms, accessibility, and clear, uncomplicated features.

Although WhatsApp may not be widely used in the US, it is a vital component of daily life in many other countries. Undoubtedly one of the most used messaging platforms worldwide is the Facebook-owned app.

Knowing that WhatsApp was one of the first mobile apps to provide free, internet-based chatting can help you understand why it is so popular. WhatsApp generally uses a Wi-Fi connection to send and receive messages and calls for free, as opposed to sending texts via cellular data networks, where costs may be involved.

Now, fast forward: Over 2 billion users use WhatsApp because it makes communicating easy regardless of device or location.

WhatsApp is not only easy to use, but it also provides significantly more capabilities and customizations than standard SMS messaging – all for free. If you’re already familiar with the app, our favourite WhatsApp tips and tricks might be of interest to you.

How does WhatsApp work?

WhatsApp’s key selling point is its ability to be used essentially for free for international calling and for sending and receiving calls and messages utilising only an internet connection. There are no sign-up costs, and there are no data plan limits to be concerned about.

Even while WhatsApp is similar to other messaging apps like iMessage and Messages by Google, it nevertheless has several distinct advantages, the most important of which is cross-platform compatibility (for example, between Android and iOS).

  • Phone and video calls: In addition to phone conversations, WhatsApp also provides video calls, which include a group feature that supports up to eight callers at once.
  • You can record audio messages and transmit them to individual or group chats.
  • WhatsApp uses end-to-end encryption, a secure communication protocol, so that only the parties involved in a message can see it.
  • Sharing photographs and videos: You can share films, photos, and GIFs without being concerned that they will be pixelated or not downloadable, as can occasionally happen when SMS messages are sent across various mobile platforms and cellular carriers.
  • Sharing materials: Without the burden of email or additional document-sharing apps, WhatsApp enables you to transfer various types of documents, including PDFs, spreadsheets, and slideshows.
  • Desktop accessibility: Both a Mac and a PC desktop version of WhatsApp are available.
  • WhatsApp Business: WhatsApp’s dedicated business account was created to allow business owners to communicate with their clients and exhibit their products on a user-friendly and simple platform.

Key differences between WhatsApp group and WhatsApp business 

Like any other WhatsApp group, the WhatsApp Business Group allows several members to be added and chat together. This feature functions like a chat room where all of the group’s members can share files and converse. Every member of the group can see every chat that takes place.

Private communications can be delivered to numerous recipients simultaneously using the WhatsApp Business Broadcast feature. You must set up a Broadcast group, which is akin to a WhatsApp group, where numerous persons can be added (without anybody knowing who else is in the group), and communications submitted to group members are received as private messages.

To have a better understanding of these two groups’ fundamental differences, let’s greater understanding.

1. Features

WhatsApp Group: interacting and conversing with many people at once. The group’s entire membership is able to converse and discuss with one another.

WhatsApp Business:sending a private message with a similar message to several persons at once. The subscribers to the broadcast list are unaware of the other subscribers.

2. People Limitation

WhatsApp Group: A WhatsApp group can only have a maximum of 256 members added. You will need to form another group if there are more participants.

WhatsApp Business: The number of individuals who can be added to a WhatsApp business broadcast is unrestricted.

3. Message Sender

WhatsApp Group: Any group member in a WhatsApp group can send a message to the group, and all other group members can see such messages.

Although there is a setting that only allows the administrator to send messages

WhatsApp Business: Messages can only be sent by the person who created the broadcast list. These messages are transmitted as one-to-one chats, and if a response is sent, it will show up in that person’s chat window.

4. Message receiver

WhatsApp Group: The messages sent to a WhatsApp group will be seen by everyone who has been joined to it. Whether or not a member is saved to your address book, they can still view everything in the group.

WhatsApp Business: These messages can only be read by the contacts listed in your address book; anyone else won’t see them. WhatsApp won’t let you know whether a receiver has added or removed you from their address book. However, you can verify your delivery list to make sure some persons are not receiving your messages.

5. Chat History

WhatsApp Group: The messages in a WhatsApp group are not automatically preserved, but you can star any message that you want to keep.

WhatsApp Business: The WhatsApp list’s broadcast group messages are automatically saved as one-to-one conversation history.

6. Feature Using Occasion

WhatsApp Group: A WhatsApp group is the finest choice when a group conversation is required. Multiple users can interact, discuss, and exchange experiences with other members using this function. All of the members of a WhatsApp group have access to all messages and media files shared in the group.

WhatsApp Business: The greatest time to use a WhatsApp business broadcast list is when you need to distribute files, notices, and essential information to a large group of people. Since there is a great likelihood that crucial information would get lost among several group communications, a broadcast list is the most effective. Furthermore, broadcast message WhstaApp works best when you don’t want the group’s members to know who the other group members are.

7. Participants Reply

WhatsApp Group: Any member of a WhatsApp group can reply, and it is accessible to and received by all group members. These notifications show up directly in the group window.

WhatsApp Business: Private chat is how the messages from a broadcast list are delivered. All list members receive all messages in their individual chat windows, and any replies also show up there.

Advantages of WhatsApp Group and WhatsApp Business

WhatsApp Group: Using a WhatsApp group, you can have a discussion involving the ideas, thoughts, and viewpoints of many different people. It is possible to send information to numerous recipients at once.

WhatsApp Business: There is a good probability that among hundreds of communications, some persons will miss or lose critical information. As messages are delivered directly to the recipient conversation in this case, broadcast list proves to be the ideal choice. Additionally, the broadcast list is the ideal tool when you don’t want to show who is in a group. Creating a personal connection with the recipient, improved one-on-one communication, serving as a fantastic marketing tool, and more are just a few additional advantages of employing the function.

Stock Market WhatsApp Group Links for June, 2023

Bull TraderClick to Join Group
NSE & MCX APR-18Click to Join Group
StockClick to Join Group
EQUITY AND MCX INTRADAYClick to Join Group
Zerodha new a/c openingClick to Join Group
Earn money groupClick to Join Group
Stock Cra ker 2Click to Join Group
200% తెలుగుgenuine stocksClick to Join Group
SHARE MARKET EARNINGSClick to Join Group
MCX & EQUITYClick to Join Group
UAE Buy and SellClick to Join Group
An intraday Trading ideaClick to Join Group
Blockchain Community IndiaClick to Join Group
MONEYClick to Join Group
STOCK ROLLERS -783Click to Join Group
Best BuyClick to Join Group
Stock MarketClick to Join Group
Trading PassionClick to Join Group
SharmaStocksClick to Join Group
MCX ExpertClick to Join Group
Investment GuruClick to Join Group
CRUDE ExpertClick to Join Group
Free Forex SignalsClick to Join Group
Group11 Stock MarketClick to Join Group
BrainStorm CommunityClick to Join Group
Daily StonksClick to Join Group
PFTSharing GroupClick to Join Group
EQUITY & FUTURES EXPERTClick to Join Group
Zerodha AccountsClick to Join Group
Nifty OptionsClick to Join Group
RAJ FINANCIALSClick to Join Group
DEMO BANK NIFTY 3DAYSClick to Join Group
ALPHA FOREXClick to Join Group
Forex mentorshipClick to Join Group
TRADER’S SPOTClick to Join Group
BrainStorm CommunityClick to Join Group
Group11 Stock MarketClick to Join Group
Sensex_BankniftyClick to Join Group
Loss recoverClick to Join Group
Option trading nightClick to Join Group
AdsexchangClick to Join Group
Stock Future Positional CallClick to Join Group
GromoClick to Join Group
Stock Market SchoolClick to Join Group
Learn Financial MarketClick to Join Group
The index pointsClick to Join Group
Stock Market TipsClick to Join Group
My StocksClick to Join Group
Stock Market earnClick to Join Group
AdsexchangClick to Join Group
Bank nifty and niftyClick to Join Group
The Stock Bull 2Click to Join Group

FOLLOW OUR WEBSITE FOR MORE INFORMATION: https://learningsharks.in/

FOLLOW OUR PAGE : https://www.instagram.com/learningsharks/

What is National Stock Exchange (NSE)?

 National Stock Exchange of India Limited is largest financial market in India and the fourth-largest market in terms of trading
National Stock Exchange of India Limited (NSE)

The largest financial market in India is the National Stock Exchange of India Limited (NSE). The NSE, which was founded in 1992 and is now a sophisticated electronic market that ranks fourth globally in terms of equity trading volume, has grown since its incorporation. The wholesale debt market was introduced in 1994, and shortly after that, a cash market segment.

Additionally, it was the first stock exchange in the nation to introduce electronic trading capabilities, which made it easier to unite investors from all over the nation under one roof.

On the list of the largest stock exchanges in the world as of April 11, 2023, the NSE’s total market capitalization was approximately USD 3.26 trillion, placing it in ninth place.

However in India, this sector only accounts for 12–14% of the country’s overall GDP, in contrast to the USA, where trading from the corporate sector accounts for about 70% of the country’s GDP. 4000 of the approximately 7800 listed companies in this entire corporate sector trade on Indian stock exchanges. Thus, only 4% of the nation’s GDP is attributable to stock market trading.

KEY TAKEAWAYS

  • The largest financial market in India and the fourth-largest market in terms of trading volume is the National Stock Exchange of India Limited (NSE).
  • The first exchange in India to offer contemporary, fully automated electronic trading was the National Stock Exchange of India Limited.
  • In India, the NSE is the biggest private wide-area network.
  • The NSE was the first electronic limit order book to trade derivatives and ETFs, making it a pioneer in the Indian financial markets.

Functions of NSE

The NSE was created with the express purpose of carrying out the following duties:

  • Establishing a national trading platform for debt, hybrid, and equity instruments.
  • Granting fair access to investors nationwide via a strong communication network.
  • Investors have access to a fair, effective, and transparent securities market when using electronic trading systems.
  • Enabling book entry settlement systems, quicker settlement cycles, and compliance with current global securities market standards.

How Does NSE Stock Exchange Work?

An electronic limit order book is used for trading on this Indian stock exchange, and a trading computer executes order matching. Orders are the only thing driving this entire process; neither experts nor market makers are involved.

A limit order is automatically matched with a market order when investors place one. As a result, both buyers and sellers in this market can remain anonymous.

A market that is driven by orders also gives investors greater transparency because all buy and sell orders are displayed in the trading system. These orders are placed on the NSE through stockbrokers, who frequently offer their clients an online trading platform.

Few institutional investors can place their orders directly into the trading system using this “direct market access” facility.

The equities segment of the NSE market is open for trading every day of the week, barring Saturdays, Sundays, and other holidays declared by the stock exchange. Following is the timing:

Pre opening Session:-

  1. Order entry opens at 9.00 hours
  2. Order entry closes at 9.08 hours

Regular Session:-

  1. The market opens at 9.15 hours
  2. The market closes at 15.30 hours

The Nifty50, which represents about 63% of the total market capitalization listed under it, is the NSE’s flagship index. This index includes 50 variable stocks and roughly 12 economic sectors.

Currently, Vikram Limaye serves as the CEO and Managing Director of the stock exchange, and Ashok Chawla serves as the Chairman of the Board of Directors.

Benefits of the NSE

The National Stock Exchange is a top venue for businesses getting ready to list on a significant exchange. Greater transparency in trade matching and the settlement process is encouraged by the sheer volume of trading activity and the use of automated systems.

This alone may increase market visibility and bolster investor confidence. Utilizing cutting-edge technology also makes it possible for orders to be filled more quickly, increasing liquidity and ensuring accurate pricing.


FOR MORE INFO CLICK THIS SITE:https://learningsharks.in/

FOLLOW OUR PAGE:https://www.instagram.com/learningsharks/?hl=en
What is Bombay Stock Exchange (BSE)?

Bombay Stock Exchange is the oldest stock exchange in India as well as Asia.
Bombay stock market (BSE)

The first and biggest stock market in India, the Bombay Stock Exchange (BSE), was founded in 1875 as the Native Share and Stock Brokers’ Association. Along with the New York Stock Exchange (NYSE), Nasdaq, London Stock Exchange Group, Japan Exchange Group, and Shanghai Stock Exchange, the BSE, which is based in Mumbai, India, is one of the largest exchanges in the world and lists nearly 6,000 companies.

The BSE has contributed to the growth of the Indian corporate sector and to the development of India’s capital markets, including the retail debt market. The BSE, the first stock exchange in Asia, offers a platform for small-and-medium-sized businesses (SME) to trade stocks. BSE has expanded its offerings to include clearing, settlement, and risk management services for the capital markets.

KEY TAKEAWAYS

  • The Bombay Stock Exchange (BSE), the first exchange in Asia and the biggest stock market in India, was founded in 1875 as the Native Share and Stock Brokers’ Association.
  • By offering an effective platform for the Indian corporate sector to raise investment capital, the BSE has contributed significantly to the growth of India’s capital markets
  • The BSE is renowned for its quick and effective trade execution provided by its electronic trading system.
  • Investors can trade in equities, foreign exchange, debt instruments, derivatives, and mutual funds on the BSE.
  • Other significant capital market trading services are also offered by the BSE, including risk management, clearing, settlement, and investor education.

How the Bombay Stock Exchange (BSE) Works?

The BSE transitioned from an open-floor trading system to an electronic trading system in 1995. The New York Stock Exchange (NYSE) and Nasdaq are the two most well-known of the more than a dozen electronic exchanges that exist in the United States alone.

Because they provide fewer errors, quicker execution, and greater efficiency than conventional open-outcry trading systems, electronic trading systems currently dominate the financial industry as a whole. Stocks, stock futures, stock options, index futures, index options, and weekly options are among the securities that the BSE lists.

The Sensex, a benchmark index of 30 of the BSE’s largest and most actively traded stocks covering 12 sectors, serves as a gauge for the BSE’s overall performance. The Sensex is India’s oldest stock index, having debuted in 1986. The index, which is also known as “BSE 30,” broadly depicts the make-up of the entire Indian market.

What Are The Various Investment Methods?

Depending on the volume of transactions made, trading in the securities of a company listed on the Bombay Stock Exchange can be done directly or indirectly. Only institutional investors and registered brokerage firms are permitted to conduct primary trading on the BSE.

Retail customers, on the other hand, are not permitted to use direct investment plans and must instead conduct their transactions through a licensed stockbroker or stock trading website. A secondary trading mechanism, governed by the Financial Industry Regulatory Authority (FINRA), is what this is known as. An individual must have a Demat account, through which financial transactions are made, in order to engage in secondary trading. Through the account itself, one can effectively become the owner of every stock.

What is Bombay Stock Exchange’s Role?

The Bombay Stock Exchange (BSE) is a significant tenet of the Indian stock market and a significant player in the economy. It provides a platform for businesses to raise money by selling shares to the public and enables investors to buy and sell those shares. This makes it easier to mobilize capital and directs it toward profitable projects that might encourage economic growth. The BSE’s Sensex, widely regarded as the barometer of the Indian stock market, is comprised of the 30 largest and most popular companies listed on the exchange. The SENSEX is closely watched by economists, investors, and decision-makers as a gauge of the health of the Indian economy as a whole.

In order to reflect market capitalization and sector performance, the BSE also provides a number of indexes, including the BSE 100, BSE 200, BSE 500, BSE Small-cap, and BSE Mid-cap, among others. As a result, investors can choose investments based on their level of risk tolerance. BSE also provides a number of additional services, such as trading, clearing, settlement, and depository services, for the smooth operation of the Indian stock market. BSE is a significant economic institution in India because it promotes economic growth by acting as a vital link between companies and investors.

Note:– The BSE has helped to develop India’s capital markets, particularly the retail debt market, as well as the country’s business sector. Small and medium-sized businesses (SMEs) can trade stocks on the BSE, the first stock exchange in Asia, which also offers a platform for doing so. Clearing, settlement, and risk management services for the capital markets are now part of BSE’s expanded menu of services. Tracking market fluctuations in a given economy is made simple by the performance of that economy’s benchmark index, which has a significant impact on the capital markets of nations around the world.

How does BSE function?

The Bombay Stock Exchange (BSE) serves as a regulated market for the trading and settlement of securities. The exchange serves as a middleman, providing a trading platform for both buyers and sellers of securities. The BSE operates as follows, generally speaking.

  • If a business plans to raise capital by selling shares to the public, it may submit an application to list on the BSE. Once the company is listed on the exchange, shares can be bought and sold there.
  • Buyers and sellers place orders to buy and sell shares at specific prices using the bid-ask method o
  • The BSE also creates and publishes a number of indices to reflect market capitalization and the performance of various sectors. The most well-known index is the SENSEX, which consists of the 30 largest and most active companies listed on the exchange.
  • The BSE also provides depository services, which facilitate online share trading, electronic trade settlement, and the ability for shareholders to hold their shares in electronic form (a process known as dematerialization, or Demat)

The BSE serves as a centralized market for buying and selling securities, providing investors with a variety of investment options, making it easier for businesses to raise capital, and ensuring the efficient operation of the Indian stock market.

FOR MORE INFO CLICK THIS SITE:https://learningsharks.in/

FOLLOW OUR PAGE:https://www.instagram.com/learningsharks/?hl=en