Learning sharks-Share Market Institute


Rajouri Garden  8595071711 7982037049  Noida 8920210950 , and  Paschim Vihar  7827445731  

Fee revision notice effective 1st Jan 2026; No change for students enrolled before 15th Jan 2026

Download “Key features of Budget 2024-2025here

How do Short Selling and Day Trading work?

The trader sells the borrowed shares at the current market price, even though they don't own them.
Short selling

Both short selling and day trading are unique stock market methods intended to capitalise on price changes, but they take different approaches and carry different risks.

Short Selling: Using the short selling trading strategy, investors can gain from a falling stock price. This is how it goes:

  • Taking out a Share Loan: A trader takes out a share loan from a brokerage or another investor. The stock that was borrowed is then offered for sale publicly.
  • Selling the Borrowed Shares: Despite not owning the shares, the trader sells the borrowed shares at the going market rate.
  • Waiting for a Price Drop: The objective of the short seller is to eventually repurchase the same number of borrowed shares at a lower price. They can repurchase the shares at a reduced price if the stock price falls.
  • Returning the Borrowed Shares: The trader returns the shares to the lender (often the brokerage) after purchasing them back. The profit is the difference between the sale price and the repurchase price, less any charges or interest.

Key points to consider:

  • If the stock price drastically increases, short selling exposes you to limitless potential losses because you are selling something you do not own.
  • The cost of the trade may increase if traders are required to pay interest on the borrowed shares.
  • Experienced traders who think a stock is overvalued or anticipate it to decrease in price typically practise short selling.
Day traders often make multiple trades throughout the day, capitalizing on small price fluctuations.
Day Trading

Day trading is a method where investors buy and sell financial products during the same trading day in an effort to capitalise on swift price changes. This is how it goes:

  • Frequent Trading: Day traders place numerous trades throughout the course of the day in an effort to profit from slight price swings.
  • Leverage: To enhance their holdings, some day traders employ leverage (loan money), which can multiply both gains and losses.
  • No Overnight Positions: Day traders refrain from keeping positions open overnight in order to reduce the possibility of price gaps between trading days.
  • Technical Analysis: To find suitable entry and exit points for their transactions, day traders frequently employ technical analysis tools, such as charts and indicators.
  • Effective risk management is essential for day traders to reduce possible losses. They frequently place stop-loss orders to automatically close a deal if it moves in the opposite direction by a specific amount.

Key points to consider:

  • Since traders must make quick judgements throughout the trading day, day trading necessitates a large amount of time, focus, and discipline.
  • If not carried out with a carefully considered approach, it can be extremely dangerous and speculative with the potential for significant losses.
  • Deep knowledge of market patterns, technical analysis, and risk management are frequently characteristics of successful day traders.

In conclusion, day trading entails making numerous trades within the same day to profit from short-term price swings, as opposed to short selling, which involves betting on a stock’s price to decline by borrowing and selling shares. Both approaches can be successful, but each has its own hazards and demands careful preparation and implementation.

FOR MORE INFO CLICK THIS SITE:https://learningsharks.in/

FOLLOW OUR PAGE:https://www.instagram.com/learningsharks/?hl=en

6 Best Mutual Fund Apps In India 2023

Best Mutual Fund Apps In India: As we all know, purchasing mutual funds is one of the most effective strategies to increase the value of our investments over the long run. And these days, following, managing, and investing in various mutual fund schemes is much faster and simpler thanks to some of the top mutual fund applications available in India. Additionally, you can complete all of these tasks with a single app.

There are numerous mobile apps for these mutual fund investments in the Google Play Store, giving you the convenience of purchasing and selling on the tip of your fingers, whether you’re interested in investing in normal funds or direct mutual funds. Additionally, if you intend to invest in direct funds using these applications, they may be able to assist you in avoiding an additional commission of 1% to 1.5%, which is a significant benefit.

What are Direct Mutual Funds?

You can invest cheaply and directly in a Mutual Fund AMC’s plan through a Direct plan. The direct plans are less expensive than the normal plans since you will spend less money on commissions for middlemen. When comparing the two plans, the return difference appears to be as low as 0.25% and as high as 1%.

These discrepancies have substantial long-term effects. It is so abundantly clear that you should always choose to invest in Mutual Funds’ Direct Plans.

6 Best Mutual Fund Apps for Direct Investment:

We have hand-picked six of the top mutual fund applications in India for direct investment out of the hundreds of mutual fund investment apps offered on the Google Play store. The best mutual fund apps for Indian investors are listed below:

Best Mutual Fund Apps #1 – Groww

One of the mutual fund industry’s fastest-growing apps in India is called Groww. And the sleek user-interface deserves the praise. With little to no paperwork and no hassles, this app makes it easy to invest in mutual funds for free. A single investment app contains all information on mutual funds. Groww allows anybody to invest in direct mutual funds with $0 commission and offers an additional discount of up to 1.5%+ in comparison to standard plans, much as the applications mentioned above in this post.

Key features include:

  • Simple construction, ideal for both novices and professionals
  • An investing dashboard that displays annualised returns and total returns
  • Top mutual funds list for many categories with the most recent financial information

Total Downloads: +10 Million
Rating on Google Play store: 4.3 out of 5 with a total of 3,50,672 ratings.

Here is the direct link to the app on play store.

Best Mutual Fund Apps #2 – ETMONEY Mutual Fund App

A team of dedicated entrepreneurs, IITians, and designers with extensive experience in technology, mobile, and financial services launched ETMONEY. This Mutual Fund app, which is affiliated with the well-known Economic Times brand, is a one-stop shop for everything related to investing. It can be used to track and manage spending using an expense manager, invest in mutual funds through SIP or Lumpsum, save tax with SIPs in ELSS mutual funds, and more.

Total Downloads: +5 Million
Rating on Google Play store: 4.5 out of 5 with a total of 1,22,341 ratings.

Here is the direct link to the app on play store.

Best Mutual Fund Apps #3 – myCAMS Mutual Fund App

A single gateway to invest in several Mutual Funds schemes is myCAMS. The app enables quicker, simpler, and more intelligent ways to transact with direct money.

MyCAMS provides many features, including mobile PIN and Pattern login, one view of your mutual fund portfolio, the ability to open new folios, make purchases, redeem investments, swap investments, set up SIPs, and more. One of the top apps for mutual funds, it also aids in the scheduling of transactions, enabling investors to plan out future Mutual Fund transactions.

Total Downloads: +1 Million
Rating on Google Play store: 4.3 out of 5 with a total of 73,805 ratings.

Here is the direct link to the app on play store.

Best Mutual Fund Apps #4 – KFinKart – Investor Mutual Funds

This app’s main goal is to make the customer’s experience with mutual funds simpler. It is a one-touch login software that gives you the ability to invest in a variety of mutual funds and offers a unique way to do so. It also emphasises using a single app from all fund firms to manage your profile, make decisions, and transact instantaneously while managing your investments.

The uniqueness of this software is that it allows you to link and follow your family folios across AMCs, invest in NFOs, transact or reinvest, start or stop SIPs, and more to make the most of your time and money.

Total Downloads: +1 Million
Rating on Google Play Store: 4.3 out of 5 with a total of 42,253 ratings.

Here is the direct link to the app on play store.

Best Mutual Fund Apps #5 – Zerodha Coin

In my opinion, one of the greatest apps for direct mutual fund investing is Zerodha Coin. Over 3,000 commission-free direct mutual funds from 34 fund houses are available through their investment services. When compared to traditional mutual funds, this can help with savings of up to 1–1.5% more annually. Zerodha Coin has already established a significant brand and clientele with over 1,50,000 investors who have spent over 2500 crores and together saved over 30 crores in commissions.

Key features of the app include:

  • Over 3,000 commission-free direct mutual funds are available through 34 AMCs for you to search, filter, and buy.
  • absolute returns, annualised (XIRR), P&L visualisations, and a single capital gain statement.
  • Mutual funds can be more easily used as collateral for loans against securities because they are kept in Demat form.

Total Downloads: +1 Million
Rating on Google Play store: 4.0 out of 5 with a total of 14,996 ratings.

Here is the direct link to the app on play store.

Best Mutual Fund Apps #6 – PayTM Money Mutual Funds App

By investing in Direct Plans of Mutual Fund Schemes with no commissions or other fees on purchasing and selling of direct mutual fund plans, Paytm Money, provided by the Paytm group, is emerging as one of the most reliable platforms in India.

The consumer can choose between converting from Regular to Direct Plans, fully Transparent Tracking, Data Privacy & Protection, tracking, managing, and automating SIP Investments, among other features.

Total Downloads: +10 Million
Rating on Google Play Store: 3.8 out of 5 with a total of 1,02,148 ratings.

Here is the direct link to the app on the play store.

FOR MORE INFO CLICK THIS SITE:https://learningsharks.in/

FOLLOW OUR PAGE:https://www.instagram.com/learningsharks/?hl=en

What is Market-Based Corporate Governance System ?

A market-based corporate governance structure depends on investors to have sway over the company’s management. It outlines the duties of each member of the organization, including shareholders, the board of directors, management, staff, and customers.

Shares of PNB Housing Finance Ltd rose sharply in Monday's trade to hit their one-year high level after the company posted strong results for the June 2023 quarter (Q1 FY24).

Understanding Market-Based Corporate Governance Systems

Common law serves as the foundation for a system of market-based corporate governance. It is one of many corporate governance models that have emerged globally. Investors have the largest influence over business policies because markets are the main source of cash. The system therefore depends on financial markets to have an impact on company management.

Corporate governance refers to the management and shareholder relations practices of publicly traded companies. The Organization for Economic Co-operation and Development (OECD) lists building market and business confidence in specific firms as one of the primary objectives of corporate governance.As a result, their capacity to employ resources for long-term, profitable investments is maximized.

A company’s board of directors’ independence, workplace diversity, and difficulties with concentrated ownership are all covered by corporate governance. Transparency in the public disclosure of information relevant to shareholders and the investing public is one of the core foundations of efficient corporate governance.

One strategy for guaranteeing effective shareholder protections and business compliance with laws is market-based corporate governance. Examples of market-based corporate governance systems without mandatory national governance regulations include the United States and India. They depend on securities rules and regulations instead.A “comply or explain” system, in which businesses must follow state- or market-exchange-developed governance norms, is the global trend in governance.

Benefits of Market-Based Corporate Governance Systems

The capacity of a market-based corporate governance system to adapt quickly to changes is by far its greatest benefit. Corporate management reacts in the short term to shifts in the stock’s market value. A company’s stock price will drop if there is a problem with its product, investors will become angry, and management will typically try to rectify the problem. If the business cannot effectively solve the issue, competitor companies will gain market share in a competitive market. Political concerns, on the other hand, typically take years or even decades to resolve.

In the long run, it is considerably simpler for new business practices to be formed under a market-based governance system because of its dynamism.For instance, some investors think businesses should concentrate on raising dividends for shareholders. Warren Buffett, the CEO of Berkshire Hathaway, rose to prominence as one of history’s greatest investors in part because of his pursuit of this dividend growth strategy.Others, however, think that the goal should be to increase investor money.

Jeff Bezos, the founder of Amazon, rose to become one of the richest men in the world by putting his attention on capital growth rather than conventional objectives like earnings and dividends. Bezos is the richest person in the world as of May 2022.In a system of market-based governance, many measurements and methodologies are permitted to compete.

Every time a single norm is imposed from the outside, it invariably restricts innovation and competition. Companies like Amazon would not be conceivable if rules required all businesses to pay out ever-increasing dividends. Delays to new technologies could last for several years. On the other hand, cutting dividends would cut off reliable sources of income for cautious investors.

Making the best investments would also be more difficult without dividends because it would be harder to assess the performance of well-known companies. The flexibility of market-based governance systems enables the most effective strategies to prevail over time.

Criticisms of Market-Based Corporate Governance Systems

According to governance experts, a propensity for short-termism is one of the most important problems in a market-based corporate governance structure. Targets for quarterly earnings established by sell-side analysts on Wall Street are handled by public companies. Companies can use a variety of accounting techniques to routinely meet or exceed Wall Street estimates, which will increase the value of their shares.

A quarterly earnings shortfall, however, might result in a dramatic drop in the stock price and send management of the company looking for a quick fix. Governance specialists advise doing away with profit forecasts as a method to encourage a long-term perspective on a company’s objectives and offer businesses more time to achieve them.

Another criticism of market-based governance is that it is being undermined by index funds. While index funds save fees for investors, their approach is passive by design. Index funds are the largest shareholders of many publicly traded companies, and they almost always vote with management. The passive acceptance of management plans undermines accountability in a market-based governance system.

FOR MORE INFO CLICK THIS SITE:https://learningsharks.in/

FOLLOW OUR PAGE:https://www.instagram.com/learningsharks/?hl=en

FacebookTwitterEmailWhatsAppTelegramShare

Best Stock Market Telegram Channel Link (Sept 2023)

Best Telegram Link for Stock Market 2023: A stock market, also referred to as the share market, is a location where capital is invested in an effort to generate large sums of money. Shares with various company names are listed on a stock market.

When you first begin investing in the stock market, especially if you do so without knowledge, you might find it challenging. You then run the risk of losing your money. You can invest and earn a lot of money by using the best free platform for learning about and mastering the stock market that we have developed.

We distributed the most comprehensive list of stock market Telegram channels and Group links in 2023. Through a Telegram channel, we discovered these groups from all over the world. You can now choose your preferred stock market Telegram channel from the list below. Additionally, if you develop into the foremost authority in this area, you’ll be able to easily analyze the stock market and earn a fortune.

Channel NameJoin Link
TRADEVIX123 (Nifty & Banknifty)Join Link
MemeCoin Whale PumpsJoin Link
Join Our Earning GroupJoin Link
Stock XpertJoin Link
Stock Pro OfficalJoin Link
Trade on DataJoin Link
Usha’s AnalysisJoin Link
Profit Daily BasisJoin Link
Tech AnalysisJoin Link
Bank Nifty SpecialsJoin Link
Stock Market NinjasJoin Link
Stock Market Ninjas ProJoin Link
Nifty F&O TradersJoin Link
Earn EverydayJoin Link
Nrj Finance OfficialsJoin Link
Stock Market Learning CourseJoin Link
Vijay Wealth ProviderStockJoin Link
Digital Marketing TelegramPost Link
Channel NameJoin Link
Indian Stock MarketingJoin Link
Vivek Stock InvestmentJoin Link
Stock market moneyJoin Link
Learngram Stock AnalystJoin Link
Indian Stock Market UpdateJoin Link
Indian Stock Market GroupJoin Link
Intraday BankNifty OptionsJoin Link
Stock Market Latest NewsJoin Link
News Telegram LinkPost Link
Channel NameJoin Link
Nifty F&O Traders OfficialJoin Link
Stock Trading & InvestingJoin Link
Investing TreeJoin Link
Safe TradersJoin Link
Intraday Cash CallsJoin Link
Banknifty MastersJoin Link
Banknifty & Nifty LearnJoin Link
Crypto CurrencyPost Link
Channel NameJoin Link
Stock Market News LiveJoin Link
Stock Result Breaking NewsJoin Link
Today Stock Market NewsJoin Link
India Market News StockJoin Link
Market News Stock BusinessJoin Link
Stock Market SignalsJoin Link
News Telegram LinkPost Link

FOR MORE INFO CLICK THIS SITE:https://learningsharks.in/

FOLLOW OUR PAGE:https://www.instagram.com/learningsharks/?hl=en

What is Sale in Stock Market ?

What Is a Sale?

A sale is a deal involving two or more people when tangible or intangible commodities, services, or assets are exchanged for cash. A seller may occasionally receive assets in addition to money.

In the financial markets, a sale can also be defined as an agreement between a buyer and a seller specifying the purchase price and delivery details of a financial security.

A sale is essentially a contract between a seller of a certain good or service and a buyer who is willing to pay for that good or service, regardless of the environment.

How a Sale Works

When a seller of products or services transfers ownership and title to a buyer in exchange for a defined sum of money or other specified assets, the transaction is referred to as a sale. Both the buyer and the seller must concur on the exact conditions of the deal in order for the sale to go through. These conditions may include the selling price, the amount of the item, the mode of delivery, and the time of delivery.

It is essential that the good or service being supplied can be traded. To transfer the good or service to the customer, the seller must be legally able to do so.

In particular from an income tax standpoint, a transaction is more likely to be classified as a gift or donation if one person delivers a good or service to another without obtaining anything in return.

Millions of people participate in innumerable sales transactions every day all across the world. The foundation of all economies around the world is formed by this continuous flow of assets.

Types of Sales

  • One typical type of sales transaction is the sale of products and services in a retail setting. This kind of transaction may involve a local establishment like a grocery shop or a laundromat. A large-format retailer or a theater could be the location.

  • Financial services companies’ sales of investment goods are thought to include more intricate value exchanges. Both online and offline venues are acceptable for them.

  • A sale can also take place between two people. During a yard sale, for instance.

  • The purchase of a vehicle from a car dealership is another illustration of a more difficult sales transaction involving products of considerable worth.

  • Additionally, sales can be conducted between businesses.

Ways to Pay

People who query “What is a sale?” may also be interested in the methods of payment. The three primary methods for making the payment of money necessary in a sales transaction are generally used.

  • At the moment of a sales transaction, a person or company has the right to demand actual cash from the buyer. The customer is subsequently given the good or service.

  • It’s possible for buyers to pay with credit. In other words, payment is paid by the buyer after the sale. In these situations, the product is typically still displayed to the customer at the time of the sale.

  • Before receiving the real goods or service, buyers may make an advance payment for a good or service. An illustration of paying in advance for a good or service is a magazine subscription.

Example of a Sale

When a person buys their first house, a sale happens when the closing papers are signed, the money is transferred, and the new owner receives the keys.

There are, however, a number of elements to such a sale that come before and after the actual, formal exchange of money for property. These involve the prospective buyer’s first interactions with a real estate agent and their meeting with a representative of a lending institution to apply for mortgage financing.

A first sale process may lead to more sales. For instance, the lending company may decide to sell a home loan it issued to the buyer to another person as an investment. In addition, an investment manager could trade mortgage-backed securities, which are collections of mortgages, and other forms of debt financing to undertake sales.

What Are the Basic Elements of a Sale?

The request by a customer to purchase an item of interest from a seller may be one of the elements of a sale. The buyer could receive information from the vendor regarding the product, such as the price, quality, any warranties, and the return policy. The conditions of the sale could then be agreed upon between the buyer and seller. The vendor would next specify the total sum of money needed to complete the transaction. After making payment and claiming ownership of the item, the buyer.

When Is a Sale Complete?

When the agreed-upon money for an item is supplied by a buyer, acknowledged by a seller, and the item is delivered to the buyer, the sale is typically deemed to be complete.

Can a Sale Involve Something Other Than an Exchange of Goods?

Yes, a sale can also refer to the price decrease made by a seller to certain goods or services in order to increase the financial appeal of those items or services to potential customers.

Conclusion

A sale is the exchange of ownership and title for money between two parties, according to the Merriam-Webster dictionary.

Every day, millions of sales occur. The numerous different kinds of sales transactions promote both consumers’ and enterprises’ financial well-being. Sales are the lifeblood of economies and states everywhere in the world. They serve as the cornerstone of prosperous commerce.

FOR MORE INFO CLICK THIS SITE:https://learningsharks.in/

FOLLOW OUR PAGE:https://www.instagram.com/learningsharks/?hl=en

FacebookTwitterEmailWhatsAppTelegramShare

7 Best Stock Market Apps

India’s top stock market apps: Today, it’s imperative to stay current with the minute market fluctuations if you work as a stock market trader. The current stock market traders monitor the ups and downs of the equities regularly, and occasionally even hourly.

The simple, quick, and efficient existence of traders has been made possible by high-speed internet and useful smartphone apps. The traders can always be updated and prepared thanks to these financial apps.

Everything is now available from your smartphone or tablet, including checking the stock’s real-time streaming market price, creating a virtual portfolio, creating stock charts, watching market trends, and tracking your portfolio.

In order to make your stock research in India easier, we are going to introduce to you the 7 Best Stock Market Apps today. Furthermore, every programme on this list is free. Be with us for the next 5-8 minutes to learn about the top stock market applications for Indian stock research, to put it briefly.

7 Best Stock Market Apps in India

Best Stock Market Apps #1 – MoneyControl

Play store rating: 4.1/5 Stars (360k Reviews)
Downloads: +10 Million
Available on: Android, iOS, Windows

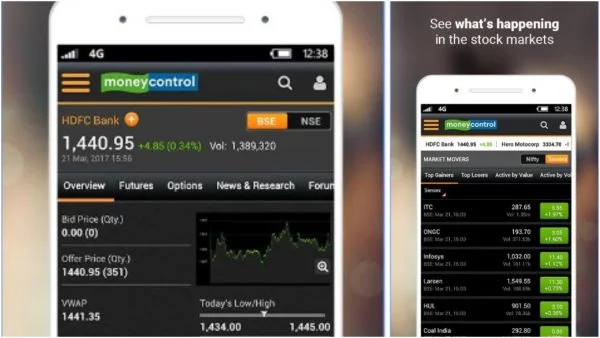
Our personal go-to app for stock market news and updates is this one. We strongly advise you to have this stock market app if you only intend to have one on your smartphone. The money management software is straightforward but packed with news and information.

With the Moneycontrol App, you can keep up with the most recent developments on the Indian and international financial markets on your smartphone. You may easily track indices (Sensex and Nifty), stocks, futures, options, mutual funds, commodities, and currencies because it covers a variety of assets from the BSE, NSE, MCX, and NCDEX markets.

Key Features:

1.Effortless Use: Easy access to the chat board, watchlist, and portfolio of financial data. Voice search in a single search bar for news, commodities, indices, mutual funds, stocks, etc.
2.Most recent market data From BSE, NSE, MCX, and NCDEX, the most recent quotes for equities, F&O, mutual funds, commodities, and currencies are available.
3.News: Daily market, business, and economic news coverage as well as senior management interviews
4.Portfolio: Portfolio tracking made simple for stocks, mutual funds, ULIPs, and gold. timely portfolio performance updates, news, and notifications, as well as information on the equities you own.

5.Creating a customised watchlist to track your preferred stocks, mutual funds, commodities, futures, and currencies. Receive timely notifications for news and company activity.
6.Discussion board: To receive recommendations, follow your favourite topics and the top boundaries. Participate in discussions about your portfolio or areas of interest.

You can download the MoneyControl App here!

Best Stock Market Apps #2 – Stock Edge

Play store rating: 4.4/5 Stars (31k Reviews)
Downloads: +1 Million
Available on: Android, iOS

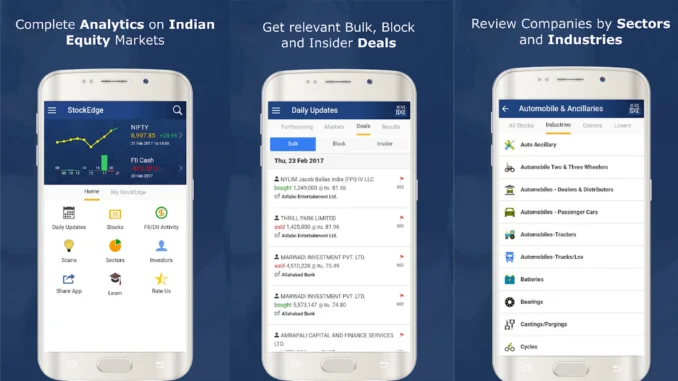
Stock Edge is one of the top share market apps since it offers end-of-day data, visualisations, and alerts that Indian stock market traders and investors can use to do independent research and make smarter judgements.

Key Features:

1. Everyday Updates News, NSE and BSE corporate announcements, upcoming events, corporate actions, and more are included in the section for filtered major market tracking.
2.Cash and derivatives for FIIs, FPIs, and DIIs with excellent historical data visualisation Daily, Monthly, and Annual.
3.Price scans, recent highs and lows, 52-week highs and lows, recent price behaviour over the past three days, etc. are all examples of opportunity scans.

4.Follow the activities of the major Indian investors. Create your own investor group with its various names, entities, etc. using the MyInvestorGroup feature.
5.Industry list, industries inside an industry, companies within an industry, Gainers, Losers, and Price Movement over the past 30 days are displayed in a straightforward graph.

You can download the StockEdge App here!

Best Stock Market Apps #3 – ET Markets

Play store rating: 4.7/5 Stars (52k Reviews)
Downloads: +1 Million
Available on: Android, iOS, Windows

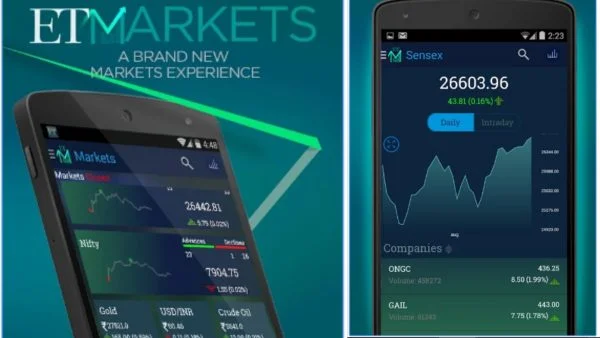
Another one of the top stock market applications is this one. We frequently read market news and updates on the Economic Time (ET) Markets app because it has the most recent information. The stock information function on this app is also consistently extremely neatly laid out.

Key Features:

1.Live NSE Nifty charts and share prices are available for tracking the BSE Sensex.
2.Get tips on intraday trading, stock futures, commodities, the FX market, and ETFs while you’re on the road by following stock quotes in real time.
3.An all-in-one resource for information on mutual funds, NAVs, portfolio updates, fund analyses, and SIP calculators
4.Build, maintain, and access your portfolio with a single swipe. Receive individualised news, analysis, and stock market statistics.

5.To make a watch list and follow them regularly
6.Get insights and expert opinions sent to you, and take part in conversations by leaving comments.

You can download the ET Markets app here!

Best Stock Market Apps #4 – Tickertape

Play store rating: 4.5/5 Stars (19k reviews)
Downloads: +1 Million
Available on: Android, (Not available on iOS)

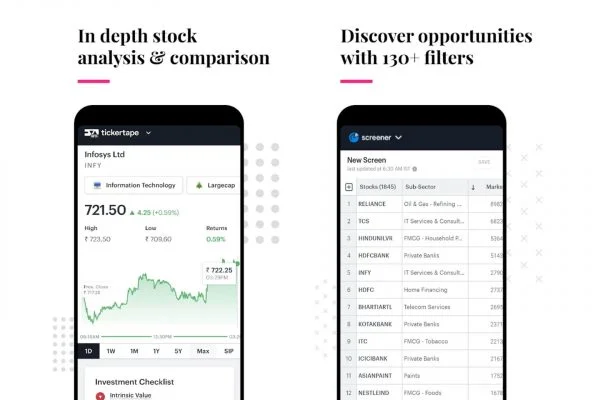
This app is somewhat newer compared to other applications on this list but has recently gained a lot of traction as one of the top stock market apps in India. Tickertape is a cutting-edge platform for stock analysis that puts you in control of the procedure.

It focuses on key metric analysis with strong ecosystem support and potent tools that can help you learn more about the market and how to participate in it.

Key Features:

  1. For each of India’s publicly traded corporations, a detailed stock analysis is provided.
  2. You may analyse any Indian stocks using an advanced screener with 130 filters.
  3. Market mood Index (MMI), a market attitude indicator, is used by traders to timing their trades appropriately.
  4. News, events, and peer comparisons are presented in a way that will support your investment choices.
  5. To help you log in and link your broker account to the Tickertape account, there is Broker Connect.

You can download the Tickertape app here

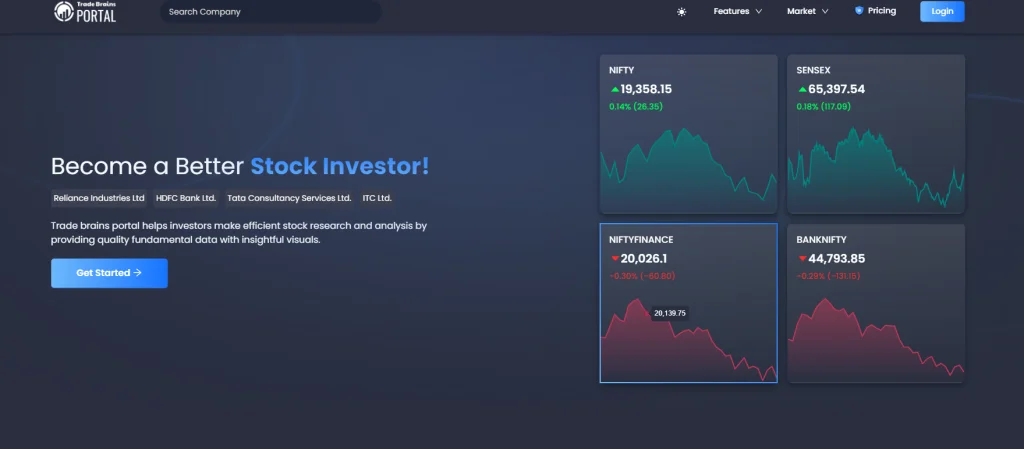
Best Stock Market Apps #5 – Trade Brains Portal

Play store rating: 4.8/5 Stars
Downloads: +10k Downloads
Available on: AndroidiOS

An app for researching the stock market that is quickly gaining popularity among users in India is called Trade Brains Portal. It has many other important features including Stock Screener, the most recent market news, stock buckets, and more. It is one of the greatest alternatives to the Moneycontrol app for the Indian market.

Trade Brains Portal App’s high-quality fundamental data and illuminating visualisations assist investors in conducting effective stock research and analysis. Users of the software can make numerous watchlists and stock portfolios to track their stocks in a one location. The Superstar portfolio function of the portal app allows users to follow prominent investors and their most recent stock portfolio.

The Trade Brains Portal app is unquestionably among the top stock market apps in India because to its sleekest user interface and quick analytics tool. Both the Google Playstore and the App Store now offer the Trade Brains Portal app.

Key Features:

  1. Find stock analytics information for over 4,000 publicly traded businesses in India on the NSE/BSE, including financial ratios, charts, financial statements, shareholding patterns, and more.
  2. Stock Market News: Users can stay informed about everyday stock market news by using the Trade Brains Portal App.
  3. Multiple Watchlists: Make as many watchlists as you’d like to save your favourite stocks.
  4. Stock Screener: Trade Brains Screener is unquestionably one of the most sophisticated and quick stock screeners in India, with over +130 criteria.
  5. Superstar Portfolio: Follow the most recent stock market portfolios of your favourite superstar investors to learn which stocks they are holding and in what amounts.
  6. Stock Buckets: Selected stocks to help you begin your journey into stock analytics. Thematic can be discovered.

You can DOWNLOAD Trade Brains Portal App here!

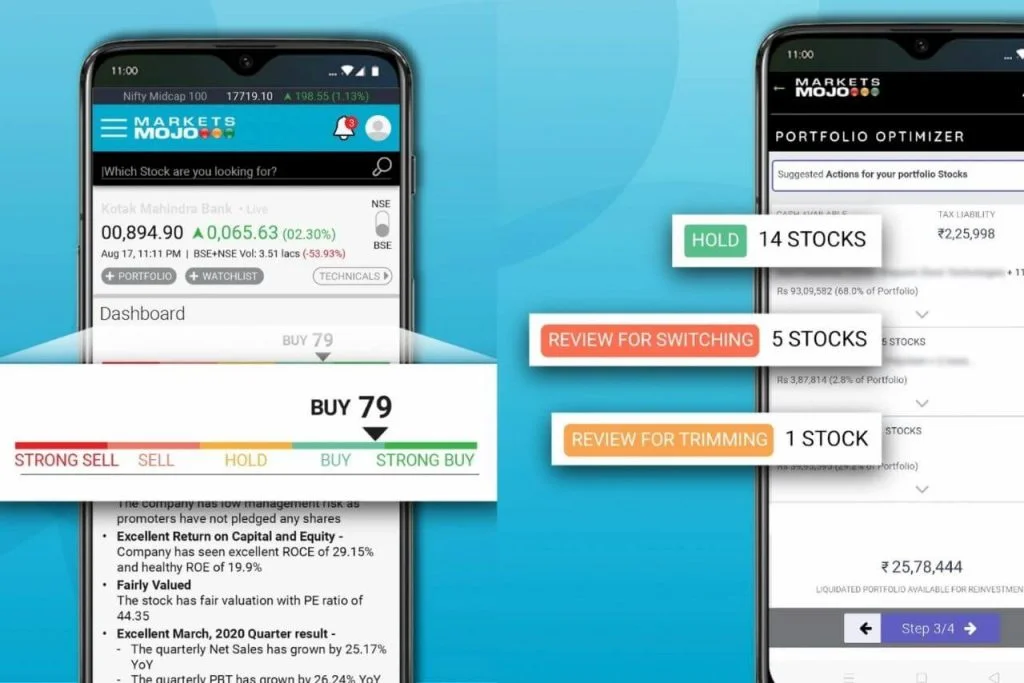
Best Stock Market Apps #6 – Market Mojo

Play store rating: 4.1/5 Stars (2.2k Reviews)
Downloads: +100,000
Available on: Android

This is a brand-new, potent app for researching the stock market. For conducting a fundamental study of equities, use Market Mojo. It provides pre-analyzed data on every stock, every financial, every news item, every price change, every broker recommendation, every technical, and every other relevant piece of information in the Indian stock markets.

Key Features:

  1. The company’s long-term performance in comparison to its competitors is reflected in the Mojo Quality rank.
  2. The stock’s valuation at the current price is determined by its valuation.
  3. The company’s ability to make money and its present financial trend show whether it is now on a growth path for the business.
  4. The Portfolio Analyser assesses every undiscovered opportunity and risk in the portfolio and advises the investor on what to do rather than merely track. Each portfolio is subjected to our seven-parameter examination, which looks at returns, risk, diversification, liquidity, quality, valuation, and financial trend.

You can download the Marketsmojo app here!

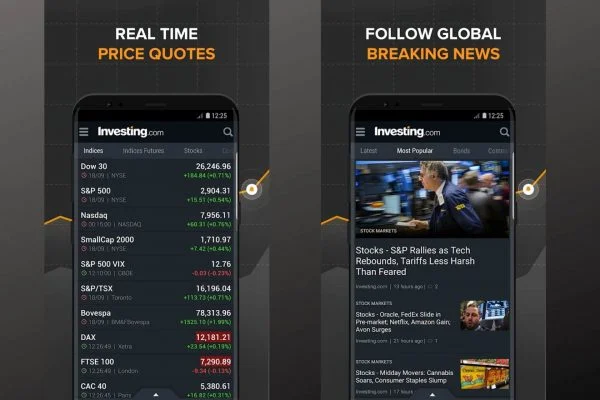
Best Stock Market Apps #7 – Investing.com

Play store rating: 4.4/5 Stars (448k Reviews)
Downloads: +10 Million Downloads
Available on: Android, iOS

An internationally utilised stock market app is investing.com. You can also get information about global indices and overseas stock exchanges in addition to information about Indian stocks. It provides a collection of financial informational tools that cover a wide range of national and international financial instruments.

Key Features:

  1. Live quotes and charts for more than 100,000 financial products that are traded on more than 70 international exchanges.
  2. Customised live updates on major economic happenings throughout the world.
  3. Create a watchlist that is unique to you and sync it with your Investing.com account to keep track of stock quotations, commodities, indices, ETFs, and bonds.
  4. breaking news, videos, analysis, and updates on the business, technology, and political landscapes, as well as on the world’s financial markets.
  5. All of our top-notch resources are easily accessible, including the Economic Calendar, Earnings Calendar, Technical Summary, Currency Converter, Market Quotes, sophisticated charts, and more.

You can download the Investing.com app here!

FOR MORE INFO CLICK THIS SITE:https://learningsharks.in/

FOLLOW OUR PAGE:https://www.instagram.com/learningsharks/?hl=en

What is Moving Average in Stock ?

What Is a Moving Average (MA)?

A moving average (MA) is a stock indicator used frequently in technical analysis in the world of finance. The purpose of generating a stock’s moving average is to create a continuously updated average price in order to assist smooth out the price data.

The effects of random, short-term changes on the price of a stock over a given time period are reduced by using the moving average calculation. A basic arithmetic average of prices over a time period is used by simple moving averages (SMAs), but exponential moving averages (EMAs) give more weight to more recent values than to older ones over the same time period.

Types of Moving Averages

Simple Moving Average

By calculating the arithmetic mean of a given set of data over a certain period, a simple moving average (SMA) is created. Stock prices are calculated by adding up a group of numbers and dividing the result by the total number of prices in the group. The following formula can be used to determine a security’s simple moving average:

SMA=A1​+A2​+…+An/n

where:A=Average in period nn=Number of time periods​

Exponential Moving Average (EMA)

The exponential moving average gives more weight to recent prices in an attempt to make them more responsive to new information. To calculate an EMA, the simple moving average (SMA) over a particular period is calculated first.

Then calculate the multiplier for weighting the EMA, known as the “smoothing factor,” which typically follows the formula: [2/(selected time period + 1)]. 

For a 20-day moving average, the multiplier would be [2/(20+1)]= 0.0952. The smoothing factor is combined with the previous EMA to arrive at the current value. The EMA thus gives a higher weighting to recent prices, while the SMA assigns an equal weighting to all values.

EMAt​=[Vt​×(1+ds​)]+EMAy​×[1−(1+ds​)]

where:EMAt​=EMA todayVt​=Value todayEMAy​=EMA yesterdays=Smoothingd=Number of days​

Simple Moving Average (SMA) vs. Exponential Moving Average (EMA)

Recent data points are given more weight in the EMA computation. EMA is regarded as a weighted average calculation as a result.

Each average in the graph below uses 15 periods, however the EMA reacts to changing prices more quickly than the SMA. When the price is rising, the EMA is more valuable than the SMA, and when the price is falling, the EMA is more valuable than the SMA. Some traders choose to employ the EMA over the SMA primarily due to its reactivity to price movements.

CONCLUSION

A moving average (MA) is a stock indicator that is frequently used in technical analysis. It creates a continuously updated average price to assist smooth out price data. A security is in an uptrend if its moving average is increasing, whereas a downtrend is indicated by a dropping moving average. Because it provides more weight to recent prices and exhibits a more distinct response to new information and trends, the exponential moving average is typically favored to the simple moving average.

FOR MORE INFO CLICK THIS SITE:https://learningsharks.in/

FOLLOW OUR PAGE:https://www.instagram.com/learningsharks/?hl=en

FacebookTwitterEmailWhatsApp

Sensibull: Advanced Trading Strategies and Analysis

Having the appropriate tools and tactics at your disposal is essential to success in the dynamic world of finance. Sensibull has developed an innovative trading platform that provides traders with cutting-edge tools and thorough research because we are aware of the complexity of trading. In this post, we examine the qualities and advantages that set Sensibull apart from other trading platforms.

Sensibull is a financial technology platform that offers a range of tools and services related to options trading.
Sensibull

A Glimpse into Sensibull

Sensibull is a powerful source of financial knowledge and trading capabilities, not just another trading platform. Our platform offers a variety of features that make us stand out from the competition and is made to accommodate both inexperienced and seasoned traders.

1. Advanced Options Strategies

Sensibull’s wide library of sophisticated options techniques is one of its distinguishing qualities. Whether you enjoy covered calls, straddles, or iron condors, Sensibull gives you a complete toolkit to investigate and use sophisticated options strategies.

2. Real-time Market Data

Access to real-time market data is essential in the hectic world of trading. Sensibull provides easy access to real-time market data, empowering traders to make wise choices based on current knowledge.

3. Risk Analysis

Effective risk management is essential to trading success. With the use of Sensibull’s risk analysis tools, you may evaluate the possible risks connected to your trades, enabling you to make thoughtful decisions and reduce losses.

4. Strategy Builder

You can design personalized trading strategies that are suited to your particular goals and risk tolerance using our user-friendly strategy builder tool. Sensibull has you covered whether you’re a cautious trader looking for consistent profits or a risk-taker looking for large rewards.

5. Comprehensive Options Chain

Sensibull offers a thorough options chain that makes it easier to choose the best options contracts. You may find opportunities in the market fast with precise information on strike prices, expiration dates, and other factors.

Why Choose Sensibull?

After giving you a taste of everything Sensibull has to offer, let’s examine how choosing our platform could revolutionize your trading career.

1. User-Friendly Interface

It can be intimidating to navigate the financial markets, especially for newcomers. The intuitive Sensibull interface makes it simple for traders of all experience levels to access and make use of our potent features.

2. Educational Resources

We think that the secret to trading success is knowledge. Sensibull provides a multitude of instructional materials, like as articles, tutorials, and webinars, to aid in the development of your trading abilities.

3. Risk Mitigation

The risk analysis tools from Sensibull are made to show you exactly what potential drawbacks might be. You can protect your assets by making well-informed decisions and being aware of the hazards.

4. Customization

Every trader is unique, and we understand that one size does not fit all. Sensibull’s customization options allow you to tailor the platform to your specific trading style and preferences.

Key Features of Sensibull

  1. Options Chain Analysis: Sensibull offers consumers a thorough study of the options chain, enabling traders to quickly see the available options for a specific stock or index. Trading chances can be rapidly identified thanks to this functionality.
  2. Strategy Builder: For traders, Sensibull’s Strategy Builder is a game-changer. It makes it simple for users to develop and assess multi-leg options strategies. By examining the risk-reward profile of various tactics, traders may decide more wisely.
  3. Greeks Calculator: Options traders need to understand the Greeks (Delta, Gamma, Theta, Vega, and Rho). Sensibull provides a Greeks calculator that makes it easier to compute these important variables, assisting traders in determining their exposure and risk.
  4. Live Market Data: Making timely trading decisions requires having access to real-time market data. Sensibull updates traders with real-time market information, such as option pricing, volumes, and implied volatility.
  5. Paper Trading: Sensibull provides a paper trading function for new users or those wishing to test out different trading methods. Users can do this without putting their money at risk and practice trading in real market conditions.
  6. Option Chain Heatmap: Data on options can be difficult to visualize. Trading professionals may more easily identify trends and patterns thanks to Sensibull’s Option Chain Heatmap, which provides a simple visual depiction of option prices.
  7. Option Screener: It can be difficult to find the correct choices to trade. The Sensibull Option Screener helps traders find the best chances by filtering options contracts based on a variety of criteria.
  8. Educational Content: Sensibull offers more than simply tools; it also offers educational materials to help traders better comprehend the world of options trading. This covers tutorials, articles, and webinars.

Benefits of Using Sensibull

  • Simplicity: Options trading is now more approachable to a wider audience, including people who are unfamiliar with the world of derivatives, thanks to Sensibull’s user-friendly interface.
  • Risk Management: The platform’s tools for risk assessment and strategy analysis give traders the power to manage risk effectively.
  • Cost-Efficiency: Sensibull offers multiple pricing plans, including a free version with limited features. This flexibility ensures that traders can choose a plan that suits their needs and budget.
  • Innovation:Sensibull has a variety of price options, including a free edition with constrained functionalities. Traders can select a package that fits their needs and budget thanks to this flexibility.

Conclusion

Being ahead of the curve is crucial in the world of trading. Sensibull provides a cutting-edge platform that combines sophisticated options strategies, real-time data, risk analysis, and personalization to give you an advantage over the competition. Sensibull is your dependable partner in accomplishing your financial objectives, regardless of your level of trading experience or where you are in your path.

FOR MORE INFO CLICK THIS SITE:https://learningsharks.in/

FOLLOW OUR PAGE:https://www.instagram.com/learningsharks/?hl=en

Understanding National Stock Exchang (NSE)Options

Introduction

One of the biggest and most well-known stock exchanges in the world is the National Stock Exchange (NSE) of India. The trading of options is one of the most well-liked financial tools available on the NSE. NSE options give traders and investors a wide range of instruments for risk management, market speculation, and improving investing methods. We shall dig into the world of NSE options in this essay, outlining their nature, operation, and significance to the financial markets.

National Stock Exchange of India Limited is largest financial market in India and the fourth-largest market in terms of trading
National Stock Exchange of India Limited (NSE)

What are NSE Options?

The right, but not the duty, to buy or sell a particular underlying asset at a fixed price (known as the strike price) on or before a given expiration date is provided by NSE options, which are financial contracts. Stocks, stock indices like the Nifty 50 and Bank Nifty, and even commodities, can be among the underlying assets.

There are two main types of NSE options:

  1. Call Options:The right to purchase the underlying asset at the strike price before or on the expiration date is provided by a call option. When traders believe that the price of the underlying asset will increase, they frequently use call options.
  2. Put Options: The right to sell the underlying asset at the strike price before or on the expiration date is provided by a put option. Put options are frequently used when traders anticipate a decline in the value of the underlying asset.

Key Terminology in NSE Options

Understanding certain key terminologies is crucial before delving further into NSE options:

  1. Strike Price: The cost at which the underlying asset may be purchased (in the case of call options) or sold (in the case of put options).
  2. Premium: The sum paid by the option buyer to the option seller in exchange for the rights the option grants.
  3. Expiration Date:The time at which an option contract expires and loses its validity.
  4. In-the-Money (ITM), At-the-Money (ATM), and Out-of-the-Money (OTM): These phrases explain the connection between the strike price and the underlying asset’s current market price. If an option has intrinsic value, it is deemed ITM. If it does not, it is deemed OTM. If it has a strike price that is near to the market price, it is deemed ATM.

Why Trade NSE Options?

  1. Hedging: Options can be used to shield a portfolio against unfavorable changes in the underlying asset’s price. For example, a stockholder can purchase put options to protect themselves from probable losses..
  2. Speculation: Options allow traders to benefit from market changes without needing to hold the underlying asset. Put options are used for speculation that is negative, whilst call options are used for speculation that is bullish.
  3. Income Generation: Traders may be able to make money by selling options in the form of premiums. Selling cash-secured puts and covered calls are two popular methods for making money.
  4. Risk management: Using options, traders can determine their risk in advance. Risk management is more precise because the premium paid or received represents the maximum possible loss or gain.
  5. Diversification: Trading options provides a way to diversify one’s investment portfolio by giving them limited capital access to a variety of assets.

Risks Associated with NSE Options

While NSE options offer numerous benefits, they also come with certain risks:

  1. Time Decay: Options lose value as they approach their expiration date, a phenomenon known as time decay or theta decay. This can erode the value of an option even if the underlying asset’s price remains unchanged.
  2. Volatility Risk: Options are sensitive to changes in market volatility. Increased volatility can lead to higher option premiums, but it can also result in larger price swings and potential losses.
  3. Limited Profit Potential: The profit potential for option buyers is capped at the difference between the strike price and the market price, minus the premium paid. Sellers, on the other hand, have limited potential gains but unlimited potential losses.
  4. Assignment Risk: Option sellers may be assigned (obligated to fulfill the contract) at any time before expiration. This can result in unwanted positions.

FOR MORE INFO CLICK THIS SITE:https://learningsharks.in/

FOLLOW OUR PAGE:https://www.instagram.com/learningsharks/?hl=en

Five Key Financial Ratios for Stock Analysis

Contrarian trading is an investment strategy employed in financial markets where traders and investors deliberately go against the prevailing market sentiment and trends.

Learn how the five important ratios of debt-to-equity, price-to-book, price-to-sales, and price-to-earnings can aid investors in determining a stock’s true value.

Calculating a stock’s worth can be as easy or as difficult as you like. Depending on how much depth of understanding you require. It’s simple to miss the crucial details amidst the intricacy if you take in too much information. Too limited vision can cause you to overlook a lot of crucial details.

How much is sufficient? Really, it’s up to you. Have all of your fundamentals down pat as a starting point. That’s what we’ll look at in this article.

Five key financial ratios for analyzing stocks

Although there are more stock ratios, these five are so essential to understanding stocks that you should fully comprehend them all and how they might drive your thinking when attempting to determine a stock’s “value.” Probably on your mind is this: valuation relative to what? That’s the goal, I suppose.

To make sure you are familiar with the fundamentals, you might wish to examine a stock’s value from a variety of perspectives. These five ratios are made to do that.

Price-to-earnings, or P/E, ratio

The price-to-earnings (P/E) ratio is quite possibly the most heavily used stock ratio. The P/E ratio—also called the “multiple”—tells you how much investors are willing to pay for a stock relative to its per-share earnings.

Computing the P/E is simple: just divide the stock’s share price by its earnings per share (EPS). For example, if a stock has a P/E ratio of 20, it means investors are willing to pay up to 20 times its EPS to own it. But is that too much or too little? Expensive or cheap?

In the end, it may come down to what a corporation is able to achieve in terms of potential future profits. You can compare a stock’s P/E to the historical average return of the S&P 500®, which as of November 2022 (assuming dividends are reinvested) was about 12% for the previous ten years. The index’s P/E ranged from 13.5 to over 124 during the 11-year bull market that started in March 2009 and ended at roughly 23 in March 2020. The P/E ratio has its limitations because it can only really tell you how much investors are ready to pay for the company right now.

Shares of the firm with the higher ratio may actually be regarded as cheaper than shares of the company selling at the lower ratio, for instance, if the company with the higher growth rate has a P/E ratio of 35 rather than one of 10. This brings up the following ratio.

Price/earnings-to-growth, or PEG, ratio

The price/earnings-to-growth (PEG) ratio can offer a more thorough and precise picture of a stock’s future growth potential, even though it is less well-known than its P/E counterpart.

You may be familiar with a stock’s P/E ratio, but how does that figure compare to the growth rate that is expected? Even though a firm’s P/E may appear to be “cheap,” hanging onto a stock with a low P/E is useless if the company doesn’t expand.

With the PEG ratio, you may compare the P/E to the projected earnings analyst consensus forecast, which normally projects earnings out up to five years, starting as early as quarterly.

By dividing the P/E ratio by the anticipated EPS growth, the PEG is calculated. A stock with a P/E of 18 and a 15% annual growth rate, for instance, would have a PEG of 1.2. How should you interpret this number then? Stocks having a PEG ratio of less than 1 are typically regarded as being undervalued.

Investors don’t want to acquire items that won’t appreciate in value, thus the growth component is crucial. Investors typically look for historical and predicted growth when purchasing shares with a low PEG ratio, since these factors might support an inexpensive PEG ratio.

Price-to-sales, or P/S, ratio

Some companies might have strong quarterly sales but weak earnings, perhaps because they ended up spending a good portion of their revenue. Some investors are willing to forego profits now for potentially stronger returns in the future. They understand that certain companies may need to spend their cash and quarterly sales profits to build a bigger and better company for the future. The important thing these investors focus on here is sales.

The price-to-sales (P/S) ratio shows how much investors are willing to pay above a company’s gross revenue, whereas investors focused on earnings are looking at revenue minus liabilities.

Despite the fact that sales are typically less susceptible to management manipulation than earnings data, revenue may not be as “solid” a metric as earnings for value purposes. Although different costs might have an impact on profitability, a company’s sales are quite clear.

Divide the stock price by sales per share to get the P/S ratio. For instance, a company with $500 million in sales and 100 million outstanding shares would have $5 in sales per share. The P/S ratio is 2 if the stock price is $10 per share.

Investors can better comprehend the relationship between a company’s current stock price and annual sales by using the P/S ratio.A P/S ratio of.53 means that for every dollar in sales the firm generates, investors are paying $0.53 a share.

Price-to-book, or P/B, ratio

What is the stock price of a firm in relation to its net asset value, commonly known as “book value”? The price-to-book (P/B) ratio shows that to be the case. On the surface, it appears to be a useful indicator for comparing a stock’s market capitalization to its assets and liabilities. It’s not always that easy, though.

Determining the value of a company’s assets can be very difficult. Depending on the sector, many businesses price their asset costs based on the value they carried at the time of acquisition rather than the market value. For instance, if a reputable business bought real estate decades ago, the value of the asset recorded on the business’s books may be historical rather than marked-to-market.

 To find a company’s real book value—which also is called “shareholders’ equity”—you might have to dig a lot deeper, beyond the books. The P/B ratio is best suited to large, capital-intensive companies, such as automakers, rather than companies with intangible assets, such as software firms where much of the value is based on patents or other intellectual property that’s not carried on the books as an asset.

A P/B ratio of 1 indicates the company’s shares are trading in line with its book value. A P/B higher than 1 suggests the company is trading at a premium to book value, and lower than 1 indicates a stock that may be undervalued relative to the company’s assets. To get the P/B ratio, divide the stock price by the book value per share. A company with 100 million outstanding shares, assets of $800 million, and debt liabilities of $125 million would carry a book value of $675 million, or $6.75 per share. If that stock traded at $5, the resulting P/B ratio of .74 would suggest that the stock may be undervalued.Divide the stock price by the book value per share to obtain the P/B ratio. A business with 100 million shares in circulation, $800 million in assets, and $125 million in debt liabilities would have a book value of $675 million, or $6.75 per share. The resulting P/B ratio of.74 would indicate that the company may be undervalued if it traded for $5.

Debt-to-equity, or D/E, ratio

In order to determine a company’s debt to equity ratio, which is similar to a company’s book value, we also reverse the phrase. The consolidated balance sheet contains the statistics for a company’s total debt and shareholders’ equity, and the calculation is straightforward.

Investors often prefer a debt-to-equity (D/E) ratio that is lower than 1. A ratio of two or greater could be perceived as having a higher risk. However, it also depends on the sector. For instance, large industrial energy and mining corporations typically have higher debt loads than companies in other sectors. Because of this, investors frequently compare a stock’s D/E ratio to the D/E of other businesses operating in the same sector.

A high D/E ratio shows that a corporation has taken on a lot of debt. That might indicate the company is borrowing money to survive rather than creating income, but it might also signify the company is unprofitable and is leveraging its assets to finance growth. Investors want to know if debt is lifting the company off its feet with loan payments and other liabilities, or if it is raising earnings by more than the cost of debt.

Similar to the P/B ratio example, a corporation with 100 million shares in circulation, $800 million in assets, and $125 million in debt liabilities would have $675 million in shareholders’ equity (book value). A D/E ratio of.19 is obtained by dividing the total liabilities by shareholders’ equity showing a business that has very low debt and is probably funding its expansion with earnings.

FOR MORE INFO CLICK THIS SITE:https://learningsharks.in/

FOLLOW OUR PAGE:https://www.instagram.com/learningsharks/?hl=en

FacebookTwitterEmailWhatsApp