Learning sharks-Share Market Institute


Rajouri Garden  8595071711 7982037049  Noida 8920210950 , and  Paschim Vihar  7827445731  

Fee revision notice effective 1st Jan 2026; No change for students enrolled before 15th Jan 2026

Download “Key features of Budget 2024-2025here

Adani Group looks to refinance debt of $3.5 billion,

Adani Group intends to refinance loans totaling up to $3.8 billion; Adani is anticipated to pay back at least $300 million of the first Ambuja facility.

GQG Partners subsequently bought an 8.1 per cent stake in India's Adani Power for $1.1 billion via block deals on August 16.
Adani Group seeks to restructure its debt with Ambuja Cements.

Reportedly, Adani Group is in discussions to restructure a loan it took out to pay for the acquisition of Ambuja Cements. One of Asia’s largest syndicated loans this year, totaling $3.5 billion, is said to have been distributed among the lenders into three categories.

Adani is anticipated to return at least $300 million on the initial Ambuja facility, according to sources in the know, according to Bloomberg, which covered this event.

  • DBS Group Holdings, First Abu Dhabi Bank, Mizuho Financial Group, Mitsubishi UFJ Financial Group, and Sumitomo Mitsui Banking Corp. would each provide about $400 million, according to the article, while other banks would finance smaller banks.
  • Adani Enterprises Ltd, Adani Ports, Adani Green Energy Ltd, Adani Transmission Ltd, and Ambuja Cements are the five Adani stocks in which it has a combined stake, and their combined market value is now close to Rs 26,000 crore.
  • Subsequently, on August 16, GQG Partners paid $1.1 billion in block agreements for an 8.1% share in India’s Adani Power. On August 17, it increased its holding in Adani Ports And Special Economic Zone Ltd. to 5.03 percent.

CONCLUSION

FOR MORE INFO CLICK THIS SITE:https://learningsharks.in/

FOLLOW OUR PAGE:https://www.instagram.com/learningsharks/?hl=en

What is GMV in the stock market?

The term “GMV” refers to “Gross Market Value” in the context of the stock market. The total value of all securities traded on a single exchange, market, or during a particular trading session is calculated using the financial statistic known as GMV. It stands for the total market capitalisation of all the businesses whose stocks are traded at any given time.

GMV

How GMV is determined is as follows:

  • Identify the Companies:Determine which firms’ stocks are taken into account by identifying them. This usually refers to all the businesses that are listed on a specific stock exchange or market.
  • Calculate Market Capitalization:Determine Market Capitalization: Determine each company’s market capitalization, which is the sum of the value of all of its outstanding shares of stock. By dividing the current stock price by the total number of outstanding shares, market capitalization is determined.
  • Sum Up Market Caps:Add Market Capitalizations: To calculate the Gross Market Value, add the market capitalizations of all the companies.

A important indicator for evaluating a stock market or exchange’s overall size and activity is its GMV. It offers information on the total value of the stocks being traded, which can be a key sign of the size and health of the market as a whole. It’s crucial to keep in mind, though, that GMV disregards other asset classes like bonds, derivatives, and commodities, all of which might be traded on a specific exchange or market.

Advantages and Disadvantages

Advantages:

  1. GMV serves as a measure of the size and activity of a stock market or exchange’s whole market. It gives a rapid overview of the total value of all traded stocks, which is helpful for determining the size of the market.
  2. Benchmarking: GMV can be used to compare various stock exchanges or markets. It can be used by analysts and investors to assess the relative size and significance of distinct markets.
  3. Liquidity Evaluation: Market liquidity is frequently correlated with higher GMV. It is beneficial to traders because higher trading volumes can result in tighter bid-ask spreads and simpler trade execution.
  4. Investor Confidence: A strong GMV can inspire investor confidence because it suggests that the market is active and popular. This has the potential to draw in both domestic and foreign investors.

Disadvantages:

  1. GMV does not take into account non-equities, such as bonds, derivatives, or commodities. Instead, it exclusively looks at the market capitalizations of individual companies’ stocks. This constrained scope might not give a complete picture of the whole financial market.
  2. Market concentration: Instead of a wide variety of businesses, a high GMV may occasionally be the outcome of a small number of dominantly large businesses. If those significant corporations experience problems or see their value drop, this concentration may result in market weaknesses.
  3. Market volatility: GMV is susceptible to market volatility, particularly in volatile or speculative markets. Accuracy of the metric can be distorted by large swings.
  4. GMV is a useful indicator for some things, but it’s insufficient for analysis because it doesn’t reveal anything about the underlying dynamics or the calibre of the enterprises that make up the market. It is a quantitative metric and only provides a partial picture of the state of the market.
  5. Not Always Comparable: Since markets can have distinct structures, regulatory environments, and trading practises, comparing GMV across several markets may not always be meaningful.
  6. Market Manipulation: Market participants occasionally influence stock prices to artificially boost GMV, which can deceive investors and skew the real state of the market.

Conclusion

The total value of all securities traded on a single exchange or market over a specified time period is measured using the stock market metric known as gross market value (GMV). It has a number of benefits, including its function as a benchmark for comparisons, an indicator of market size, and a measure of market liquidity and investor confidence. The disadvantages of GMV include the exclusion of non-equity securities, sensitivity to market concentration, susceptibility to market volatility, and its limited capacity to offer a comprehensive picture of a market’s health.

In the end, GMV is a useful tool for evaluating specific features of a stock market, but it should be combined with other metrics and fundamental analysis to have a more thorough picture of the dynamics of the market and the calibre of the companies that make up its constituents. It is one of many variables to take into account while choosing an investing strategy and assessing the general health of a financial market.

FOR MORE INFO CLICK THIS SITE:https://learningsharks.in/

FOLLOW OUR PAGE:https://www.instagram.com/learningsharks/?hl=en

Day Trading for Beginners

Introduction

Day trading is a short-term trading strategy that entails purchasing and selling financial assets on the same day in an effort to capitalise on rapid price movements. A strategy known as day trading is frequently applied to highly liquid assets such as stocks, currencies, options, and futures. Examining price charts and locating trade chances with the aid of technical indicators are both included. This quick-paced technique necessitates continuous attention, risk management expertise, and emotional restraint because traders must react swiftly to market moves. Day trading carries a high level of risk, and inexperienced traders who are unprepared could sustain significant losses despite the potential for quick gains. People who are interested in day trading need to do their research, be cautious when engaging in the activity, and have a strategy in place.

Basics of Day Trading – Definition

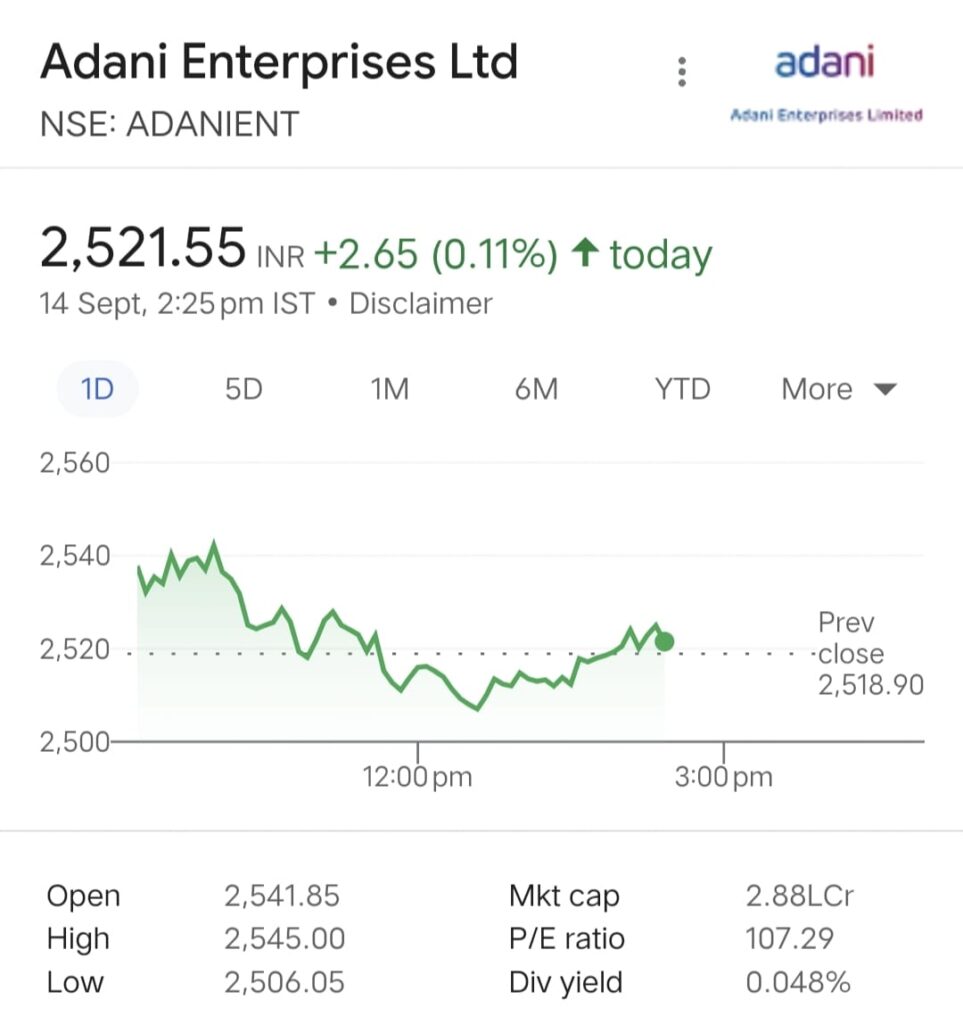
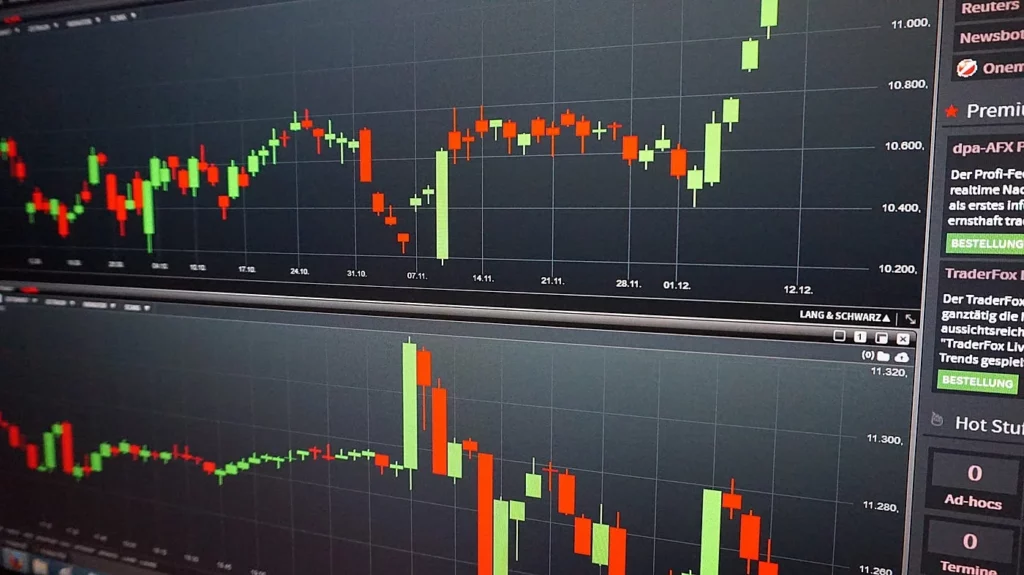
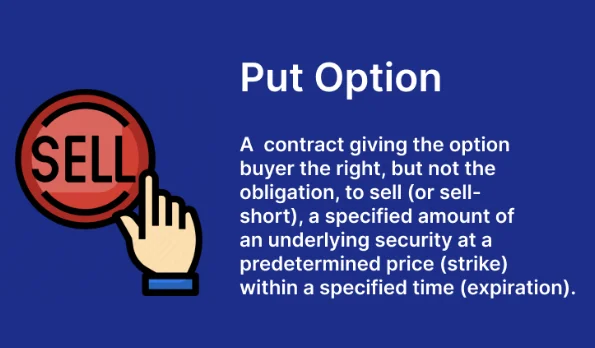
Buying or selling stocks on the same day is referred to as day trading or intraday trading. Day traders can choose to buy first and sell later, or the opposite. When the market is rising, they purchase, and when it is falling, they sell. In the stock, currency, and F&O (Futures and Options) markets, day trading is frequently highly popular. On the stock market, day traders look for liquid, incredibly volatile momentum equities and decide when to enter and exit.

Day traders frequently employ a lot of leverage. Leverage can greatly increase their profit margin, but if the business doesn’t work out as expected, it can also result in a sizable financial burden.

On the stock market, there are three basic kinds of traders: fundamental, technical, and news-based. Fundamental day traders look for opportunities using fundamental research, including price-earnings, beta, book value, balance sheet, etc. Technical day traders use indicators like the MACD, Bollinger Band, RSI, and others to analyze a stock’s momentum and place exact bets. The equities that are most likely to be impacted by the day’s most important news are also traded by news-based day traders after reading or listening to it. Macroeconomic data, business profitability, sectoral news, interest rates, and market mood in general are all things that news-based traders keep an eye on.

Changes in the stock market are brought on by the collective emotions of traders and investors. For instance, whereas some traders might spot an opportunity and invest heavily, others would spot a threat and withdraw their money. As a result of the unpredictable volatility of stock prices, day traders seek to make money.

Top Strategies Employed by Day Trading Beginners

Different day trading strategies are used by both inexperienced and seasoned traders to make money. The primary methods day traders employ to trade equities profitably are listed below:

  • Identifying the market trend and riding the waves are both parts of momentum trading. A market trend may be upward, downward, or sideways.
  • The practice of making several very rapid trades and then collecting the profits is known as scalping.
  • Range trading is a method of deciding when to enter and quit a transaction by identifying levels of support and resistance. It is usual practice to use the Fibonacci Retracement level indicator to define support and resistance lines.
  • High-Frequency Trading (HFT) – HFT automatically executes trades while keeping an eye on price changes using an automated computer-based trading system.

Benefits of Day Trading

  • Profiting from quick price movements and possibly turning a profit in just one trading day are both possible with day trading.
  • No Overnight Risk: Because day traders settle their positions at the end of the day, they minimize their exposure to overnight market risks like earnings announcements or geopolitical developments.
  • Increased Liquidity: To enable quick entry and exit from positions without too much price slippage, day traders focus on highly liquid assets.
  • Flexibility: Because day trading may be done as a full-time or part-time endeavour, it gives traders the opportunity to manage their time and obligations.
  • Lower Margin Requirements: Some brokers have lower margin requirements, allowing day traders to hold greater positions with less capital.
  • Frequent Trading Opportunities: In active markets, day traders may find a variety of trading opportunities throughout the day, increasing their chances of discovering profitable setups.
  • Day traders get immediate feedback on their trades, allowing them to quickly analyze and tweak their tactics.
  • Emotional Control: Day trading necessitates self-discipline and emotional control, which can promote personal growth and better judgement.
  • Reduced Exposure to Market Events: Day traders are protected from the risk of large price gaps that could develop between trading days by completing positions before the market closes.

FOR MORE INFO CLICK THIS SITE:https://learningsharks.in/

FOLLOW OUR PAGE:https://www.instagram.com/learningsharks/?hl=en

What is Position Trading ?

Contrarian trading is an investment strategy employed in financial markets where traders and investors deliberately go against the prevailing market sentiment and trends.

Position trading is a strategy wherein a trading position is held for a long period (generally weeks or months) to achieve profit. A trader normally has long-term thinking in position trading and holds the position for a prolonged period irrespective of the short-term gyrations. For example, the positions could belong (buying the asset first) and short (selling the asset first). This form of trading can also be termed trend following, and traders generally use long-term charts (weekly, monthly) to initiate trading positions.

Advantages and Disadvantages

Advantages

  • Due to the long-term component, position trading is less dangerous than swing trading and day trading.
  • Positional trading makes use of both technical and fundamental analysis, making the method more reliable.
  • The majority of large asset movements occur over night, and positional trading can be used to profit from them.
  • Compared to swing or day trading, position trading demands less constant attention from the trader.
  • Leverage is readily available, which is advantageous in leveraged trading because the asset can be used as collateral.

Disadvantages

  • Unlike other trading tactics, position trading necessitates long-term capital.
  • Position trading calls for abilities in asset fundamental analysis, which many technical analysts lack.
  • Because stop losses in position trading are broader than in other trading techniques, the cost of errors is higher.

Limitations

  • Position trading performs better in markets that are moving (up and down). In a sideways market, positional trades cannot be profitable.
  • It restricts capital and puts the trader at risk of liquidity issues.

Conclusion

Trading is a high-risk activity, thus before seeing considerable market success, traders must test and train themselves. Additionally, position trading is similar. To study position trading, one must invest a lot of time in observing, learning, and interpreting market movements. Analyzing historical data and identifying patterns is the greatest approach to learn position trading. It becomes quite simple to design and carry out trading strategies while adhering to basic risk management guidelines once a trader comprehends market patterns.

FOR MORE INFO CLICK THIS SITE:https://learningsharks.in/

FOLLOW OUR PAGE:https://www.instagram.com/learningsharks/?hl=en

Top websites or blogs for analyzing the Indian stock market?

There are numerous respectable blogs and websites that offer analysis and information regarding the Indian stock market as of my most recent update in September 2021. Remember that websites’ accessibility and quality are subject to change over time, therefore it is advisable to confirm their validity and applicability before depending on them to make investment decisions. Here are some of the notable sources at that time:

  • Moneycontrol: Moneycontrol is one of the most popular financial and stock market websites in India. It offers a wide range of information, such as news, stock quotes, professional commentary, and assessments of Indian companies and markets.
  • Economic Times Markets: This area of the newspaper offers news, commentary, stock quotations, and information about the Indian equity market. It’s a dependable resource for learning about changes and trends in the market.
  • Investing.com IndiaThis website offers in-depth coverage of the financial markets, particularly the stock market in India. It provides news, charts, technical analysis, and data that is current.
  • Sharekhan ResearchSharekhan is a reputable brokerage company in India. On their website, they provide research papers, market analyses, and investment insights.
  • Dalal Street Investment Journal (DSIJ): DSIJ is a reputable journal that discusses stock market analysis, investment methods, and stock-specific information.
  • Although Value Research Online is best recognised for its mutual fund analysis, it also offers information on stocks, including stock ratings and analysis by professionals.
  • Samco’s Ticker Tape provides information, articles, and educational materials about the Indian stock market. It addresses a range of subjects important to both new and seasoned investors.
  • Motilal Oswal Research: Motilal Oswal is a well-known brokerage firm, and their research studies and analyses can give Indian investors important information.

While these sites might offer insightful information and analysis, keep in mind that you should always perform your own research and not rely primarily on any one source when making financial decisions. Before making any substantial investment decisions, it is advisable to research the markets thoroughly and maybe get advice from financial experts from a number of credible sources.

FOR MORE INFO CLICK THIS SITE:https://learningsharks.in/

FOLLOW OUR PAGE:https://www.instagram.com/learningsharks/?hl=en

What is a Put Option? How might it be used in Penny Stock Trading?

Put options

A put option is a type of financial contract that grants the holder the right, but not the requirement, to sell a particular underlying asset (such as a stock, bond, or commodity) at a defined price, or striking price, before or on a particular expiration date. In the financial markets, put options are frequently employed as a hedging or speculative strategy.

Put options can be employed in a variety of ways when trading penny stocks, but because of their inherent volatility and lesser liquidity, they come with their own set of dangers and complications. Using put options in penny stock trading may look like this:

  • Speculative Trading: If traders believe that the price of a penny stock will fall, they might buy put options on the stock. Without really shorting the stock, this might be a speculative wager on its possible decline.
  • Hedging: Put options can be used as a kind of insurance by investors who possess penny stocks in their portfolio and want to hedge against probable price drops. They can reduce possible losses in the event that the value of their penny stocks declines by purchasing put options with strike values close to the current market price.
  • Generating Income: Writing (selling) put options on penny stocks is another way for traders to make money. If the option holder executes the put they sold, they are compelled to purchase the underlying stock. The trader keeps the premium they received for selling the put option if the stock price stays above the strike price.
  • Risk Management: Put options can be used by penny stock traders as part of their risk management plan. To reduce possible losses in the event that the stock price swings against them, they can set stop-loss orders or purchase put options with strike prices close to their stop-loss levels.

It’s crucial to remember that there are dangers associated with trading options, particularly puts, and that penny stocks are inherently dangerous because of their low share prices and restricted liquidity. Considerations and dangers related to trading penny stocks with put options are listed below:

  • Limited Liquidity:Low trading volumes for penny stocks frequently lead to higher bid-ask spreads and restricted options liquidity. Due to this, it could be difficult to complete trades in options at the appropriate price.
  • Volatility: Penny stocks can be very erratic, and volatility has an impact on option prices. Higher option premiums may result from more volatility.
  • Expiration Dates: Options have expiration dates, and if they are held on to for too long, their temporal value may be lost.
  • Expenses: Transaction expenses associated with trading options, such as commissions and bid-ask spreads, may have an impact on overall profitability.
  • Understanding Options: Given its distinct qualities and risks, options must be thoroughly understood before being used.

Prior to starting a penny stock options trading strategy, think about your level of experience, risk tolerance, and financial objectives. It is advisable to seek advice from a financial advisor or options expert and conduct in-depth research on the particular penny stocks and options methods you intend to use. Furthermore, always be conscious of the possibility of suffering big losses while trading in choppy and risky markets like penny stocks.

FOR MORE INFO CLICK THIS SITE:https://learningsharks.in/

FOLLOW OUR PAGE:https://www.instagram.com/learningsharks/?hl=en

What is the Best Stock in the Share Market?

Finding the “best” stock on the stock market is a difficult and subjective endeavour. The optimal stock for you will differ depending on your financial objectives, risk tolerance, investing horizon, and market conditions, thus there is no universally applicable solution. To evaluate stocks, keep the following in mind:

  • Financial Objectives: Do you prefer short-term gains, steady dividend income, or long-term growth? Your objectives will affect the kinds of stocks you should take into account.
  • Risk Tolerance: The level of risk associated with certain stocks varies. While others can be highly speculative and volatile, some are more steady and less volatile. Consider your risk tolerance before making a stock selection.
  • Diversification: To spread risk, it’s generally a good idea to distribute your investments among a variety of companies and asset types.
  • Research: Learn everything you can about the businesses you’re interested in. Examine their management team, market share, expansion potential, and any recent news or events that could affect their stock price.
  • Market Situation: Take into account how the market is doing right now. Stock prices rise during bull markets, whereas prices decline during bear markets. According to the state of the market, your investment plan may need to change.
  • Industry and Sector: From time to time, some industries and sectors may perform better than others. For instance, defensive companies like utilities and consumer staples may be more stable during economic downturns whereas technology firms may prosper during moments of innovation.
  • Dividends: Think about investing in dividend-paying stocks if you’re searching for consistent income. These businesses pay dividends to shareholders out of a portion of their profits.
  • Evaluation: Determine whether a stock is trading for a fair price. Price-to-earnings (P/E), price-to-sales (P/S), and price-to-book (P/B) ratios are common valuation indicators.Review analyst reports and recommendations, but it’s also important to conduct your own independent research.
  • Long-Term Perspective: Think about your investing horizon in the long term. Instead of concentrating on short-term price changes, successful investors frequently look at a company’s potential over the long run.
  • Taxes: Consider the tax effects of your investing decisions. Your overall results may be impacted by capital gains taxes.
  • Maintain Constant Monitoring of Your Investments: Keep up-to-date on the businesses and markets that you are engaged in.

FOR MORE INFO CLICK THIS SITE:https://learningsharks.in/

FOLLOW OUR PAGE:https://www.instagram.com/learningsharks/?hl=en

How does Technical Analysis help in trading?

Technical analysis attempts to predict future price movements, providing traders with the information needed to make a profit.
Technical Analysis

The study of historical market data, such as price and volume, is known as technical analysis. Technical analysts aim to predict future market behavior by using insights from market psychology, behavioral economics, and quantitative analysis. Chart patterns and technical (statistical) indicators are the two most common types of technical analysis.

KEY TAKEAWAYS

  • Technical analysis attempts to forecast future price movements, giving traders the information they need to profit.
  • Traders use technical analysis tools on charts to identify potential entry and exit points for trades.
  • The market has processed all available information, which is reflected in the price chart, which is an underlying assumption of technical analysis.

The Power of Candlestick Patterns

Candlestick patterns are one of the most effective technical analysis tools. These patterns can help identify potential trend reversals or continuations and provide valuable insights into market sentiment. Let’s look at some of the most important candlestick patterns:

  1. Engulfing Bullish Pattern
    When a small bearish candle is followed by a larger bullish candle that completely engulfs the previous candle’s range, the bullish engulfing pattern occurs. This pattern indicates a possible trend reversal from bearish to bullish and could indicate a buying opportunity.
  2. Harami Bearish Pattern
    When a large bullish candle is followed by a smaller bearish candle that is completely engulfed by the previous candle’s range, the bearish harami pattern is formed. This pattern suggests a possible trend reversal from bullish to bearish and may serve as a signal to sell or take profits.
  3. The Doji Pattern
    A candlestick pattern with a small body and long wicks on both ends is known as a doji. It represents market indecision and suggests that buyers and sellers are in equilibrium. A doji pattern can indicate a possible trend reversal, especially if it forms at critical support or resistance levels.

Trend Analysis and Moving Averages

Trend analysis is important in technical analysis because it helps traders determine the market’s direction. Moving averages are popular indicators for smoothing out price data and providing a more accurate picture of the underlying trend. Here are some examples of moving averages:

1. Simple Moving Average (SMA)

The simple moving average computes an asset’s average price over a given time period. The 50-day and 200-day moving averages are frequently used by traders to identify long-term trends. When the shorter-term moving average crosses above the longer-term moving average, a bullish signal is generated, indicating the possibility of an uptrend.

2. Exponential Moving Average (EMA)

The exponential moving average gives more weight to recent price data, making it more sensitive to market changes. Many traders prefer to use EMAs because they provide a more immediate indication of trend reversals. For short-term analysis, the 9-day and 21-day EMAs are commonly used.

Advantages of Technical Analysis:

  1. Technical analysis is based on unbiased information, such as price, volume, and historical trends. By doing this, trading decisions may be made without emotional bias.
  2. Any tradable asset with historical price data, including stocks, currencies, commodities, and virtual currencies, can benefit from the use of technical analysis.
  3. Timing: By giving traders tools for locating entry and exit points, it enables them to better time their trades.
  4. Focus on the Short Term: Technical analysis is ideal for traders who are interested in making short-term price movements into profits.
  5. Patterns and Trends: By allowing traders to spot different patterns and trends in price charts, which can act as helpful signals for potential price movements, traders can better predict future price movements.
  6. Risk management: Trading can be made easier by using technical analysis to help traders set stop-loss and take-profit levels.
  7. Market psychology: It takes into account the notion that market prices reflect the general psychology and emotions of traders, which can reveal information about the mood of the market.

Disadvantages of Technical Analysis:

  1. Subjectivity: Different traders may arrive at different conclusions from the same data due to the subjective nature of how chart patterns and indicators are interpreted.
  2. Technical analysis solely relies on historical data, which, particularly in markets that are undergoing rapid change, may not always accurately reflect future market conditions.
  3. Limited Fundamental Analysis: For long-term investors, fundamental information on company finances or macroeconomic trends can be very important. Technical analysis, however, largely ignores these issues.
  4. Subjectivity: Different traders may arrive at different conclusions from the same data due to the subjective nature of how chart patterns and indicators are interpreted.
  5. Black Swan Events: Unexpected events like economic crises or geopolitical shocks are difficult to predict or prepare for using technical analysis.

FOR MORE INFO CLICK THIS SITE:https://learningsharks.in/

FOLLOW OUR PAGE:https://www.instagram.com/learningsharks/?hl=en

Understanding Market Psychology

The stock market is a vital part of the Indian economy.

Market psychology is an intriguing feature of the financial markets that frequently has a big impact on how they move. It alludes to the various psychological and emotional elements that affect traders’ and investors’ choices. Anyone involved in the financial markets needs to have a solid understanding of market psychology because it can offer useful insights into market behavior and assist investors in making wise choices.

KEY TAKEAWAYS

  • Market psychology refers to the general consensus among market participants regarding how the market as a whole is feeling.
  • Market psychology can be influenced by greed, fear, anxiety, and excitement.
  • Traditional financial theory made the erroneous assumption that prices were always determined by rational factors, leaving out the potentially irrational influence of market psychology.

The Fundamentals of Market Psychology

  • Trading Emotions: The way that emotions affect market movements is crucial. Inconsistent market behavior is frequently caused by the erratic nature of human emotion. Investors and traders frequently go through emotional ups and downs, ranging from greed and euphoria to fear and panic. Volatile price swings are the result of this emotional ups and downs.
  • Herd Behavior: The herd mentality is one of the most pervasive phenomena in market psychology. Investors frequently follow the herd in order to avoid losses or to avoid missing out on potential gains. As entire groups act in unison, frequently without a clear understanding of the assets they are investing in, this behavior can result in bubbles and crashes.
  • Cognitive Disparities: Confirmation bias and overconfidence are two cognitive biases that can skew judgment and decision-making. Traders might look for information that supports their current beliefs while ignoring evidence to the contrary. For trading to be successful, these biases must be identified and minimized.

The Role of Fear and Greed

  • Fear
    The emotion that rules the financial markets is fear. During recessions, it may cause panic selling, escalating market crashes. Risk management and capital preservation require an understanding of the psychological factors that influence decisions based on fear.
  • Greed
    On the other hand, greed can fuel irrational exuberance, sending asset prices through the roof. Making wise investment decisions and avoiding asset bubbles depend on being able to identify when greed is driving the market.

Psychological Support and Resistance

  • Assistance Levels
    Technical analysis support levels and psychological thresholds frequently coincide. For instance, a stock may find support at $100, which investors consider to be a good price. Setting effective stop-loss orders requires an understanding of how psychological factors affect the strength of support levels.
  • Rigidity Levels
    Investors are often hesitant to buy at certain points, known as resistance levels, for psychological reasons. Trading professionals can anticipate potential price ceilings and make wise decisions about when to enter or exit positions by identifying these levels.

Market Sentiment Indicators

Sentiment Assessment


Tools for sentiment analysis are used by traders and investors to gain an advantage in the market. These tools examine the tone of the news, the conversation on social media, and other sources to determine market sentiment. Including sentiment analysis in your trading strategy can offer insightful information.

Conclusion

Understanding market psychology gives you a leg up in the competitive world of the financial markets. Investors can make better choices if they are aware of the emotional drivers, cognitive biases, and psychological support and resistance levels. Market psychology is a dynamic field that adapts to shifting market dynamics and changes in consumer behavior. Continue your education, pay attention to market sentiment, and modify your strategies as necessary if you want to stay ahead.

FOR MORE INFO CLICK THIS SITE:https://learningsharks.in/

FOLLOW OUR PAGE:https://www.instagram.com/learningsharks/?hl=en

Mastering the Golden Rules of Investing in the Stock Market

Understanding the Basics

1. What is Stock Market Investment?

In order to invest in the stock market, one must buy ownership shares in publicly traded businesses. These shares, also referred to as stocks or equities, are a stake in some of the company’s resources and earnings. Investments in the stock market have the potential to increase in value and pay dividends.

2. The Significance of Research

Thorough research is essential prior to making any investment. This entails researching the company’s financial standing, past performance, and market trends. A thorough approach to research can assist you in making decisions that are in line with your financial goals.

The Golden Rules of Stock Market Investment

3. Diversification: Don’t Put All Your Eggs in One Basket

One of the most important investing rules is to diversify your portfolio. Risk can be reduced by distributing your investments across various industries, sectors, and asset classes.

4. Risk Tolerance Assessment

It’s important to know your level of risk tolerance. Do you favor a more conservative approach or are you comfortable with the idea of higher volatility in exchange for the possibility of higher returns? Identifying your level of risk tolerance can help you choose the right mix of investments for your portfolio.

5. Long-Term Perspective

Investments made in the stock market are frequently long-term commitments. The stock market has typically had an upward trend over time. You can withstand market fluctuations and gain from compounding returns by adopting a long-term perspective.

6. Regular Monitoring and Adjustment

Successful investors review their holdings on a regular basis and make adjustments in response to shifting market conditions and their financial objectives. Maintaining alignment with your goals requires monitoring your investments.

Investment Strategies

7. Value Investing

Value investing involves identifying undervalued stocks and purchasing them with the expectation that their true value will be recognized by the market over time. This approach, championed by investment legends like Warren Buffett, focuses on long-term growth.

8. Growth Investing

Growth investing aims to identify companies with significant growth potential. Investors in growth stocks anticipate higher-than-average earnings growth. This strategy can be lucrative but carries higher risk.

9. Dividend Investing

Dividend investing involves building a portfolio of stocks from companies that regularly pay dividends. This strategy provides a steady stream of income, making it an attractive option for income-oriented investors.

Conclusion

In the world of stock market investment, knowledge is power. By adhering to the golden rules and adopting sound investment strategies, you can navigate the stock market with confidence. Remember that investing involves risk, and it’s essential to consult with a financial advisor to tailor your investment approach to your unique financial situation and goals.

FOR MORE INFO CLICK THIS SITE:https://learningsharks.in/

FOLLOW OUR PAGE:https://www.instagram.com/learningsharks/?hl=en