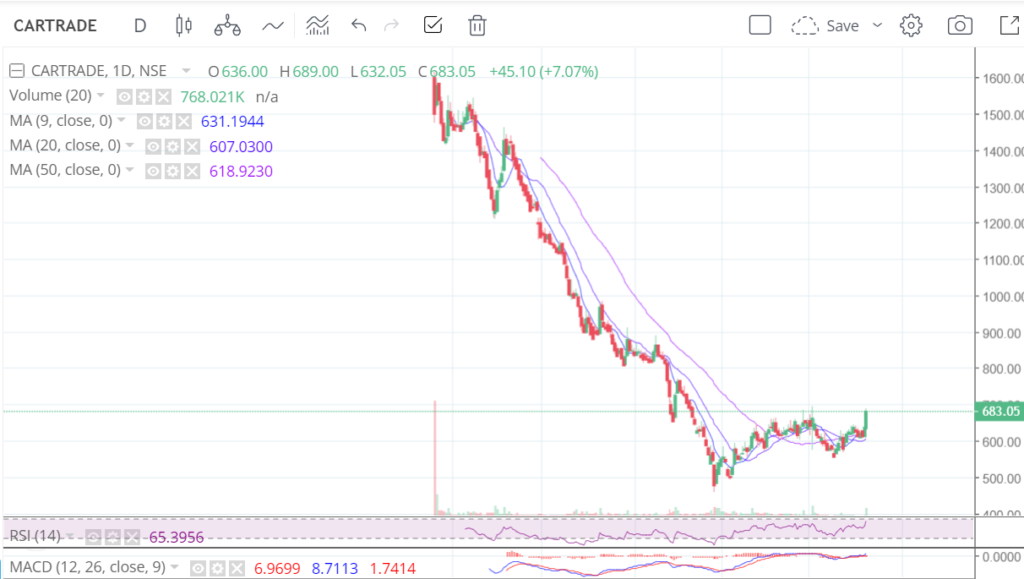
After a continuous fall from the listing price of 1600 per share. CARTRADE seemed to have found its bottom. Currently, the share is trading at 683.
Should you get in?
Looking at the chart of this share, it seems not the worst. Although MACD suggests a good entry that’s all. Stock could trade at the same levels for a while before it takes some bait. For now it shall stay sideways.
Looking at the fundamentals of the stock. with Market Cap₹ 3,194 Cr. CARTRADE is a loss-making company.
Mar 2016 | Mar 2017 | Mar 2019 | Mar 2020 | Mar 2021 | Mar 2022 | |
|---|---|---|---|---|---|---|
| Sales + | 33 | 78 | 243 | 298 | 250 | 313 |
| Expenses + | 195 | 131 | 213 | 258 | 210 | 447 |
| Operating Profit | -162 | -53 | 30 | 40 | 40 | -134 |
| OPM % | -499% | -68% | 12% | 14% | 16% | -43% |
| Other Income + | 18 | 20 | 24 | 20 | 32 | 46 |
| Interest | 0 | 0 | 3 | 4 | 5 | 6 |
| Depreciation | 1 | 3 | 15 | 17 | 20 | 25 |
| Profit before tax | -146 | -37 | 35 | 39 | 47 | -119 |
| Tax % | -0% | 0% | 27% | 20% | -115% | -2% |
| Net Profit | -146 | -37 | 17 | 22 | 91 | -132 |
There are much better options available in the market to put in your money. Looking at the shareholding pattern .
Shareholding Pattern
Numbers in percentagesINSIDER TRADES
| Sep 2021 | Dec 2021 | Mar 2022 | |
|---|---|---|---|
| FIIs + | 16.03 | 17.21 | 17.55 |
| DIIs + | 8.18 | 7.46 | 6.20 |
| Public + | 75.79 | 75.33 | 76.25 |
The public has the largest share holding in this stock. While FII and DII hold the least 17.55 and 6.20 respectively. Overall, this is not a recommended share.
TO learn how to read a balance sheet, enrol in our fundamental analysis course.